Basisstatistiken
| Institutionelle Aktien (Long) | 47.513.515 - 52,05% (ex 13D/G) - change of -9,13MM shares -16,12% MRQ |
| Institutioneller Wert (Long) | $ 1.446.710 USD ($1000) |
Institutioneller Eigentümerschaft und Aktionäre
TowneBank (US:TOWN) hat 276 institutionelle Eigentümer und Aktionäre, die 13D/G oder 13F Formulare bei der Securities Exchange Commission (SEC) eingereicht haben. Diese Institutionen halten insgesamt 47,513,515 Aktien. Die größten Aktionäre sind Vanguard Group Inc, BlackRock, Inc., Dimensional Fund Advisors Lp, T. Rowe Price Investment Management, Inc., State Street Corp, Victory Capital Management Inc, Geode Capital Management, Llc, Brown Advisory Inc, Charles Schwab Investment Management Inc, and Royce & Associates Lp .
TowneBank (NasdaqGS:TOWN) Die institutionelle Eigentümerstruktur zeigt die aktuellen Positionen von Institutionen und Fonds im Unternehmen sowie die jüngsten Veränderungen der Positionsgröße. Zu den Großaktionären können Einzelanleger, Investmentfonds, Hedgefonds oder Institutionen gehören. Der Schedule 13D zeigt an, dass der Investor mehr als 5% des Unternehmens hält (oder gehalten hat) und beabsichtigt (oder beabsichtigt hat), aktiv eine Änderung der Geschäftsstrategie zu verfolgen. Schedule 13G zeigt eine passive Investition von über 5% an.
The share price as of April 24, 2026 is 35,20 / share. Previously, on April 28, 2025, the share price was 32,90 / share. This represents an increase of 6,99% over that period.

Fondsstimmung-Score
Der Fondsstimmung-Score (auch bekannt als Eigentümer-Akkumulations-Score) ermittelt die Aktien, die am meisten von Fonds gekauft werden. Er ist das Ergebnis eines ausgeklügelten quantitativen Multifaktormodells, das die Unternehmen mit den höchsten institutionellen Käufen identifiziert. Das Scoring-Modell verwendet eine Kombination aus der Gesamtzunahme der offengelegten Eigentümer, den Änderungen der Portfolioallokationen in diesen Eigentümern und anderen Metriken. Die Zahl reicht von 0 bis 100, wobei höhere Zahlen ein höheres Maß an Kapitalakkumulation als bei anderen Unternehmen anzeigen und 50 den Durchschnitt darstellt.
Aktualisierungshäufigkeit: Täglich
Siehe Ownership Explorer, der eine Liste der am höchsten bewerteten Unternehmen enthält.
AI+ Ask Fintel’s AI assistant about TowneBank.
Select a question to share a public post with an AI-crafted answer.
Thinking of good questions…
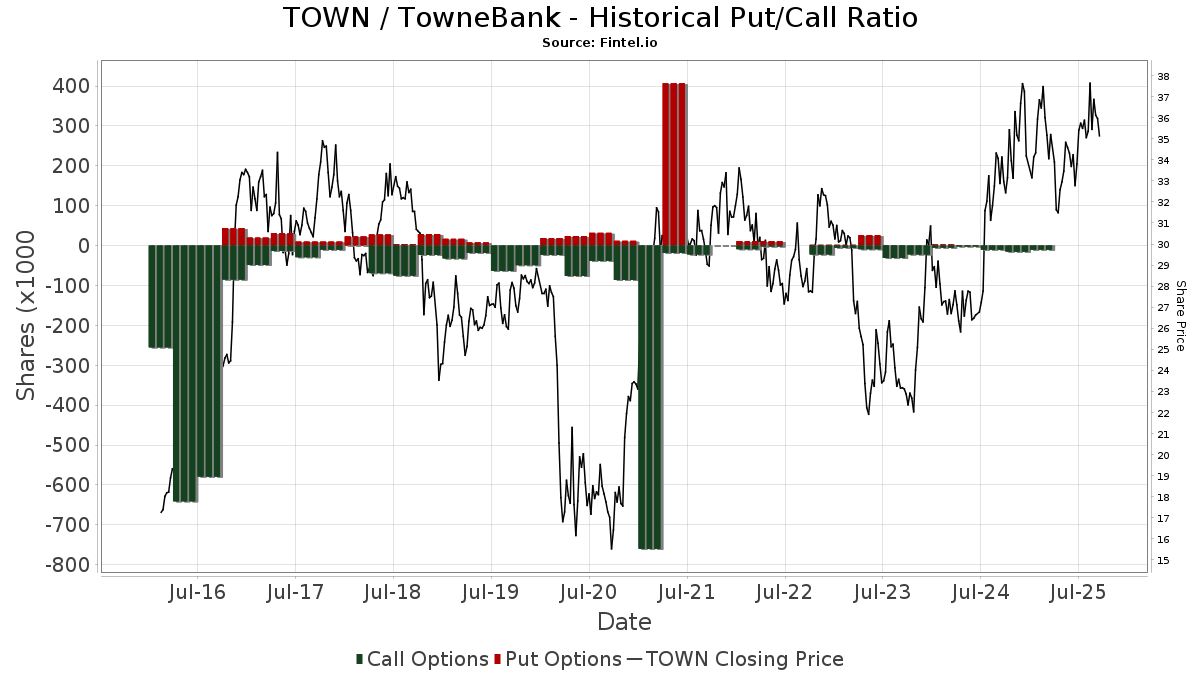
Institutionelles Put/Call-Verhältnis
Zusätzlich zur Meldung der Standardemissionen von Aktien und Schuldtiteln müssen Institute mit einem verwalteten Vermögen von mehr als 100 Mio. EUR auch ihre Bestände an Verkaufs- und Kaufoptionen offenlegen. Da Put-Optionen im Allgemeinen eine negative Stimmung und Call-Optionen eine positive Stimmung anzeigen, können wir uns ein Bild von der allgemeinen institutionellen Stimmung machen, indem wir das Verhältnis von Puts zu Calls aufzeichnen. Das Diagramm auf der rechten Seite zeigt das historische Put/Call-Verhältnis für dieses Instrument.
Die Verwendung des Put/Call-Verhältnisses als Indikator für die Anlegerstimmung überwindet einen der Hauptmängel der Verwendung des gesamten institutionellen Besitzes, der darin besteht, dass ein erheblicher Teil des verwalteten Vermögens passiv investiert wird, um Indizes abzubilden. Passiv verwaltete Fonds kaufen in der Regel keine Optionen, so dass der Indikator Put/Call-Verhältnis die Stimmung der aktiv verwalteten Fonds besser widerspiegelt.
13F und NPORT Einreichungen
Details zu 13F-Einreichungen sind kostenlos. Für Details zu NP-Einreichungen ist eine Premium-Mitgliedschaft erforderlich. Grüne Zeilen zeigen neue Positionen an. Rote Zeilen zeigen geschlossene Positionen an. Klicken Sie auf das Link Symbol, um den gesamten Transaktionsverlauf zu sehen.
Upgrade
um Prämiendaten freizuschalten und nach Excel zu exportieren ![]() .
.
| Datei Datum | Quelle | Anleger | Typ | Durchschnittlicher Preis (Est) |
Aktien | Δ Aktien (%) |
Gemeldeter Wert ($1000) |
Δ Wert (%) |
Port Alloc (%) |
|
|---|---|---|---|---|---|---|---|---|---|---|
| 2026-02-11 | 13F | Franklin Resources Inc | 34.639 | 18,00 | 1.156 | 13,91 | ||||
| 2026-02-13 | 13F | Charles Schwab Investment Management Inc | 812.010 | -0,63 | 27.097 | -4,08 | ||||
| 2026-01-30 | 13F | Laurel Wealth Advisors LLC | 405 | 13 | ||||||
| 2026-02-17 | 13F | Tower Research Capital LLC (TRC) | 11.101 | 419,95 | 370 | 406,85 | ||||
| 2026-02-17 | 13F | Aqr Capital Management Llc | 119.912 | 21,39 | 4.001 | 17,19 | ||||
| 2026-01-28 | 13F | Kanawha Capital Management Llc | 30.861 | -0,13 | 1.030 | -3,65 | ||||
| 2026-02-17 | 13F | Raymond James Financial Inc | 244.039 | -5,31 | 8.144 | -8,60 | ||||
| 2026-01-29 | 13F | Dunhill Financial, LLC | 1 | 0 | ||||||
| 2026-02-10 | 13F | Nomura Asset Management Co Ltd | 670 | 0,00 | 22 | -4,35 | ||||
| 2026-04-22 | 13F | Bay Capital Advisors, LLC | 33.760 | 0,00 | 1.137 | 0,89 | ||||
| 2026-02-12 | 13F | Steward Partners Investment Advisory, Llc | 20.980 | 0,00 | 700 | -3,45 | ||||
| 2026-02-13 | 13F | SRS Capital Advisors, Inc. | 112 | -94,43 | 4 | -95,65 | ||||
| 2026-02-17 | 13F | Susquehanna Fundamental Investments, Llc | 22.009 | 0,00 | 734 | -3,42 | ||||
| 2026-02-05 | 13F | HFM Investment Advisors, LLC | 4 | 0,00 | 0 | |||||
| 2026-02-17 | 13F | Susquehanna Portfolio Strategies, LLC | 27.294 | -23,10 | 911 | -25,77 | ||||
| 2026-02-12 | 13F | Commonwealth Equity Services, Llc | 9.708 | -6,06 | 324 | |||||
| 2026-02-13 | 13F | Manufacturers Life Insurance Company, The | 0 | -100,00 | 0 | |||||
| 2026-02-13 | 13F | De Lisle Partners LLP | 76.731 | -34,21 | 2.561 | -36,51 | ||||
| 2026-02-17 | 13F | Jain Global LLC | 7.331 | 245 | ||||||
| 2026-02-11 | 13F | Simplex Trading, Llc | Put | 500 | 0,00 | 17 | ||||
| 2026-02-11 | 13F | Simplex Trading, Llc | 17 | -43,33 | 1 | |||||
| 2026-02-11 | 13F | Brandywine Global Investment Management, LLC | 49.020 | 0,57 | 1.636 | -2,97 | ||||
| 2026-02-12 | 13F | Quadrant Capital Group Llc | 15.327 | 0,25 | 511 | -3,22 | ||||
| 2026-02-13 | 13F | Mml Investors Services, Llc | 11.269 | -28,68 | 376 | -31,14 | ||||
| 2026-04-13 | 13F | IFP Advisors, Inc | 60 | -14,29 | 2 | 0,00 | ||||
| 2026-02-05 | 13F | Cambridge Investment Research Advisors, Inc. | 22.764 | 59,62 | 1 | |||||
| 2026-02-17 | 13F | Advisor Group Holdings, Inc. | 34.543 | -62,59 | 1.153 | -63,99 | ||||
| 2026-02-19 | 13F/A | T. Rowe Price Investment Management, Inc. | 3.958.862 | -8,36 | 132 | -11,41 | ||||
| 2025-11-12 | 13F | Aster Capital Management (DIFC) Ltd | 0 | -100,00 | 0 | |||||
| 2026-02-13 | 13F | Jacobs Levy Equity Management, Inc | 0 | -100,00 | 0 | |||||
| 2026-02-09 | 13F | Geode Capital Management, Llc | 1.811.213 | 0,70 | 60.448 | -2,79 | ||||
| 2026-02-05 | 13F | Td Private Client Wealth Llc | 7 | 0 | ||||||
| 2026-02-17 | 13F | Optiver Holding B.V. | 300 | -30,88 | 10 | -33,33 | ||||
| 2026-02-06 | 13F | EverSource Wealth Advisors, LLC | 633 | -15,71 | 21 | -16,00 | ||||
| 2026-01-30 | 13F | State of New Jersey Common Pension Fund D | 67.150 | 12,07 | 2.241 | 8,16 | ||||
| 2026-04-24 | 13F | SummerHaven Investment Management, LLC | 20.413 | -13,47 | 687 | -12,71 | ||||
| 2026-04-13 | 13F | Bay Rivers Group | 17.526 | 0,85 | 590 | 1,90 | ||||
| 2026-04-10 | 13F | Daytona Street Capital LLC | 498 | 17 | ||||||
| 2026-02-03 | 13F | Costello Asset Management, INC | 119 | 0,85 | 4 | -25,00 | ||||
| 2026-02-10 | 13F | Goldman Sachs Group Inc | 569.906 | 34,84 | 19.018 | 30,16 | ||||
| 2026-02-11 | 13F | O'shaughnessy Asset Management, Llc | 19.812 | -10,04 | 661 | -13,14 | ||||
| 2026-02-17 | 13F | Russell Investments Group, Ltd. | 231.383 | 4,84 | 7.721 | 1,21 | ||||
| 2026-02-10 | 13F | Rothschild Investment Llc | 61 | 22,00 | 2 | 100,00 | ||||
| 2026-02-09 | 13F | Royce & Associates Lp | 743.455 | 23,16 | 24.809 | 18,89 | ||||
| 2026-02-13 | 13F/A | Abound Financial, Llc | 800 | 27 | ||||||
| 2026-04-06 | 13F | Versant Capital Management, Inc | 897 | 7,94 | 30 | 11,11 | ||||
| 2026-04-20 | 13F | Apella Capital, LLC | 50.068 | 1.818 | ||||||
| 2026-02-11 | 13F | Deutsche Bank Ag\ | 61.143 | 4,34 | 2.040 | 0,74 | ||||
| 2026-02-10 | 13F | Envestnet Asset Management Inc | 39.756 | -23,10 | 1.327 | -25,80 | ||||
| 2025-11-06 | 13F | Oppenheimer & Co Inc | 0 | -100,00 | 0 | |||||
| 2026-04-24 | 13F | Wagner Wealth Management, Llc | 12.681 | 427 | ||||||
| 2026-01-30 | 13F | AMG National Trust Bank | 53.075 | 2,59 | 1.771 | -0,95 | ||||
| 2026-02-06 | 13F | Larson Financial Group LLC | 0 | -100,00 | 0 | |||||
| 2026-04-24 | 13F | Keybank National Association/oh | 12.804 | 0,12 | 431 | 1,17 | ||||
| 2026-02-02 | 13F | Seizert Capital Partners, Llc | 60.265 | 2.011 | ||||||
| 2026-02-17 | 13F | Citadel Advisors Llc | 171.328 | 73,52 | 5.717 | 67,51 | ||||
| 2026-02-05 | 13F | 1620 Investment Advisors, Inc. | 3.596 | 18,60 | 120 | 14,42 | ||||
| 2026-01-23 | 13F | Rsm Us Wealth Management Llc | 33.795 | -0,65 | 1.136 | -4,22 | ||||
| 2026-02-17 | 13F | Wellington Management Group Llp | 471.313 | 4,60 | 15.728 | 0,97 | ||||
| 2026-04-22 | 13F | Sterling Capital Management LLC | 2.851 | -32,82 | 96 | -32,62 | ||||
| 2026-02-12 | 13F | Tull Financial Group, Inc. | 6.446 | -26,89 | 215 | -29,28 | ||||
| 2026-02-17 | 13F | Trexquant Investment LP | 11.680 | 390 | ||||||
| 2026-02-10 | 13F | Mcrae Capital Management Inc | 8.574 | 0,00 | 286 | -3,38 | ||||
| 2026-02-13 | 13F | Morgan Stanley | 361.370 | 28,77 | 12.059 | 24,30 | ||||
| 2026-02-17 | 13F | Tudor Investment Corp Et Al | 15.960 | 533 | ||||||
| 2026-02-17 | 13F | Engineers Gate Manager LP | 36.599 | 1.221 | ||||||
| 2026-02-11 | 13F | Empowered Funds, LLC | 2.781 | 93 | ||||||
| 2026-02-06 | 13F | ProShare Advisors LLC | 13.427 | 6,89 | 448 | 3,23 | ||||
| 2026-02-17 | 13F | Balyasny Asset Management Llc | 0 | -100,00 | 0 | |||||
| 2026-01-08 | 13F | True Wealth Design, LLC | 0 | -100,00 | 0 | |||||
| 2026-02-13 | 13F | Baird Financial Group, Inc. | 29.443 | 0,00 | 983 | -3,44 | ||||
| 2026-02-13 | 13F | Public Employees Retirement Association Of Colorado | 11.658 | 0,00 | 0 | |||||
| 2026-02-05 | 13F | Atria Investments Llc | 8.324 | 278 | ||||||
| 2026-02-13 | 13F | Level Four Advisory Services, Llc | 22.397 | 0,00 | 747 | -3,49 | ||||
| 2026-01-28 | 13F | Universal- Beteiligungs- und Servicegesellschaft mbH | 12.915 | 1,97 | 431 | -1,60 | ||||
| 2026-01-23 | 13F | Assetmark, Inc | 74 | -96,30 | 2 | -97,10 | ||||
| 2026-02-13 | 13F | Entropy Technologies, LP | 12.560 | -9,45 | 419 | -12,53 | ||||
| 2026-02-10 | 13F | Connor, Clark & Lunn Investment Management Ltd. | 7.126 | -61,20 | 238 | -62,62 | ||||
| 2026-02-10 | 13F | Intech Investment Management Llc | 33.456 | -9,94 | 1.116 | -13,08 | ||||
| 2026-02-17 | 13F | Dark Forest Capital Management Lp | 35.831 | -64,85 | 1.196 | -66,08 | ||||
| 2026-02-13 | 13F | State Street Corp | 2.138.398 | 1,01 | 71.931 | -2,46 | ||||
| 2026-02-24 | 13F | DGS Capital Management, LLC | 7.087 | 236 | ||||||
| 2025-11-14 | 13F | Aquatic Capital Management LLC | 0 | -100,00 | 0 | -100,00 | ||||
| 2025-11-14 | 13F | ExodusPoint Capital Management, LP | 74.097 | 2.562 | ||||||
| 2026-04-15 | 13F | DAVENPORT & Co LLC | 103.556 | 17,66 | 3.487 | 18,73 | ||||
| 2026-02-17 | 13F | Clark Capital Management Group, Inc. | 17.644 | -94,83 | 589 | -95,02 | ||||
| 2026-02-17 | 13F | Guggenheim Capital Llc | 98.514 | 0,98 | 3.287 | -2,52 | ||||
| 2026-02-03 | 13F | F/M Investments LLC | 86.804 | 36,59 | 2.897 | 31,88 | ||||
| 2026-04-22 | 13F | Old Point Trust & Financial Services N A | 201.876 | -1,29 | 6.797 | -0,40 | ||||
| 2026-01-29 | 13F | Comerica Bank | 2.219 | 32,40 | 74 | 29,82 | ||||
| 2026-02-13 | 13F | Verition Fund Management LLC | 60.622 | 139,65 | 2.023 | 131,35 | ||||
| 2026-04-20 | 13F | City State Bank | 300 | 0,00 | 10 | 0,00 | ||||
| 2026-04-16 | 13F | Ellsworth Advisors, LLC | 10.677 | 0,00 | 359 | -4,52 | ||||
| 2026-04-06 | 13F | GAMMA Investing LLC | 265 | 16,74 | 9 | 14,29 | ||||
| 2025-11-14 | 13F | Point72 Asia (Singapore) Pte. Ltd. | 5.931 | 205 | ||||||
| 2026-02-17 | 13F | State Of Wisconsin Investment Board | 0 | -100,00 | 0 | |||||
| 2026-04-07 | 13F | Signaturefd, Llc | 2.038 | -10,50 | 69 | -9,33 | ||||
| 2026-04-08 | 13F | Legacy Wealth Asset Management, LLC | 6.128 | 206 | ||||||
| 2026-04-23 | 13F | SJS Investment Consulting Inc. | 18 | 80,00 | 1 | |||||
| 2026-02-17 | 13F | Hotchkis & Wiley Capital Management Llc | 182.009 | 3,89 | 6.074 | 0,28 | ||||
| 2026-02-17 | 13F | Vista Investment Management | 19.124 | 1,35 | 638 | -2,15 | ||||
| 2026-02-13 | 13F | Citigroup Inc | 81.837 | 10,73 | 2.731 | 6,89 | ||||
| 2026-02-17 | 13F | Persistent Asset Partners Ltd | 0 | -100,00 | 0 | |||||
| 2026-02-09 | 13F | Quest Partners LLC | 53.128 | 5,70 | 1.773 | 2,01 | ||||
| 2026-02-09 | 13F | Keating Financial Advisory Services, Inc. | 26 | 1 | ||||||
| 2026-04-15 | 13F | Signature Estate & Investment Advisors Llc | 6.727 | 0,00 | 226 | 0,89 | ||||
| 2026-02-17 | 13F | Prosperity Consulting Group, LLC | 11.575 | -1,45 | 386 | -4,93 | ||||
| 2026-02-10 | 13F | Bank of New York Mellon Corp | 483.205 | -9,50 | 16.125 | -12,64 | ||||
| 2026-04-24 | 13F | John W. Rosenthal Capital Management, Inc. | 62.000 | 0,00 | 2.088 | 0,92 | ||||
| 2026-02-12 | 13F | Elo Mutual Pension Insurance Co | 0 | -100,00 | 0 | |||||
| 2026-01-20 | 13F | Harbor Capital Advisors, Inc. | 255 | -1,54 | 0 | |||||
| 2026-02-12 | 13F | Voya Investment Management Llc | 12.925 | -0,42 | 431 | -3,79 | ||||
| 2026-02-12 | 13F | CIBC Private Wealth Group, LLC | 900 | 2,62 | 30 | 0,00 | ||||
| 2026-01-23 | 13F | Aldebaran Financial Inc. | 6.000 | 0,00 | 202 | -2,90 | ||||
| 2026-02-17 | 13F | Captrust Financial Advisors | 52.081 | 13,40 | 1.738 | 9,45 | ||||
| 2026-02-11 | 13F | Jpmorgan Chase & Co | 392.863 | 18,71 | 13.110 | 14,59 | ||||
| 2026-01-30 | 13F | Torren Management, LLC | 293 | 10 | ||||||
| 2026-02-13 | 13F | Bridgewater Associates, LP | 156.002 | 75,17 | 5.206 | 69,10 | ||||
| 2026-02-17 | 13F | Two Sigma Investments, Lp | 73.120 | -28,73 | 2.440 | -31,19 | ||||
| 2026-02-10 | 13F | Hillsdale Investment Management Inc. | 0 | -100,00 | 0 | -100,00 | ||||
| 2026-02-17 | 13F | Price T Rowe Associates Inc /md/ | 90.356 | 2,79 | 3 | 0,00 | ||||
| 2026-02-17 | 13F | California State Teachers Retirement System | 71.771 | 3,94 | 2.395 | 0,29 | ||||
| 2026-02-10 | 13F | Acadian Asset Management Llc | 14.441 | 0 | ||||||
| 2026-02-11 | 13F | Group One Trading, L.p. | Put | 0 | -100,00 | 0 | -100,00 | |||
| 2026-02-13 | 13F | Brown Advisory Inc | 1.515.187 | 1,55 | 50.562 | -1,98 | ||||
| 2026-02-20 | 13F | Sunbelt Securities, Inc. | 15 | -37,50 | 1 | |||||
| 2025-11-21 | 13F/A | CIBC Bancorp USA Inc. | 7.831 | 271 | ||||||
| 2026-04-08 | 13F | DiNuzzo Private Wealth, Inc. | 12 | 0,00 | 0 | |||||
| 2026-02-13 | 13F | FJ Capital Management LLC | 182.586 | -17,92 | 6.093 | -20,78 | ||||
| 2026-04-14 | 13F | Compton Wealth Advisory Group, LLC | 10.007 | 0,00 | 340 | 1,80 | ||||
| 2026-02-11 | 13F | Janney Montgomery Scott LLC | 0 | -100,00 | 0 | |||||
| 2026-02-03 | 13F | Mitsubishi UFJ Kokusai Asset Management Co., Ltd. | 313 | 0,00 | 10 | 0,00 | ||||
| 2026-04-16 | 13F | Diversified Trust Co | 6.367 | 214 | ||||||
| 2026-02-05 | 13F | O'Brien Greene & Co. Inc | 16.042 | 0,00 | 535 | -3,43 | ||||
| 2026-02-17 | 13F | Sciencast Management LP | 6.972 | 233 | ||||||
| 2026-02-06 | 13F | Lsv Asset Management | 2.200 | 0,00 | 0 | |||||
| 2026-02-13 | 13F | MAI Capital Management | 47 | 2 | ||||||
| 2026-02-17 | 13F | Point72 Asset Management, L.P. | 183.490 | 1.739,13 | 6.123 | 1.679,94 | ||||
| 2026-02-02 | 13F | Truist Financial Corp | 64.657 | -1,28 | 2.158 | -4,73 | ||||
| 2026-02-11 | 13F | Wills Financial Group LLC | 6.000 | 200 | ||||||
| 2026-02-13 | 13F | Transamerica Financial Advisors, Inc. | 11 | 0 | ||||||
| 2026-04-22 | 13F | Pictet Asset Management Holding SA | 12.912 | 11,86 | 435 | 12,73 | ||||
| 2026-02-12 | 13F | BlackRock, Inc. | 5.416.989 | 0,19 | 180.765 | -3,28 | ||||
| 2026-02-13 | 13F | Quarry LP | 620 | 149,00 | 21 | 150,00 | ||||
| 2026-02-17 | 13F | Numerai GP LLC | 55.717 | 1.859 | ||||||
| 2026-02-13 | 13F | Squarepoint Ops LLC | 52.683 | 26,09 | 1.758 | 21,75 | ||||
| 2026-02-12 | 13F | MetLife Investment Management, LLC | 41.002 | -3,69 | 1.368 | -7,00 | ||||
| 2026-02-12 | 13F | Renaissance Technologies Llc | 679.139 | -2,63 | 22.663 | -6,01 | ||||
| 2026-04-21 | 13F | Financial Consulate, Inc | 0 | -100,00 | 0 | |||||
| 2026-02-17 | 13F | Ameriprise Financial Inc | 486.625 | -5,71 | 16.239 | -8,99 | ||||
| 2025-10-30 | 13F | Bailard, Inc. | 0 | -100,00 | 0 | |||||
| 2026-02-12 | 13F | First Western Trust Bank | 15.242 | -0,81 | 509 | -4,33 | ||||
| 2026-02-05 | 13F | Financial Security Advisor, Inc. | 38.342 | 3,75 | 1.290 | 0,16 | ||||
| 2026-02-11 | 13F | Parallel Advisors, LLC | 424 | 0,00 | 14 | 0,00 | ||||
| 2026-04-17 | 13F | Vermillion Wealth Management, Inc. | 7 | 0 | ||||||
| 2026-02-13 | 13F | Colony Group, LLC | 128.539 | -4,38 | 4.289 | -7,68 | ||||
| 2026-02-17 | 13F | Boothbay Fund Management, Llc | 0 | -100,00 | 0 | |||||
| 2026-02-10 | 13F | Bnp Paribas Arbitrage, Sa | 17.229 | 15,76 | 575 | 11,67 | ||||
| 2026-02-17 | 13F | Janus Henderson Group Plc | 706.605 | -3,82 | 23.580 | -7,16 | ||||
| 2026-02-13 | 13F | Great West Life Assurance Co /can/ | 13.059 | 93,52 | 0 | |||||
| 2026-04-24 | 13F | Deprince Race & Zollo Inc | 189.953 | 8,28 | 6.396 | 9,24 | ||||
| 2026-02-11 | 13F | Cerity Partners LLC | 116.319 | -0,20 | 3.882 | -3,67 | ||||
| 2026-02-12 | 13F | State Board Of Administration Of Florida Retirement System | 24.170 | -7,88 | 807 | -11,14 | ||||
| 2026-02-05 | 13F | Thrivent Financial For Lutherans | 22.746 | 0,00 | 1 | |||||
| 2026-04-07 | 13F | Eastern Bank | 3.320 | 0,00 | 112 | 0,91 | ||||
| 2026-02-11 | 13F | Ameritas Investment Partners, Inc. | 6.137 | 205 | ||||||
| 2026-02-10 | 13F/A | Northwestern Mutual Wealth Management Co | 2.158 | 0,00 | 72 | -2,70 | ||||
| 2026-04-16 | 13F | SG Americas Securities, LLC | 25.955 | -37,36 | 1 | -100,00 | ||||
| 2026-02-13 | 13F | Edgestream Partners, L.P. | 24.139 | -84,44 | 806 | -84,99 | ||||
| 2026-02-17 | 13F | PMC FIG Opportunities LLC | 0 | -100,00 | 0 | |||||
| 2025-11-13 | 13F | Norges Bank | 0 | -100,00 | 0 | |||||
| 2026-01-26 | 13F | Main Street Group, LTD | 0 | -100,00 | 0 | |||||
| 2026-02-14 | 13F | Rockefeller Capital Management L.P. | 5.531 | 3,93 | 185 | 0,55 | ||||
| 2026-02-13 | 13F | Rhumbline Advisers | 112.584 | -6,92 | 3.757 | -10,17 | ||||
| 2026-02-12 | 13F | Hrt Financial Lp | 0 | -100,00 | 0 | |||||
| 2026-02-17 | 13F | Jones Financial Companies Lllp | 1.202 | 39,44 | 40 | 33,33 | ||||
| 2026-01-23 | 13F | Arbor Investment Advisors, LLC | 0 | -100,00 | 0 | |||||
| 2026-02-02 | 13F | Oak Harbor Wealth Partners, Llc | 6.740 | 0,00 | 225 | -3,86 | ||||
| 2026-02-11 | 13F | Los Angeles Capital Management Llc | 1.294 | 42 | ||||||
| 2025-10-27 | 13F | PBMares Wealth Management LLC | 24.296 | 0,12 | 840 | 1,21 | ||||
| 2026-04-20 | 13F | Jfs Wealth Advisors, Llc | 40 | -32,20 | 1 | 0,00 | ||||
| 2026-01-22 | 13F | Richardson Financial Services Inc. | 63 | -92,28 | 2 | -92,86 | ||||
| 2026-02-13 | 13F | Wells Fargo & Company/mn | 135.269 | 34,43 | 4.514 | 29,76 | ||||
| 2026-04-07 | 13F | Farther Finance Advisors, LLC | 448 | 10,62 | 15 | 15,38 | ||||
| 2026-02-12 | 13F | Nuveen, LLC | 455.280 | 13,05 | 15.193 | 9,12 | ||||
| 2026-02-13 | 13F | Smartleaf Asset Management LLC | 464 | 188,20 | 16 | 200,00 | ||||
| 2026-02-10 | 13F | Quantbot Technologies LP | 3.601 | 120 | ||||||
| 2026-04-08 | 13F | Wealth Enhancement Advisory Services, Llc | 9.430 | -8,99 | 320 | -10,39 | ||||
| 2026-02-09 | 13F | Hartland & Co., LLC | 156.468 | -0,58 | 5.221 | -4,03 | ||||
| 2026-02-13 | 13F | Ieq Capital, Llc | 0 | -100,00 | 0 | |||||
| 2026-02-13 | 13F | Marshall Wace, Llp | 198.084 | 6.610 | ||||||
| 2026-02-17 | 13F | Quantinno Capital Management LP | 9.126 | -23,98 | 305 | -26,75 | ||||
| 2025-11-14 | 13F | Brevan Howard Capital Management LP | 0 | -100,00 | 0 | |||||
| 2026-02-13 | 13F | Martingale Asset Management L P | 113.633 | 25,39 | 3.792 | 21,04 | ||||
| 2026-02-05 | 13F | Amalgamated Bank | 2.308 | -5,37 | 0 | |||||
| 2026-02-12 | 13F | Wealthspire Advisors, LLC | 0 | -100,00 | 0 | |||||
| 2026-01-28 | 13F | Arizona State Retirement System | 21.410 | 1,82 | 714 | -1,65 | ||||
| 2026-02-02 | 13F | Equitable Trust Co | 37.504 | 0,00 | 1.252 | -3,47 | ||||
| 2026-02-17 | 13F | D. E. Shaw & Co., Inc. | 19.707 | 658 | ||||||
| 2026-04-14 | 13F | Bay Harbor Wealth Management, LLC | 8 | 14,29 | 0 | |||||
| 2026-02-13 | 13F | American Century Companies Inc | 399.857 | -18,36 | 13.343 | -21,19 | ||||
| 2026-02-13 | 13F | Victory Capital Management Inc | 2.099.001 | -0,82 | 70.044 | -4,26 | ||||
| 2026-02-13 | 13F | Heritage Wealth Advisors | 116 | 0,00 | 4 | -25,00 | ||||
| 2026-04-23 | 13F | CWM Advisors, LLC | 15.199 | 9,04 | 512 | 9,89 | ||||
| 2026-02-13 | 13F | Sei Investments Co | 91.593 | 440,18 | 3.056 | 421,50 | ||||
| 2026-02-13 | 13F | Police & Firemen's Retirement System of New Jersey | 19.464 | -5,55 | 650 | -8,85 | ||||
| 2026-02-05 | 13F | Bessemer Group Inc | 2.331 | 8,82 | 0 | |||||
| 2026-02-17 | 13F | Royal Bank Of Canada | 14.246 | 4,97 | 475 | 1,28 | ||||
| 2026-02-17 | 13F | Northern Trust Corp | 633.572 | -8,16 | 21.142 | -11,35 | ||||
| 2026-02-06 | 13F | Gsa Capital Partners Llp | 7.067 | 0 | ||||||
| 2026-02-11 | 13F | LPL Financial LLC | 36.624 | -6,16 | 1.222 | -9,41 | ||||
| 2026-04-24 | 13F | Root Financial Partners, LLC | 383 | 50,20 | 13 | 50,00 | ||||
| 2026-02-12 | 13F | Dimensional Fund Advisors Lp | 4.339.745 | 0,40 | 144.819 | -3,09 | ||||
| 2025-11-14 | 13F | Centiva Capital, LP | 0 | -100,00 | 0 | -100,00 | ||||
| 2026-02-17 | 13F | Two Sigma Securities, Llc | 11.535 | 385 | ||||||
| 2025-11-12 | 13F | Park Square Financial Group, LLC | 0 | -100,00 | 0 | -100,00 | ||||
| 2026-04-14 | 13F | Opal Wealth Advisors, LLC | 603 | 20 | ||||||
| 2026-02-09 | 13F | Legal & General Group Plc | 78.125 | -6,01 | 2.607 | -9,26 | ||||
| 2026-02-05 | 13F | Allworth Financial LP | 17.577 | -0,15 | 587 | -3,62 | ||||
| 2026-02-17 | 13F | Alliancebernstein L.p. | 90.152 | 0,00 | 3.008 | -3,47 | ||||
| 2026-02-11 | 13F | Simplex Trading, Llc | Call | 0 | -100,00 | 0 | ||||
| 2026-02-17 | 13F | Mirabella Financial Services Llp | 27.145 | 906 | ||||||
| 2026-02-06 | 13F | Handelsbanken Fonder AB | 15.188 | 0,00 | 1 | |||||
| 2026-02-09 | 13F | Cary Street Partner Investment Advisory Llc | 49 | -46,15 | 2 | -66,67 | ||||
| 2026-02-09 | 13F | Cary Street Partners Financial Llc | 24.799 | -1,00 | 828 | -4,39 | ||||
| 2026-02-12 | 13F | Principal Securities, Inc. | 0 | -100,00 | 0 | -100,00 | ||||
| 2026-02-04 | 13F | Dogwood Wealth Management LLC | 121 | -36,32 | 4 | -33,33 | ||||
| 2026-02-13 | 13F | Pinnacle Wealth Planning Services, Inc. | 252 | 8 | ||||||
| 2026-02-17 | 13F | Two Sigma Advisers, Lp | 0 | -100,00 | 0 | |||||
| 2025-11-13 | 13F | Hsbc Holdings Plc | 0 | -100,00 | 0 | -100,00 | ||||
| 2026-02-12 | 13F | New York State Common Retirement Fund | 24.754 | 13,79 | 826 | 9,84 | ||||
| 2025-11-14 | 13F | Cubist Systematic Strategies, LLC | 113.181 | 36,46 | 3.913 | 38,04 | ||||
| 2026-01-28 | 13F | Kingswood Wealth Advisors, Llc | 0 | -100,00 | 0 | |||||
| 2026-01-28 | 13F | Klp Kapitalforvaltning As | 16.400 | 8,61 | 551 | 4,95 | ||||
| 2026-02-13 | 13F | Landscape Capital Management, L.l.c. | 6.620 | 0,00 | 221 | -3,51 | ||||
| 2026-02-17 | 13F | Cetera Investment Advisers | 55.123 | 612,64 | 1.839 | 588,76 | ||||
| 2026-02-17 | 13F | Susquehanna International Group, Llp | 99.581 | 24,00 | 3.323 | 19,70 | ||||
| 2026-02-17 | 13F | Susquehanna International Group, Llp | Call | 14.600 | 487 | |||||
| 2026-01-28 | 13F | Teacher Retirement System Of Texas | 9.212 | -54,66 | 307 | -56,27 | ||||
| 2026-02-17 | 13F | London Co Of Virginia | 0 | -100,00 | 0 | |||||
| 2026-01-30 | 13F | Us Bancorp \de\ | 20.047 | -0,72 | 669 | -4,30 | ||||
| 2026-02-12 | 13F | Jane Street Group, Llc | 81.297 | -31,00 | 2.713 | -33,42 | ||||
| 2026-04-17 | 13F | Old North State Wealth Management, LLC | 35.290 | 1.188 | ||||||
| 2026-02-06 | 13F | Covestor Ltd | 714 | 17.750,00 | 0 | |||||
| 2026-02-13 | 13F | Ubs Asset Management Americas Inc | 123.593 | 6,32 | 4.124 | 2,64 | ||||
| 2026-02-12 | 13F | Cibc World Markets Corp | 0 | -100,00 | 0 | |||||
| 2026-02-02 | 13F | Salzhauer Michael | 29.071 | 0,00 | 970 | -35,97 | ||||
| 2026-02-13 | 13F | Y-Intercept (Hong Kong) Ltd | 45.349 | 305,19 | 1.513 | 291,97 | ||||
| 2026-02-12 | 13F | Federated Hermes, Inc. | 24.793 | 898,11 | 827 | 872,94 | ||||
| 2026-02-19 | 13F | Invesco Ltd. | 90.394 | -22,49 | 3.016 | -25,18 | ||||
| 2026-02-12 | 13F | Cloud Capital Management, LLC | 0 | -100,00 | 0 | |||||
| 2026-02-17 | 13F | Voloridge Investment Management, Llc | 17.029 | 568 | ||||||
| 2026-02-13 | 13F | Stifel Financial Corp | 16.181 | 46,29 | 540 | 41,10 | ||||
| 2026-02-17 | 13F | Public Employees Retirement System Of Ohio | 853 | -92,91 | 28 | -93,27 | ||||
| 2026-02-13 | 13F | Integrated Wealth Concepts LLC | 14.826 | -1,27 | 495 | -4,82 | ||||
| 2026-01-26 | 13F | Lightrock Netherlands B.V. | 331.252 | 7,29 | 11.054 | 21,69 | ||||
| 2026-02-17 | 13F | MIRAE ASSET GLOBAL ETFS HOLDINGS Ltd. | 34.147 | 0,05 | 1.139 | -3,39 | ||||
| 2026-02-04 | 13F | LRI Investments, LLC | 111 | 42,31 | 4 | 50,00 | ||||
| 2026-02-17 | 13F | Occudo Quantitative Strategies Lp | 0 | -100,00 | 0 | |||||
| 2026-04-23 | 13F | MQS Management LLC | 14.548 | 119,76 | 490 | 122,27 | ||||
| 2026-01-20 | 13F | Ascent Group, LLC | 13.635 | -1,22 | 455 | -4,61 | ||||
| 2026-02-17 | 13F | EJF Capital LLC | 0 | -100,00 | 0 | |||||
| 2026-02-13 | 13F | Nfj Investment Group, Llc | 444.099 | 14.820 | ||||||
| 2026-01-29 | 13F | UBS Group AG | 216.702 | 36,85 | 7.231 | 32,12 | ||||
| 2026-02-13 | 13F | Yakira Capital Management, Inc. | 0 | -100,00 | 0 | |||||
| 2026-01-27 | 13F | Zurcher Kantonalbank (Zurich Cantonalbank) | 16.884 | 17,39 | 563 | 13,28 | ||||
| 2026-04-16 | 13F | XML Financial, LLC | 15.055 | 0,00 | 507 | 0,80 | ||||
| 2026-01-12 | 13F | Rialto Wealth Management, LLC | 7 | 16,67 | 0 | |||||
| 2026-02-13 | 13F | Rafferty Asset Management, LLC | 43.562 | -13,57 | 1.454 | -16,59 | ||||
| 2026-02-13 | 13F | Panagora Asset Management Inc | 147.329 | 4,64 | 4.916 | 1,01 | ||||
| 2026-02-17 | 13F | Advisory Services Network, LLC | 0 | -100,00 | 0 | |||||
| 2026-02-17 | 13F | rhino investment partners, Inc | 167.500 | 5.589 | ||||||
| 2026-04-22 | 13F | Peak Planning Group, LLC | 33.367 | -13,55 | 1.123 | -12,74 | ||||
| 2026-01-26 | 13F | Private Trust Co Na | 1.169 | 0,00 | 39 | -2,50 | ||||
| 2026-04-21 | 13F | Verity Asset Management, Inc. | 52.245 | 1.759 | ||||||
| 2026-02-13 | 13F | Bayview Asset Management, Llc | 55.000 | 1.835 | ||||||
| 2025-11-14 | 13F | Skopos Labs, Inc. | 0 | -100,00 | 0 | |||||
| 2026-04-02 | 13F | Ares Financial Consulting, LLC | 128 | 0,00 | 4 | 0,00 | ||||
| 2026-01-26 | 13F | Cwm, Llc | 3.681 | -26,91 | 0 | |||||
| 2026-04-20 | 13F | Live Oak Private Wealth LLC | 19.327 | 651 | ||||||
| 2026-02-09 | 13F | MTM Investment Management, LLC | 3.501 | 117 | ||||||
| 2025-11-19 | 13F | Caitong International Asset Management Co., Ltd | 0 | -100,00 | 0 | |||||
| 2026-02-05 | 13F | Gamco Investors, Inc. Et Al | 11.000 | 0,00 | 367 | -3,42 | ||||
| 2026-04-13 | 13F | Salem Investment Counselors Inc | 1.000 | 34 | ||||||
| 2026-02-17 | 13F | Creative Planning | 29.114 | -24,89 | 972 | -27,54 | ||||
| 2026-02-17 | 13F | Qube Research & Technologies Ltd | 344.750 | 27,69 | 11.504 | 23,26 | ||||
| 2026-04-13 | 13F | Massmutual Trust Co Fsb/adv | 23 | 0,00 | 1 | |||||
| 2026-02-06 | 13F | Global Retirement Partners, LLC | 207 | -81,25 | 7 | -84,21 | ||||
| 2026-04-22 | 13F | CrossGen Wealth, LLC | 928 | -41,64 | 31 | -41,51 | ||||
| 2026-01-15 | 13F | Nisa Investment Advisors, Llc | 2.855 | 0,18 | 96 | -3,03 | ||||
| 2026-01-29 | 13F | Vanguard Group Inc | 8.082.514 | 5,80 | 269.713 | 2,13 | ||||
| 2026-01-22 | 13F | Evermay Wealth Management Llc | 5.000 | 0,00 | 168 | -3,45 | ||||
| 2025-11-07 | 13F | BNP Paribas Asset Management Holding S.A. | 0 | -100,00 | 0 | |||||
| 2026-02-17 | 13F | Millennium Management Llc | 329.249 | 44,97 | 10.987 | 39,94 | ||||
| 2026-02-09 | 13F | Redmond Asset Management, LLC | 13.607 | 0,00 | 454 | -3,40 | ||||
| 2026-02-12 | 13F | Campbell & CO Investment Adviser LLC | 31.286 | 79,52 | 1.044 | 73,42 | ||||
| 2026-02-09 | 13F | Jefferies Financial Group Inc. | 16.926 | 7,64 | 565 | 3,87 | ||||
| 2026-02-17 | 13F | Wiley Bros.-aintree Capital, Llc | 10.428 | 3,16 | 348 | -0,57 | ||||
| 2026-02-11 | 13F | Group One Trading, L.p. | Call | 100 | 3 | |||||
| 2026-02-06 | 13F | Pnc Financial Services Group, Inc. | 251 | -2,71 | 8 | 0,00 | ||||
| 2026-02-13 | 13F | First Trust Advisors Lp | 70.241 | -14,17 | 2.344 | -17,18 | ||||
| 2026-04-17 | 13F | Novare Capital Management Llc | 36.500 | 1.229 | ||||||
| 2026-02-18 | 13F | Mackenzie Financial Corp | 0 | -100,00 | 0 | |||||
| 2026-02-12 | 13F | Swiss National Bank | 151.915 | 5,34 | 5.069 | 1,69 | ||||
| 2026-02-17 | 13F | Graham Capital Management, L.P. | 18.603 | 118,29 | 621 | 110,88 | ||||
| 2025-11-13 | 13F | Dynamic Technology Lab Private Ltd | 0 | -100,00 | 0 | |||||
| 2025-11-17 | 13F | Kestra Investment Management, LLC | 0 | -100,00 | 0 | -100,00 | ||||
| 2026-04-20 | 13F | Godsey & Gibb Associates | 283 | 0,00 | 10 | 0,00 | ||||
| 2026-02-17 | 13F | Fmr Llc | 6.795 | 57,51 | 227 | 51,68 | ||||
| 2026-02-13 | 13F | Maltese Capital Management Llc | 132.500 | 29,27 | 4.422 | 24,78 | ||||
| 2026-02-17 | 13F | Schonfeld Strategic Advisors LLC | 6.626 | -55,75 | 221 | -57,25 | ||||
| 2026-02-13 | 13F | Arrowstreet Capital, Limited Partnership | 647.314 | 5,54 | 21.601 | 1,88 | ||||
| 2026-01-29 | 13F | Concurrent Investment Advisors, LLC | 17.294 | 0,00 | 577 | -3,35 | ||||
| 2026-01-30 | 13F | American Capital Advisory, LLC | 6.755 | 0,00 | 225 | -3,43 | ||||
| 2026-02-13 | 13F | Mariner, LLC | 7.057 | -6,96 | 236 | -10,31 | ||||
| 2026-01-26 | 13F | KBC Group NV | 2.939 | 0,00 | 0 | |||||
| 2026-02-13 | 13F | Barclays Plc | 150.038 | 22,26 | 5.007 | 18,01 | ||||
| 2026-04-20 | 13F | State of Alaska, Department of Revenue | 3.116 | 0,00 | 0 | |||||
| 2026-02-11 | 13F | SOUTH STATE Corp | 2.316 | 0,00 | 77 | -3,75 | ||||
| 2026-02-13 | 13F | Prudential Financial Inc | 0 | -100,00 | 0 | |||||
| 2026-02-17 | 13F | Bank Of America Corp /de/ | 386.153 | 5,13 | 12.886 | 1,47 | ||||
| 2025-11-13 | 13F | Fuller & Thaler Asset Management, Inc. | 0 | -100,00 | 0 | |||||
| 2026-04-15 | 13F | Fortitude Family Office, LLC | 43 | 86,96 | 1 | |||||
| 2026-04-17 | 13F | BCS Wealth Management | 10.620 | -50,00 | 358 | -49,58 | ||||
| 2026-02-04 | 13F | Atlantic Union Bankshares Corp | 1.000 | 0,00 | 33 | -2,94 |
Other Listings
| DE:3T8 | 30,20 € |