Basisstatistiken
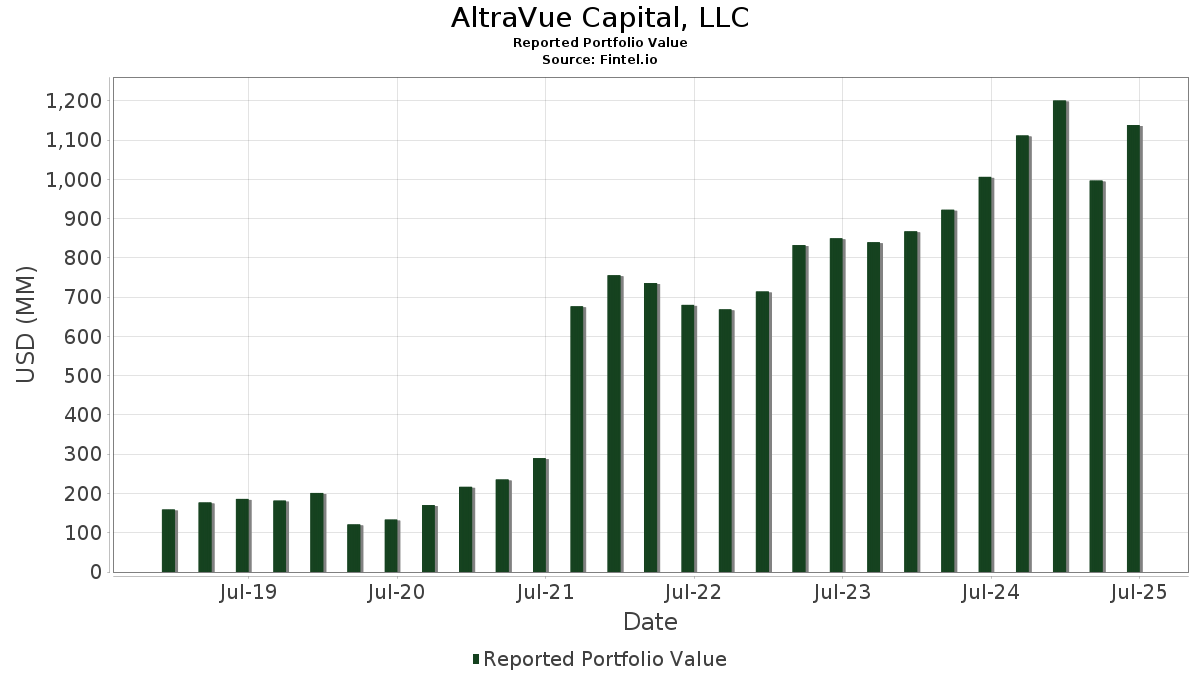
| Portfolio-Wert | $ 1.205.821.594 |
| Aktuelle Positionen | 25 |
Neueste Bestände, Performance, AUM (aus 13F, 13D)
AltraVue Capital, LLC hat 25 Gesamtbeteiligungen in seinen letzten SEC-Einreichungen offengelegt. Der jüngste Portfoliowert wird auf $ 1.205.821.594 USD berechnet. Das tatsächliche verwaltete Vermögen (AUM) ist dieser Wert plus Barmittel (die nicht offengelegt werden). AltraVue Capital, LLCs Top-Bestände sind StoneX Group Inc. (US:SNEX) , VSE Corporation (US:VSEC) , BGC Group, Inc. (US:BGC) , Winmark Corporation (US:WINA) , and ePlus inc. (US:PLUS) . AltraVue Capital, LLCs neue Positionen sind Climb Global Solutions, Inc. (DE:PYA) , . AltraVue Capital, LLCs wichtigste Branchen sind "Construction Special Trade Contractors" (sic 17) .
Top-Zuwächse in diesem Quartal
Wir verwenden die Veränderung der Portfolioallokation, weil dies die aussagekräftigste Kennzahl ist. Die Änderungen können auf Trades oder Änderungen der Aktienkurse zurückzuführen sein.
| Wertpapier | Aktien (MM) |
Wert (MM$) |
Portfolio % | ΔPortfolio % |
|---|---|---|---|---|
| WINA / Winmark Corporation | 0,17 | 86,77 | 7,1962 | 1,4609 |
| PYA / Climb Global Solutions, Inc. | 0,10 | 13,82 | 1,1459 | 1,1459 |
| AGX / Argan, Inc. | 0,25 | 66,85 | 5,5438 | 0,8464 |
| IESC / IES Holdings, Inc. | 0,17 | 66,12 | 4,9128 | 0,6735 |
| LYTS / LSI Industries Inc. | 1,34 | 31,62 | 2,6220 | 0,6614 |
| VSEC / VSE Corporation | 0,64 | 106,68 | 7,9269 | 0,6006 |
| DJCO / Daily Journal Corporation | 0,06 | 26,40 | 2,1895 | 0,5907 |
| IIIV / i3 Verticals, Inc. | 1,17 | 37,92 | 3,1443 | 0,3816 |
| BKR / Baker Hughes Company | 1,01 | 49,18 | 3,6546 | 0,2543 |
| CWCO / Consolidated Water Co. Ltd. | 0,71 | 25,04 | 2,0768 | 0,2427 |
Top-Rückgänge in diesem Quartal
Wir verwenden die Veränderung der Portfolioallokation, weil dies die aussagekräftigste Kennzahl ist. Änderungen können auf Handelsgeschäfte oder Änderungen der Aktienkurse zurückzuführen sein.
| Wertpapier | Aktien (MM) |
Wert (MM$) |
Portfolio % | ΔPortfolio % |
|---|---|---|---|---|
| PLTR / Palantir Technologies Inc. | 0,00 | 0,00 | -4,8495 | |
| SHO / Sunstone Hotel Investors, Inc. | 0,00 | 0,00 | -1,0915 | |
| BGC / BGC Group, Inc. | 9,80 | 92,70 | 7,6881 | -1,0557 |
| UFPT / UFP Technologies, Inc. | 0,15 | 30,70 | 2,2809 | -0,9512 |
| TFIN / Triumph Financial, Inc. | 1,24 | 62,16 | 5,1548 | -0,8086 |
| AGYS / Agilysys, Inc. | 0,35 | 36,84 | 2,7375 | -0,7164 |
| SNEX / StoneX Group Inc. | 1,31 | 132,58 | 9,8515 | -0,5733 |
| NOMD / Nomad Foods Limited | 1,28 | 16,86 | 1,3985 | -0,4768 |
| ULS / UL Solutions Inc. | 0,83 | 58,87 | 4,8820 | -0,4357 |
| PLUS / ePlus inc. | 1,00 | 71,21 | 5,9059 | -0,3993 |
13D/G Einreichungen
Dies ist eine Liste der 13D- und 13G-Einreichungen des letzten Jahres (falls vorhanden). Klicken Sie auf das Link-Symbol, um die vollständige Transaktionshistorie anzuzeigen. Grüne Zeilen zeigen neue Positionen an. Rote Zeilen zeigen geschlossene Positionen an.
| Datei Datum | Formular | Wertpapier | Vorherige Aktien |
Aktuelle Aktien |
ΔAktien % | % Eigentümerschaft |
% ΔEigentümerschaft | |
|---|---|---|---|---|---|---|---|---|
| 2026-01-21 | WINA / Winmark Corporation | 177.403 | 174.073 | -1,88 | 4,90 | -2,00 | ||
| 2026-01-14 | TFIN / Triumph Financial, Inc. | 1.210.459 | 1.515.877 | 25,23 | 6,40 | 25,49 |
13F und Fondseinreichungen
Dieses Formular wurde am 2025-11-12 für den Berichtszeitraum eingereicht 2025-09-30. Klicken Sie auf das Link-Symbol , um den gesamten Transaktionsverlauf zu sehen.
Upgrade um die Prämiendaten zu entsperren und nach Excel zu exportieren ![]() .
.
| Wertpapier | Typ | Durchschnittlicher Aktienkurs | Aktien (MM) |
ΔAktien (%) |
Wert ($MM) |
ΔAktien (%) |
Portfolio (%) |
ΔPortfolio (%) |
|
|---|---|---|---|---|---|---|---|---|---|
| SNEX / StoneX Group Inc. | 1,31 | 0,90 | 132,58 | 11,73 | 9,8515 | -0,5733 | |||
| VSEC / VSE Corporation | 0,64 | 0,79 | 106,68 | 27,93 | 7,9269 | 0,6006 | |||
| BGC / BGC Group, Inc. | 9,80 | 0,73 | 92,70 | -6,86 | 7,6881 | -1,0557 | |||
| WINA / Winmark Corporation | 0,17 | 0,83 | 86,77 | 32,92 | 7,1962 | 1,4609 | |||
| PLUS / ePlus inc. | 1,00 | 0,75 | 71,21 | -0,77 | 5,9059 | -0,3993 | |||
| AGX / Argan, Inc. | 0,25 | 2,07 | 66,85 | 25,02 | 5,5438 | 0,8464 | |||
| IESC / IES Holdings, Inc. | 0,17 | 2,07 | 66,12 | 37,02 | 4,9128 | 0,6735 | |||
| TFIN / Triumph Financial, Inc. | 1,24 | 0,85 | 62,16 | -8,43 | 5,1548 | -0,8086 | |||
| ULS / UL Solutions Inc. | 0,83 | 0,00 | 58,87 | -2,74 | 4,8820 | -0,4357 | |||
| BKR / Baker Hughes Company | 1,01 | 0,00 | 49,18 | 27,07 | 3,6546 | 0,2543 | |||
| NVR / NVR, Inc. | 0,01 | 0,00 | 43,07 | 8,79 | 3,2000 | -0,2778 | |||
| IIIV / i3 Verticals, Inc. | 1,17 | 2,07 | 37,92 | 20,57 | 3,1443 | 0,3816 | |||
| AGYS / Agilysys, Inc. | 0,35 | 2,07 | 36,84 | -6,29 | 2,7375 | -0,7164 | |||
| MAR / Marriott International, Inc. | 0,14 | 0,00 | 35,27 | -4,68 | 2,9249 | -0,3255 | |||
| LYTS / LSI Industries Inc. | 1,34 | 2,07 | 31,62 | 41,67 | 2,6220 | 0,6614 | |||
| UFPT / UFP Technologies, Inc. | 0,15 | 2,06 | 30,70 | -16,56 | 2,2809 | -0,9512 | |||
| TRIP / Tripadvisor, Inc. | 1,71 | 2,07 | 27,87 | 27,17 | 2,0708 | 0,1456 | |||
| DJCO / Daily Journal Corporation | 0,06 | 31,69 | 26,40 | 45,07 | 2,1895 | 0,5907 | |||
| UNH / UnitedHealth Group Incorporated | 0,08 | -3,04 | 26,11 | 7,32 | 1,9402 | -0,1973 | |||
| CWCO / Consolidated Water Co. Ltd. | 0,71 | 2,07 | 25,04 | 19,96 | 2,0768 | 0,2427 | |||
| FSV / FirstService Corporation | 0,13 | 2,07 | 24,01 | 11,34 | 1,7838 | -0,1104 | |||
| SIGA / SIGA Technologies, Inc. | 2,42 | -3,34 | 22,12 | 35,65 | 1,6437 | 0,2110 | |||
| NOMD / Nomad Foods Limited | 1,28 | 2,07 | 16,86 | -21,00 | 1,3985 | -0,4768 | |||
| JBI / Janus International Group, Inc. | 1,53 | 1,98 | 15,06 | 23,65 | 1,1192 | 0,0490 | |||
| PYA / Climb Global Solutions, Inc. | 0,10 | 13,82 | 1,1459 | 1,1459 | |||||
| PLTR / Palantir Technologies Inc. | 0,00 | -100,00 | 0,00 | -100,00 | -4,8495 | ||||
| SHO / Sunstone Hotel Investors, Inc. | 0,00 | -100,00 | 0,00 | -100,00 | -1,0915 |