Basisstatistiken
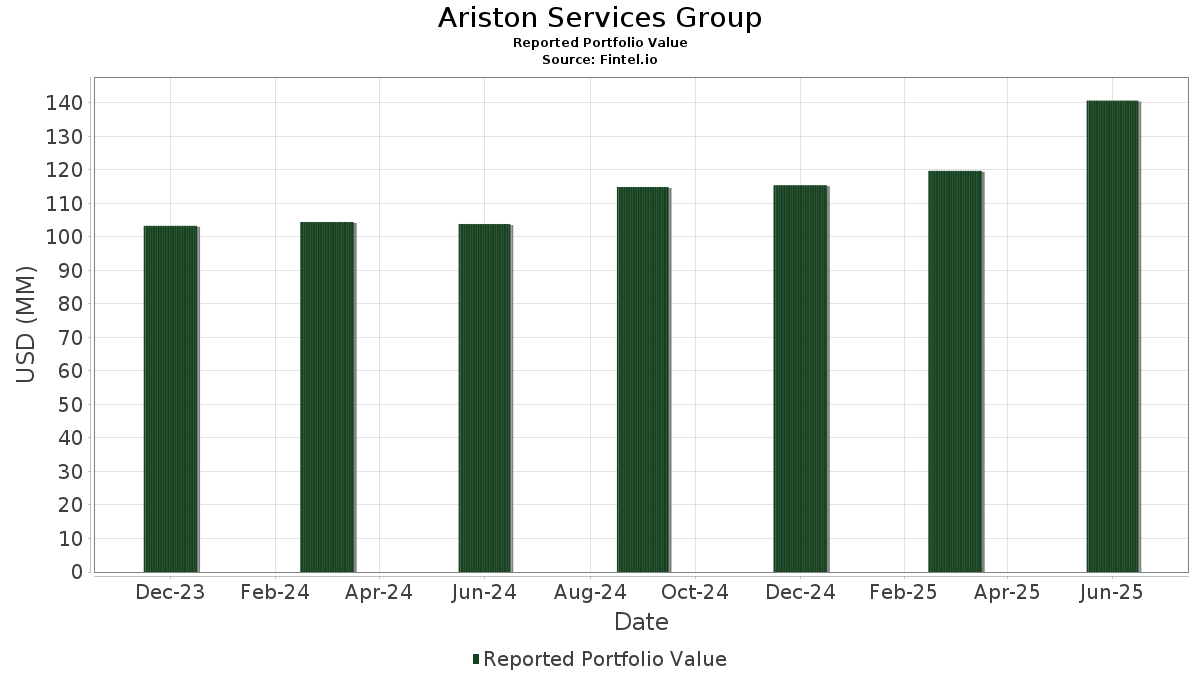
| Portfolio-Wert | $ 170.492.215 |
| Aktuelle Positionen | 70 |
Neueste Bestände, Performance, AUM (aus 13F, 13D)
Ariston Services Group hat 70 Gesamtbeteiligungen in seinen letzten SEC-Einreichungen offengelegt. Der jüngste Portfoliowert wird auf $ 170.492.215 USD berechnet. Das tatsächliche verwaltete Vermögen (AUM) ist dieser Wert plus Barmittel (die nicht offengelegt werden). Ariston Services Groups Top-Bestände sind Tesla, Inc. (US:TSLA) , Vanguard REIT Index Fund (US:VGRSX) , Vanguard Whitehall Funds - Vanguard High Dividend Yield ETF (US:VYM) , Vanguard International Equity Index Funds - Vanguard FTSE Emerging Markets ETF (US:VWO) , and iShares Gold Trust (US:IAU) . Ariston Services Groups neue Positionen sind The PNC Financial Services Group, Inc. (US:PNC) , .
Top-Zuwächse in diesem Quartal
Wir verwenden die Veränderung der Portfolioallokation, weil dies die aussagekräftigste Kennzahl ist. Die Änderungen können auf Trades oder Änderungen der Aktienkurse zurückzuführen sein.
| Wertpapier | Aktien (MM) |
Wert (MM$) |
Portfolio % | ΔPortfolio % |
|---|---|---|---|---|
| IAU / iShares Gold Trust | 0,13 | 10,30 | 6,0435 | 0,4540 |
| GLD / SPDR Gold Shares | 0,01 | 5,56 | 3,2592 | 0,2464 |
| GOOGL / Alphabet Inc. | 0,01 | 1,70 | 0,9998 | 0,2020 |
| VYMI / Vanguard Whitehall Funds - Vanguard International High Dividend Yield ETF | 0,09 | 8,12 | 4,7601 | 0,1776 |
| VTEC / Vanguard California Tax-Free Funds - Vanguard California Tax-Exempt Bond ETF | 0,01 | 0,98 | 0,5725 | 0,1674 |
| SSP / The E.W. Scripps Company | 0,19 | 0,75 | 0,4395 | 0,1611 |
| GOOG / Alphabet Inc. | 0,00 | 1,28 | 0,7500 | 0,1519 |
| PNC / The PNC Financial Services Group, Inc. | 0,00 | 0,21 | 0,1203 | 0,1203 |
| VTEB / Vanguard Municipal Bond Funds - Vanguard Tax-Exempt Bond ETF | 0,02 | 0,77 | 0,4507 | 0,1098 |
| JNJ / Johnson & Johnson | 0,00 | 0,47 | 0,2741 | 0,0886 |
Top-Rückgänge in diesem Quartal
Wir verwenden die Veränderung der Portfolioallokation, weil dies die aussagekräftigste Kennzahl ist. Änderungen können auf Handelsgeschäfte oder Änderungen der Aktienkurse zurückzuführen sein.
| Wertpapier | Aktien (MM) |
Wert (MM$) |
Portfolio % | ΔPortfolio % |
|---|---|---|---|---|
| VNQ / Vanguard Specialized Funds - Vanguard Real Estate ETF | 0,08 | 7,01 | 4,1143 | -0,2651 |
| TSLA / Tesla, Inc. | 0,06 | 26,14 | 15,3331 | -0,2208 |
| VWO / Vanguard International Equity Index Funds - Vanguard FTSE Emerging Markets ETF | 0,20 | 10,56 | 6,1944 | -0,2197 |
| SRE / Sempra | 0,00 | 0,28 | 0,1631 | -0,2150 |
| NFLX / Netflix, Inc. | 0,01 | 0,74 | 0,4339 | -0,1362 |
| VGRSX / Vanguard REIT Index Fund | 0,12 | 25,76 | 15,1103 | -0,1329 |
| BX / Blackstone Inc. | 0,01 | 1,33 | 0,7781 | -0,1080 |
| VPU / Vanguard World Fund - Vanguard Utilities ETF | 0,02 | 3,35 | 1,9628 | -0,1054 |
| VYM / Vanguard Whitehall Funds - Vanguard High Dividend Yield ETF | 0,16 | 22,65 | 13,2851 | -0,0699 |
| ET / Energy Transfer LP - Limited Partnership | 0,10 | 1,66 | 0,9738 | -0,0674 |
13F und Fondseinreichungen
Dieses Formular wurde am 2026-01-22 für den Berichtszeitraum eingereicht 2025-12-31. Klicken Sie auf das Link-Symbol , um den gesamten Transaktionsverlauf zu sehen.
Upgrade um die Prämiendaten zu entsperren und nach Excel zu exportieren ![]() .
.
| Wertpapier | Typ | Durchschnittlicher Aktienkurs | Aktien (MM) |
ΔAktien (%) |
Wert ($MM) |
ΔAktien (%) |
Portfolio (%) |
ΔPortfolio (%) |
|
|---|---|---|---|---|---|---|---|---|---|
| TSLA / Tesla, Inc. | 0,06 | 0,16 | 26,14 | 1,29 | 15,3331 | -0,2208 | |||
| VGRSX / Vanguard REIT Index Fund | 0,12 | 0,00 | 25,76 | 1,85 | 15,1103 | -0,1329 | |||
| VYM / Vanguard Whitehall Funds - Vanguard High Dividend Yield ETF | 0,16 | 0,38 | 22,65 | 2,21 | 13,2851 | -0,0699 | |||
| VWO / Vanguard International Equity Index Funds - Vanguard FTSE Emerging Markets ETF | 0,20 | 0,00 | 10,56 | -0,78 | 6,1944 | -0,2197 | |||
| IAU / iShares Gold Trust | 0,13 | -0,41 | 10,30 | 11,08 | 6,0435 | 0,4540 | |||
| VYMI / Vanguard Whitehall Funds - Vanguard International High Dividend Yield ETF | 0,09 | 0,42 | 8,12 | 6,72 | 4,7601 | 0,1776 | |||
| VIGI / Vanguard Whitehall Funds - Vanguard International Dividend Appreciation ETF | 0,09 | 0,00 | 7,81 | 2,09 | 4,5820 | -0,0290 | |||
| VNQ / Vanguard Specialized Funds - Vanguard Real Estate ETF | 0,08 | -0,28 | 7,01 | -3,48 | 4,1143 | -0,2651 | |||
| VOO / Vanguard Index Funds - Vanguard S&P 500 ETF | 0,01 | -0,69 | 6,03 | 1,69 | 3,5379 | -0,0363 | |||
| GLD / SPDR Gold Shares | 0,01 | -0,31 | 5,56 | 11,14 | 3,2592 | 0,2464 | |||
| VB / Vanguard Index Funds - Vanguard Small-Cap ETF | 0,02 | 0,55 | 5,55 | 1,98 | 3,2564 | -0,0239 | |||
| IWO / iShares Trust - iShares Russell 2000 Growth ETF | 0,01 | -0,18 | 3,80 | 0,74 | 2,2310 | -0,0442 | |||
| VPU / Vanguard World Fund - Vanguard Utilities ETF | 0,02 | -0,19 | 3,35 | -2,48 | 1,9628 | -0,1054 | |||
| GOOGL / Alphabet Inc. | 0,01 | 0,00 | 1,70 | 28,80 | 0,9998 | 0,2020 | |||
| ET / Energy Transfer LP - Limited Partnership | 0,10 | 0,00 | 1,66 | -3,88 | 0,9738 | -0,0674 | |||
| BX / Blackstone Inc. | 0,01 | 0,00 | 1,33 | -9,80 | 0,7781 | -0,1080 | |||
| GOOG / Alphabet Inc. | 0,00 | 0,00 | 1,28 | 28,83 | 0,7500 | 0,1519 | |||
| NVDA / NVIDIA Corporation | 0,01 | 0,00 | 1,12 | 0,00 | 0,6572 | -0,0183 | |||
| VTEC / Vanguard California Tax-Free Funds - Vanguard California Tax-Exempt Bond ETF | 0,01 | 44,50 | 0,98 | 45,24 | 0,5725 | 0,1674 | |||
| VTV / Vanguard Index Funds - Vanguard Value ETF | 0,01 | 13,27 | 0,96 | 16,02 | 0,5611 | 0,0642 | |||
| JPM / JPMorgan Chase & Co. | 0,00 | 0,00 | 0,82 | 2,25 | 0,4793 | -0,0028 | |||
| XOM / Exxon Mobil Corporation | 0,01 | 0,00 | 0,78 | 6,74 | 0,4553 | 0,0170 | |||
| VTEB / Vanguard Municipal Bond Funds - Vanguard Tax-Exempt Bond ETF | 0,02 | 35,25 | 0,77 | 35,93 | 0,4507 | 0,1098 | |||
| SSP / The E.W. Scripps Company | 0,19 | 0,00 | 0,75 | 62,47 | 0,4395 | 0,1611 | |||
| NFLX / Netflix, Inc. | 0,01 | 900,00 | 0,74 | -21,80 | 0,4339 | -0,1362 | |||
| QCOM / QUALCOMM Incorporated | 0,00 | 0,00 | 0,68 | 2,87 | 0,3992 | 0,0003 | |||
| VTI / Vanguard Index Funds - Vanguard Total Stock Market ETF | 0,00 | 11,54 | 0,67 | 13,95 | 0,3935 | 0,0387 | |||
| BA / The Boeing Company | 0,00 | 0,00 | 0,61 | 0,67 | 0,3550 | -0,0076 | |||
| JNJ / Johnson & Johnson | 0,00 | 36,02 | 0,47 | 52,12 | 0,2741 | 0,0886 | |||
| PH / Parker-Hannifin Corporation | 0,00 | 0,00 | 0,44 | 15,71 | 0,2598 | 0,0296 | |||
| TMO / Thermo Fisher Scientific Inc. | 0,00 | 0,00 | 0,42 | 19,60 | 0,2437 | 0,0341 | |||
| SCHW / The Charles Schwab Corporation | 0,00 | 0,00 | 0,40 | 4,77 | 0,2319 | 0,0042 | |||
| BAC / Bank of America Corporation | 0,01 | 0,00 | 0,39 | 6,78 | 0,2312 | 0,0084 | |||
| APD / Air Products and Chemicals, Inc. | 0,00 | 0,00 | 0,39 | -9,32 | 0,2283 | -0,0307 | |||
| AVGO / Broadcom Inc. | 0,00 | 0,00 | 0,37 | 5,06 | 0,2194 | 0,0045 | |||
| WMB / The Williams Companies, Inc. | 0,01 | 0,00 | 0,37 | -5,19 | 0,2143 | -0,0177 | |||
| CVS / CVS Health Corporation | 0,00 | 0,00 | 0,36 | 5,26 | 0,2116 | 0,0051 | |||
| BRK.B / Berkshire Hathaway Inc. | 0,00 | 0,00 | 0,35 | 0,00 | 0,2078 | -0,0057 | |||
| WEC / WEC Energy Group, Inc. | 0,00 | 39,57 | 0,35 | 28,36 | 0,2073 | 0,0415 | |||
| TRV / The Travelers Companies, Inc. | 0,00 | 0,00 | 0,35 | 3,85 | 0,2062 | 0,0023 | |||
| MCK / McKesson Corporation | 0,00 | 0,00 | 0,35 | 6,15 | 0,2026 | 0,0066 | |||
| ORLY / O'Reilly Automotive, Inc. | 0,00 | 0,00 | 0,33 | -15,44 | 0,1962 | -0,0421 | |||
| DE / Deere & Company | 0,00 | 0,00 | 0,32 | 1,89 | 0,1898 | -0,0017 | |||
| MLM / Martin Marietta Materials, Inc. | 0,00 | 0,00 | 0,32 | -1,23 | 0,1885 | -0,0075 | |||
| MCHP / Microchip Technology Incorporated | 0,00 | 0,00 | 0,32 | -0,94 | 0,1853 | -0,0066 | |||
| UNH / UnitedHealth Group Incorporated | 0,00 | 0,00 | 0,31 | -4,56 | 0,1845 | -0,0138 | |||
| AXP / American Express Company | 0,00 | 0,00 | 0,31 | 11,35 | 0,1842 | 0,0143 | |||
| TSM / Taiwan Semiconductor Manufacturing Company Limited - Depositary Receipt (Common Stock) | 0,00 | 0,00 | 0,31 | 8,80 | 0,1818 | 0,0101 | |||
| AMZN / Amazon.com, Inc. | 0,00 | 0,00 | 0,31 | 5,15 | 0,1798 | 0,0041 | |||
| BDX / Becton, Dickinson and Company | 0,00 | 0,00 | 0,31 | 3,74 | 0,1791 | 0,0016 | |||
| RTX / RTX Corporation | 0,00 | 0,00 | 0,30 | 9,35 | 0,1789 | 0,0112 | |||
| XPO / XPO, Inc. | 0,00 | 0,00 | 0,30 | 4,93 | 0,1753 | 0,0040 | |||
| COP / ConocoPhillips | 0,00 | 0,00 | 0,30 | -1,00 | 0,1738 | -0,0066 | |||
| GDX / VanEck ETF Trust - VanEck Gold Miners ETF | 0,00 | 0,00 | 0,29 | 12,45 | 0,1695 | 0,0144 | |||
| SRE / Sempra | 0,00 | -54,84 | 0,28 | -55,66 | 0,1631 | -0,2150 | |||
| AMD / Advanced Micro Devices, Inc. | 0,00 | 0,00 | 0,28 | 32,54 | 0,1627 | 0,0364 | |||
| CVX / Chevron Corporation | 0,00 | 0,00 | 0,28 | -1,78 | 0,1621 | -0,0076 | |||
| INTC / Intel Corporation | 0,01 | 0,00 | 0,27 | 10,04 | 0,1610 | 0,0106 | |||
| SHW / The Sherwin-Williams Company | 0,00 | 0,00 | 0,26 | -6,50 | 0,1520 | -0,0149 | |||
| V / Visa Inc. | 0,00 | 0,00 | 0,26 | 2,79 | 0,1514 | -0,0000 | |||
| COF / Capital One Financial Corporation | 0,00 | 0,00 | 0,26 | 13,72 | 0,1513 | 0,0149 | |||
| PFE / Pfizer Inc. | 0,01 | 0,00 | 0,25 | -2,35 | 0,1466 | -0,0075 | |||
| MSFT / Microsoft Corporation | 0,00 | 0,00 | 0,25 | -6,77 | 0,1458 | -0,0146 | |||
| HYMB / SPDR Series Trust - State Street SPDR Nuveen ICE High Yield Municipal Bond ETF | 0,01 | -2,78 | 0,24 | -2,80 | 0,1430 | -0,0081 | |||
| MSI / Motorola Solutions, Inc. | 0,00 | 0,00 | 0,24 | -16,03 | 0,1414 | -0,0319 | |||
| F / Ford Motor Company | 0,02 | 0,00 | 0,24 | 9,77 | 0,1389 | 0,0088 | |||
| HD / The Home Depot, Inc. | 0,00 | 0,00 | 0,23 | -15,02 | 0,1364 | -0,0286 | |||
| MMC / Marsh & McLennan Companies, Inc. | 0,00 | 0,00 | 0,22 | -8,09 | 0,1271 | -0,0148 | |||
| HLN / Haleon plc - Depositary Receipt (Common Stock) | 0,02 | 0,00 | 0,21 | 12,97 | 0,1229 | 0,0109 | |||
| PNC / The PNC Financial Services Group, Inc. | 0,00 | 0,21 | 0,1203 | 0,1203 | |||||
| META / Meta Platforms, Inc. | 0,00 | -100,00 | 0,00 | 0,0000 | |||||
| NOC / Northrop Grumman Corporation | 0,00 | -100,00 | 0,00 | 0,0000 |