Basisstatistiken
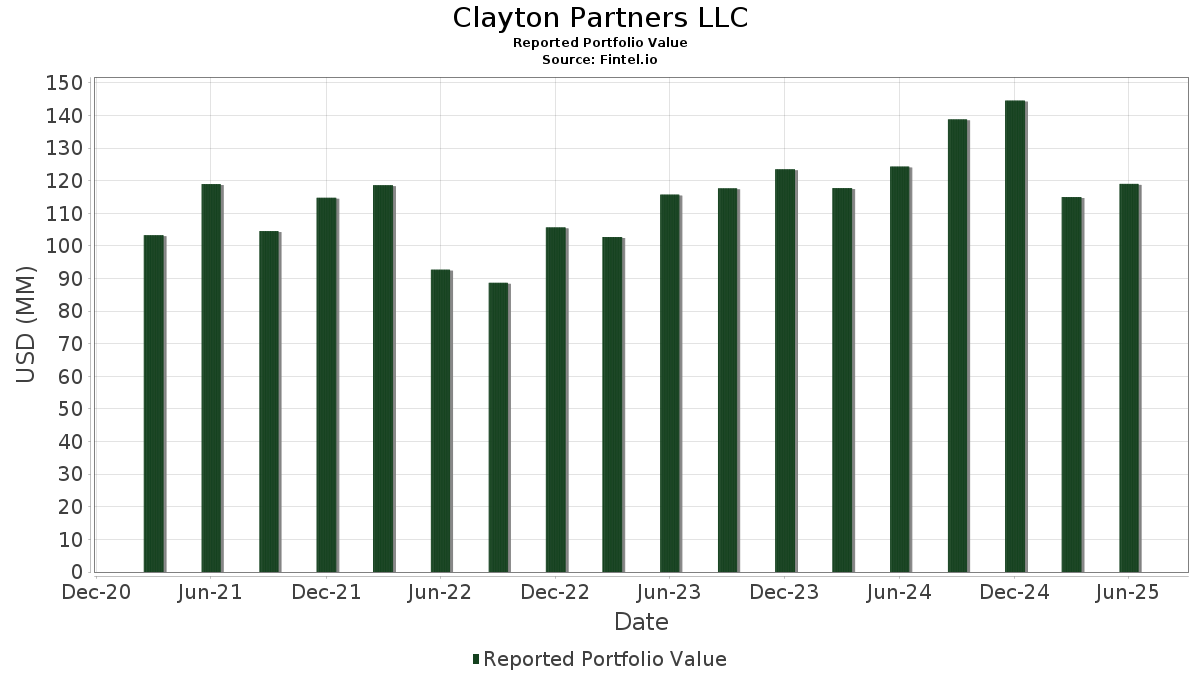
| Portfolio-Wert | $ 131.862.832 |
| Aktuelle Positionen | 36 |
Neueste Bestände, Performance, AUM (aus 13F, 13D)
Clayton Partners LLC hat 36 Gesamtbeteiligungen in seinen letzten SEC-Einreichungen offengelegt. Der jüngste Portfoliowert wird auf $ 131.862.832 USD berechnet. Das tatsächliche verwaltete Vermögen (AUM) ist dieser Wert plus Barmittel (die nicht offengelegt werden). Clayton Partners LLCs Top-Bestände sind Bristow Group Inc. (US:VTOL) , TransAlta Corporation (US:TAC) , Sonida Senior Living, Inc. (US:SNDA) , California Resources Corporation (US:CRC) , and Berkshire Hathaway Inc. (US:BRK.A) . Clayton Partners LLCs neue Positionen sind Gibraltar Industries, Inc. (US:ROCK) , Two Harbors Investment Corp. (US:TWO) , Sable Offshore Corp. (US:SOC) , . Clayton Partners LLCs wichtigste Branchen sind "Apparel And Other Finished Products Made From Fabrics And Similar Materials" (sic 23) , "Electronic And Other Electrical Equipment And Components, Except Computer Equipment" (sic 36) , and "Measuring, Analyzing, And Controlling Instruments; Photographic, Medical And Optical Goods; Watches And Clocks" (sic 38) .
Top-Zuwächse in diesem Quartal
Wir verwenden die Veränderung der Portfolioallokation, weil dies die aussagekräftigste Kennzahl ist. Die Änderungen können auf Trades oder Änderungen der Aktienkurse zurückzuführen sein.
| Wertpapier | Aktien (MM) |
Wert (MM$) |
Portfolio % | ΔPortfolio % |
|---|---|---|---|---|
| ROCK / Gibraltar Industries, Inc. | 0,07 | 4,18 | 3,1713 | 3,1713 |
| CRC / California Resources Corporation | 0,14 | 7,24 | 5,4889 | 1,6271 |
| FSLR / First Solar, Inc. | 0,01 | 3,08 | 2,3364 | 1,5292 |
| REFI / Chicago Atlantic Real Estate Finance, Inc. | 0,14 | 1,76 | 1,3382 | 1,3382 |
| TAC / TransAlta Corporation | 0,69 | 9,48 | 7,1903 | 1,1924 |
| SNDA / Sonida Senior Living, Inc. | 0,31 | 8,67 | 6,5735 | 1,1041 |
| TWO / Two Harbors Investment Corp. | 0,12 | 1,23 | 0,9356 | 0,9356 |
| GOOGL / Alphabet Inc. | 0,02 | 4,90 | 3,7191 | 0,7116 |
| MYE / Myers Industries, Inc. | 0,12 | 1,95 | 1,4774 | 0,5034 |
| NXT / Nextpower Inc. | 0,04 | 3,00 | 2,2728 | 0,4204 |
Top-Rückgänge in diesem Quartal
Wir verwenden die Veränderung der Portfolioallokation, weil dies die aussagekräftigste Kennzahl ist. Änderungen können auf Handelsgeschäfte oder Änderungen der Aktienkurse zurückzuführen sein.
| Wertpapier | Aktien (MM) |
Wert (MM$) |
Portfolio % | ΔPortfolio % |
|---|---|---|---|---|
| B / Barrick Mining Corporation | 0,14 | 4,50 | 3,4110 | -1,2292 |
| VTOL / Bristow Group Inc. | 0,34 | 12,14 | 9,2059 | -1,0336 |
| TWLO / Twilio Inc. | 0,03 | 3,28 | 2,4909 | -0,9463 |
| FLR / Fluor Corporation | 0,08 | 3,39 | 2,5707 | -0,9193 |
| EPSN / Epsilon Energy Ltd. | 0,36 | 1,79 | 1,3579 | -0,8451 |
| XPRO / Expro Group Holdings N.V. | 0,02 | 1,99 | 1,5119 | -0,7303 |
| DX / Dynex Capital, Inc. | 0,04 | 0,55 | 0,4194 | -0,6587 |
| PTON / Peloton Interactive, Inc. | 0,09 | 0,81 | 0,6143 | -0,3770 |
| TSLX / Sixth Street Specialty Lending, Inc. | 0,14 | 3,13 | 2,3772 | -0,3664 |
| ACTG / Acacia Research Corporation | 0,18 | 0,58 | 0,4434 | -0,3628 |
13D/G Einreichungen
Dies ist eine Liste der 13D- und 13G-Einreichungen des letzten Jahres (falls vorhanden). Klicken Sie auf das Link-Symbol, um die vollständige Transaktionshistorie anzuzeigen. Grüne Zeilen zeigen neue Positionen an. Rote Zeilen zeigen geschlossene Positionen an.
| Datei Datum | Formular | Wertpapier | Vorherige Aktien |
Aktuelle Aktien |
ΔAktien % | % Eigentümerschaft |
% ΔEigentümerschaft | |
|---|---|---|---|---|---|---|---|---|
| 2025-02-13 | NTIP / Network-1 Technologies, Inc. | 1.435.200 | 1.213.155 | -15,47 | 5,30 | -12,69 |
13F und Fondseinreichungen
Dieses Formular wurde am 2025-11-10 für den Berichtszeitraum eingereicht 2025-09-30. Klicken Sie auf das Link-Symbol , um den gesamten Transaktionsverlauf zu sehen.
Upgrade um die Prämiendaten zu entsperren und nach Excel zu exportieren ![]() .
.
| Wertpapier | Typ | Durchschnittlicher Aktienkurs | Aktien (MM) |
ΔAktien (%) |
Wert ($MM) |
ΔAktien (%) |
Portfolio (%) |
ΔPortfolio (%) |
|
|---|---|---|---|---|---|---|---|---|---|
| VTOL / Bristow Group Inc. | 0,34 | -8,98 | 12,14 | -0,39 | 9,2059 | -1,0336 | |||
| TAC / TransAlta Corporation | 0,69 | 4,84 | 9,48 | 32,82 | 7,1903 | 1,1924 | |||
| SNDA / Sonida Senior Living, Inc. | 0,31 | 19,85 | 8,67 | 33,17 | 6,5735 | 1,1041 | |||
| CRC / California Resources Corporation | 0,14 | 35,24 | 7,24 | 57,46 | 5,4889 | 1,6271 | |||
| BRK.A / Berkshire Hathaway Inc. | 0,01 | -0,16 | 6,12 | 3,33 | 4,6399 | -0,3355 | |||
| WFC / Wells Fargo & Company | 0,06 | -0,11 | 5,03 | 4,51 | 3,8108 | -0,2295 | |||
| SGOV / iShares Trust - iShares 0-3 Month Treasury Bond ETF | 0,05 | 1,21 | 4,91 | 1,19 | 3,7258 | -0,3527 | |||
| GOOGL / Alphabet Inc. | 0,02 | -0,21 | 4,90 | 37,02 | 3,7191 | 0,7116 | |||
| B / Barrick Mining Corporation | 0,14 | -48,26 | 4,50 | -18,56 | 3,4110 | -1,2292 | |||
| ABBV / AbbVie Inc. | 0,02 | -0,19 | 4,25 | 24,49 | 3,2200 | 0,3547 | |||
| ROCK / Gibraltar Industries, Inc. | 0,07 | 4,18 | 3,1713 | 3,1713 | |||||
| TKO / TKO Group Holdings, Inc. | 0,02 | -0,02 | 4,08 | 10,97 | 3,0934 | 0,0049 | |||
| NHI / National Health Investors, Inc. | 0,05 | 11,34 | 3,85 | 26,25 | 2,9221 | 0,3575 | |||
| LHX / L3Harris Technologies, Inc. | 0,01 | -0,23 | 3,79 | 21,47 | 2,8757 | 0,2528 | |||
| FLEX / Flex Ltd. | 0,06 | -1,76 | 3,76 | 14,09 | 2,8488 | 0,0821 | |||
| J / Jacobs Solutions Inc. | 0,02 | -0,10 | 3,62 | 13,93 | 2,7423 | 0,0747 | |||
| AZN / AstraZeneca PLC - Depositary Receipt (Common Stock) | 0,05 | -0,21 | 3,58 | 9,58 | 2,7142 | -0,0306 | |||
| FLR / Fluor Corporation | 0,08 | -0,54 | 3,39 | -18,40 | 2,5707 | -0,9193 | |||
| TWLO / Twilio Inc. | 0,03 | -0,24 | 3,28 | -19,71 | 2,4909 | -0,9463 | |||
| TSLX / Sixth Street Specialty Lending, Inc. | 0,14 | -0,01 | 3,13 | -4,01 | 2,3772 | -0,3664 | |||
| FSLR / First Solar, Inc. | 0,01 | 140,74 | 3,08 | 220,83 | 2,3364 | 1,5292 | |||
| NXT / Nextpower Inc. | 0,04 | -0,11 | 3,00 | 35,93 | 2,2728 | 0,4204 | |||
| IVLU / iShares Trust - iShares MSCI Intl Value Factor ETF | 0,08 | 0,15 | 2,90 | 8,06 | 2,1956 | -0,0560 | |||
| FDX / FedEx Corporation | 0,01 | 16,94 | 2,87 | 21,30 | 2,1773 | 0,1888 | |||
| VXUS / Vanguard STAR Funds - Vanguard Total International Stock ETF | 0,04 | 0,15 | 2,76 | 6,47 | 2,0957 | -0,0848 | |||
| XPRO / Expro Group Holdings N.V. | 0,02 | -0,10 | 1,99 | -25,30 | 1,5119 | -0,7303 | |||
| MYE / Myers Industries, Inc. | 0,12 | 43,75 | 1,95 | 68,08 | 1,4774 | 0,5034 | |||
| EPSN / Epsilon Energy Ltd. | 0,36 | 0,00 | 1,79 | -31,71 | 1,3579 | -0,8451 | |||
| REFI / Chicago Atlantic Real Estate Finance, Inc. | 0,14 | 1,76 | 1,3382 | 1,3382 | |||||
| NTIP / Network-1 Technologies, Inc. | 1,04 | -18,38 | 1,57 | 0,32 | 1,1875 | -0,1236 | |||
| TWO / Two Harbors Investment Corp. | 0,12 | 1,23 | 0,9356 | 0,9356 | |||||
| LUMN / Lumen Technologies, Inc. | 0,14 | -22,86 | 0,83 | 7,83 | 0,6266 | -0,0175 | |||
| PTON / Peloton Interactive, Inc. | 0,09 | -47,06 | 0,81 | -31,30 | 0,6143 | -0,3770 | |||
| ACTG / Acacia Research Corporation | 0,18 | -32,88 | 0,58 | -39,10 | 0,4434 | -0,3628 | |||
| DX / Dynex Capital, Inc. | 0,04 | -57,14 | 0,55 | -56,90 | 0,4194 | -0,6587 | |||
| SOC / Sable Offshore Corp. | 0,02 | 0,29 | 0,2185 | 0,2185 | |||||
| CLBT / Cellebrite DI Ltd. | 0,00 | -100,00 | 0,00 | 0,0000 | |||||
| MOVE / Movano Inc. | 0,00 | -100,00 | 0,00 | -100,00 | -0,2285 | ||||
| CROX / Crocs, Inc. | 0,00 | -100,00 | 0,00 | 0,0000 | |||||
| LKQ / LKQ Corporation | 0,00 | -100,00 | 0,00 | 0,0000 | |||||
| ASTL / Algoma Steel Group Inc. | 0,00 | -100,00 | 0,00 | -100,00 | -0,0620 |