Basisstatistiken
| Insider-Profil | CONGRESS ASSET MANAGEMENT CO /MA |
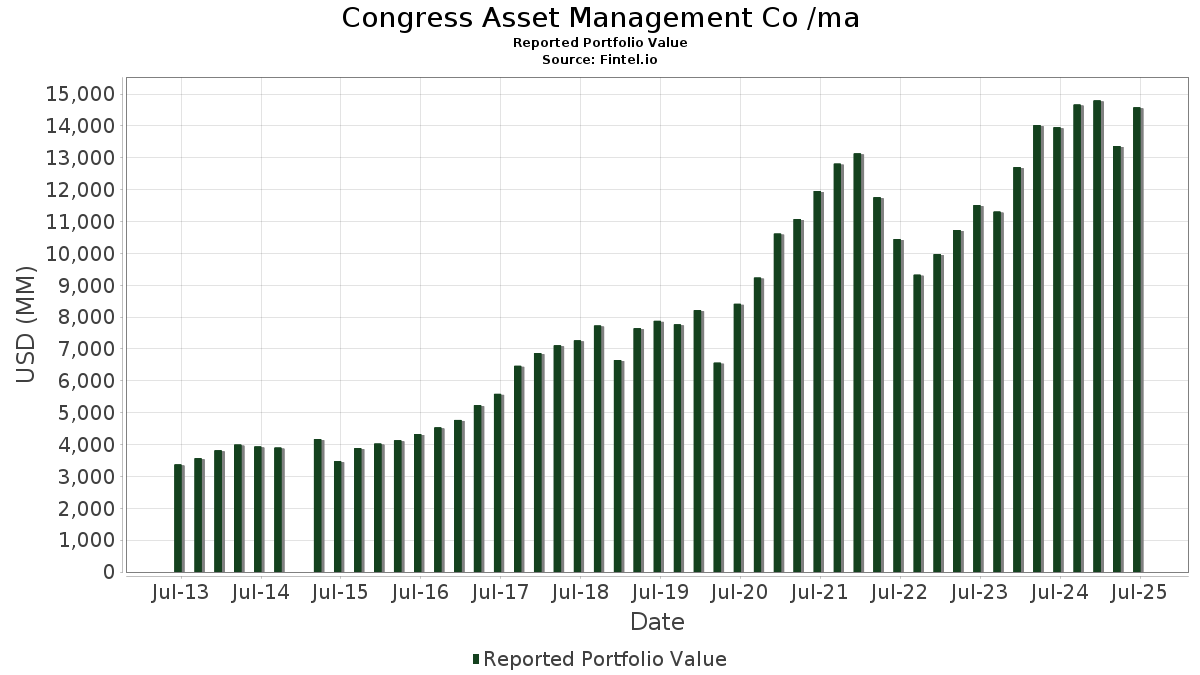
| Portfolio-Wert | $ 14.207.840.561 |
| Aktuelle Positionen | 381 |
Neueste Bestände, Performance, AUM (aus 13F, 13D)
Congress Asset Management Co /ma hat 381 Gesamtbeteiligungen in seinen letzten SEC-Einreichungen offengelegt. Der jüngste Portfoliowert wird auf $ 14.207.840.561 USD berechnet. Das tatsächliche verwaltete Vermögen (AUM) ist dieser Wert plus Barmittel (die nicht offengelegt werden). Congress Asset Management Co /mas Top-Bestände sind NVIDIA Corporation (US:NVDA) , Apple Inc. (US:AAPL) , Alphabet Inc. (US:GOOGL) , Microsoft Corporation (US:MSFT) , and Broadcom Inc. (US:AVGO) . Congress Asset Management Co /mas neue Positionen sind GE Vernova Inc. (US:GEV) , Kirby Corporation (US:KEX) , TG Therapeutics, Inc. (US:TGTX) , APi Group Corporation (US:APG) , and Advanced Energy Industries, Inc. (US:AEIS) .
Top-Zuwächse in diesem Quartal
Wir verwenden die Veränderung der Portfolioallokation, weil dies die aussagekräftigste Kennzahl ist. Die Änderungen können auf Trades oder Änderungen der Aktienkurse zurückzuführen sein.
| Wertpapier | Aktien (MM) |
Wert (MM$) |
Portfolio % | ΔPortfolio % |
|---|---|---|---|---|
| GEV / GE Vernova Inc. | 0,19 | 125,26 | 0,8817 | 0,8817 |
| AAPL / Apple Inc. | 1,64 | 446,82 | 3,1449 | 0,7481 |
| IDXX / IDEXX Laboratories, Inc. | 0,15 | 104,12 | 0,7329 | 0,7263 |
| RGEN / Repligen Corporation | 0,75 | 122,29 | 0,8607 | 0,6663 |
| GOOGL / Alphabet Inc. | 1,07 | 333,82 | 2,3495 | 0,5958 |
| EAT / Brinker International, Inc. | 0,56 | 80,52 | 0,5667 | 0,5667 |
| KEX / Kirby Corporation | 0,53 | 58,38 | 0,4109 | 0,4109 |
| TGTX / TG Therapeutics, Inc. | 1,92 | 57,31 | 0,4033 | 0,4033 |
| ALNY / Alnylam Pharmaceuticals, Inc. | 0,27 | 107,06 | 0,7535 | 0,3931 |
| TMO / Thermo Fisher Scientific Inc. | 0,21 | 121,09 | 0,8523 | 0,3685 |
Top-Rückgänge in diesem Quartal
Wir verwenden die Veränderung der Portfolioallokation, weil dies die aussagekräftigste Kennzahl ist. Änderungen können auf Handelsgeschäfte oder Änderungen der Aktienkurse zurückzuführen sein.
| Wertpapier | Aktien (MM) |
Wert (MM$) |
Portfolio % | ΔPortfolio % |
|---|---|---|---|---|
| HD / The Home Depot, Inc. | 0,09 | 31,44 | 0,2213 | -0,8336 |
| AJG / Arthur J. Gallagher & Co. | 0,01 | 1,65 | 0,0116 | -0,8112 |
| CTAS / Cintas Corporation | 0,20 | 38,15 | 0,2685 | -0,7888 |
| MSI / Motorola Solutions, Inc. | 0,02 | 7,31 | 0,0515 | -0,7085 |
| OLLI / Ollie's Bargain Outlet Holdings, Inc. | 0,88 | 96,38 | 0,6784 | -0,6459 |
| LRN / Stride, Inc. | 0,00 | 0,00 | -0,4614 | |
| CYBR / CyberArk Software Ltd. | 0,13 | 59,71 | 0,4202 | -0,4559 |
| DSGX / The Descartes Systems Group Inc. | 0,00 | 0,00 | -0,4441 | |
| VRTX / Vertex Pharmaceuticals Incorporated | 0,00 | 0,42 | 0,0030 | -0,4163 |
| BAH / Booz Allen Hamilton Holding Corporation | 0,01 | 0,79 | 0,0055 | -0,3619 |
13F und Fondseinreichungen
Dieses Formular wurde am 2026-01-09 für den Berichtszeitraum eingereicht 2025-12-31. Klicken Sie auf das Link-Symbol , um den gesamten Transaktionsverlauf zu sehen.
Upgrade um die Prämiendaten zu entsperren und nach Excel zu exportieren ![]() .
.
| Wertpapier | Typ | Durchschnittlicher Aktienkurs | Aktien (MM) |
ΔAktien (%) |
Wert ($MM) |
ΔAktien (%) |
Portfolio (%) |
ΔPortfolio (%) |
|
|---|---|---|---|---|---|---|---|---|---|
| NVDA / NVIDIA Corporation | 2,54 | -3,75 | 473,16 | -3,79 | 3,3303 | 0,0575 | |||
| AAPL / Apple Inc. | 1,64 | 16,19 | 446,82 | 24,06 | 3,1449 | 0,7481 | |||
| GOOGL / Alphabet Inc. | 1,07 | -1,62 | 333,82 | 26,67 | 2,3495 | 0,5958 | |||
| MSFT / Microsoft Corporation | 0,64 | -2,28 | 311,02 | -8,76 | 2,1891 | -0,0792 | |||
| AVGO / Broadcom Inc. | 0,73 | -0,87 | 253,12 | 4,00 | 1,7816 | 0,1619 | |||
| ANET / Arista Networks, Inc. | 1,76 | -2,19 | 230,39 | -12,05 | 1,6216 | -0,1215 | |||
| GS / The Goldman Sachs Group, Inc. | 0,26 | -1,68 | 225,30 | 8,52 | 1,5857 | 0,2042 | |||
| AMZN / Amazon.com, Inc. | 0,91 | -1,83 | 209,42 | 3,20 | 1,4740 | 0,1236 | |||
| META / Meta Platforms, Inc. | 0,31 | -10,05 | 201,67 | -19,15 | 1,4195 | -0,2405 | |||
| V / Visa Inc. | 0,57 | -1,76 | 199,10 | 0,92 | 1,4013 | 0,0885 | |||
| TJX / The TJX Companies, Inc. | 1,22 | -1,74 | 187,86 | 4,43 | 1,3223 | 0,1251 | |||
| COST / Costco Wholesale Corporation | 0,22 | -2,34 | 187,54 | -9,02 | 1,3200 | -0,0517 | |||
| ISRG / Intuitive Surgical, Inc. | 0,31 | -1,55 | 178,14 | 24,67 | 1,2538 | 0,3030 | |||
| HWM / Howmet Aerospace Inc. | 0,81 | -2,37 | 165,25 | 2,00 | 1,1631 | 0,0850 | |||
| PH / Parker-Hannifin Corporation | 0,19 | -1,82 | 163,80 | 13,82 | 1,1529 | 0,1952 | |||
| ETN / Eaton Corporation plc | 0,51 | -2,22 | 161,84 | -16,78 | 1,1391 | -0,1551 | |||
| BSX / Boston Scientific Corporation | 1,65 | -2,03 | 157,32 | -4,31 | 1,1073 | 0,0132 | |||
| MLM / Martin Marietta Materials, Inc. | 0,24 | -1,99 | 149,21 | -3,18 | 1,0502 | 0,0247 | |||
| CW / Curtiss-Wright Corporation | 0,27 | -10,41 | 148,78 | -9,04 | 1,0472 | -0,0413 | |||
| STRL / Sterling Infrastructure, Inc. | 0,47 | -7,88 | 143,68 | -16,95 | 1,0113 | -0,1400 | |||
| ORLY / O'Reilly Automotive, Inc. | 1,54 | -1,93 | 140,20 | -17,03 | 0,9868 | -0,1376 | |||
| WELL / Welltower Inc. | 0,75 | 27,98 | 139,83 | 33,35 | 0,9841 | 0,2864 | |||
| DELL / Dell Technologies Inc. | 1,09 | -1,31 | 136,99 | -12,37 | 0,9642 | -0,0761 | |||
| APH / Amphenol Corporation | 0,96 | -0,58 | 130,08 | 8,57 | 0,9156 | 0,1183 | |||
| NOW / ServiceNow, Inc. | 0,85 | 385,44 | 129,82 | -19,19 | 0,9138 | -0,1554 | |||
| RMBS / Rambus Inc. | 1,41 | 4,71 | 129,62 | -7,66 | 0,9123 | -0,0218 | |||
| NFLX / Netflix, Inc. | 1,38 | 886,19 | 129,50 | -22,88 | 0,9115 | -0,2059 | |||
| SHOP / Shopify Inc. | 0,80 | -1,94 | 129,15 | 6,22 | 0,9090 | 0,0999 | |||
| ECL / Ecolab Inc. | 0,48 | -1,73 | 126,60 | -5,80 | 0,8910 | -0,0032 | |||
| GEV / GE Vernova Inc. | 0,19 | 125,26 | 0,8817 | 0,8817 | |||||
| SNPS / Synopsys, Inc. | 0,26 | -3,07 | 122,94 | -7,72 | 0,8653 | -0,0212 | |||
| RGEN / Repligen Corporation | 0,75 | 241,42 | 122,29 | 318,53 | 0,8607 | 0,6663 | |||
| TMO / Thermo Fisher Scientific Inc. | 0,21 | 39,43 | 121,09 | 66,57 | 0,8523 | 0,3685 | |||
| PEN / Penumbra, Inc. | 0,38 | -10,91 | 118,88 | 9,34 | 0,8367 | 0,1132 | |||
| NVT / nVent Electric plc | 1,16 | -6,80 | 117,98 | -3,65 | 0,8304 | 0,0155 | |||
| UBER / Uber Technologies, Inc. | 1,44 | 0,12 | 117,36 | -16,50 | 0,8260 | -0,1092 | |||
| TKO / TKO Group Holdings, Inc. | 0,55 | 0,34 | 114,31 | 3,84 | 0,8045 | 0,0720 | |||
| DT / Dynatrace, Inc. | 2,62 | -21,47 | 113,38 | -29,75 | 0,7980 | -0,2761 | |||
| IDCC / InterDigital, Inc. | 0,35 | -0,52 | 111,81 | -8,25 | 0,7870 | -0,0240 | |||
| MCO / Moody's Corporation | 0,22 | -1,91 | 111,23 | 5,16 | 0,7829 | 0,0790 | |||
| WMB / The Williams Companies, Inc. | 1,84 | -1,81 | 110,90 | -6,83 | 0,7806 | -0,0115 | |||
| BOOT / Boot Barn Holdings, Inc. | 0,62 | 11,13 | 109,84 | 18,34 | 0,7731 | 0,1555 | |||
| ALNY / Alnylam Pharmaceuticals, Inc. | 0,27 | 126,63 | 107,06 | 97,63 | 0,7535 | 0,3931 | |||
| IDXX / IDEXX Laboratories, Inc. | 0,15 | 9.894,03 | 104,12 | 10.492,37 | 0,7329 | 0,7263 | |||
| PRIM / Primoris Services Corporation | 0,82 | 2,39 | 101,21 | -7,44 | 0,7123 | -0,0153 | |||
| PANW / Palo Alto Networks, Inc. | 0,55 | -1,98 | 100,59 | -11,33 | 0,7080 | -0,0469 | |||
| UFPT / UFP Technologies, Inc. | 0,44 | 32,38 | 97,94 | 47,26 | 0,6894 | 0,2468 | |||
| PJT / PJT Partners Inc. | 0,58 | 9,89 | 97,63 | 3,38 | 0,6872 | 0,0587 | |||
| EME / EMCOR Group, Inc. | 0,16 | -21,54 | 96,82 | -26,10 | 0,6815 | -0,1903 | |||
| OLLI / Ollie's Bargain Outlet Holdings, Inc. | 0,88 | -43,27 | 96,38 | -51,57 | 0,6784 | -0,6459 | |||
| NVMI / Nova Ltd. | 0,29 | 1,82 | 95,65 | 4,60 | 0,6732 | 0,0647 | |||
| LGND / Ligand Pharmaceuticals Incorporated | 0,48 | -28,06 | 90,77 | -23,22 | 0,6388 | -0,1478 | |||
| MOGA / Moog, Inc. - Class A | 0,37 | 4,32 | 89,24 | 22,35 | 0,6281 | 0,1427 | |||
| HALO / Halozyme Therapeutics, Inc. | 1,30 | -9,35 | 87,64 | -16,82 | 0,6168 | -0,0843 | |||
| RJF / Raymond James Financial, Inc. | 0,51 | -19,52 | 82,59 | -25,12 | 0,5813 | -0,1527 | |||
| MPWR / Monolithic Power Systems, Inc. | 0,09 | -16,24 | 82,19 | -17,54 | 0,5785 | -0,0848 | |||
| CVLT / Commvault Systems, Inc. | 0,64 | 7,79 | 80,67 | -28,42 | 0,5678 | -0,1822 | |||
| NPO / Enpro Inc. | 0,38 | 7,34 | 80,57 | 1,70 | 0,5671 | 0,0399 | |||
| EAT / Brinker International, Inc. | 0,56 | 80,52 | 0,5667 | 0,5667 | |||||
| SKY / Champion Homes, Inc. | 0,95 | 2,82 | 80,24 | 13,77 | 0,5647 | 0,0954 | |||
| CR / Crane Company | 0,42 | -17,48 | 78,20 | -17,35 | 0,5504 | -0,0792 | |||
| TPR / Tapestry, Inc. | 0,61 | -11,18 | 77,98 | 0,23 | 0,5489 | 0,0312 | |||
| FIX / Comfort Systems USA, Inc. | 0,08 | -14,12 | 76,85 | -2,87 | 0,5409 | 0,0144 | |||
| CALX / Calix, Inc. | 1,45 | -1,07 | 76,62 | -14,68 | 0,5393 | -0,0583 | |||
| MOD / Modine Manufacturing Company | 0,57 | 7,84 | 75,95 | 1,28 | 0,5345 | 0,0356 | |||
| MMSI / Merit Medical Systems, Inc. | 0,86 | 27,45 | 75,59 | 34,97 | 0,5320 | 0,1594 | |||
| CARG / CarGurus, Inc. | 1,96 | 2,89 | 75,09 | 5,98 | 0,5285 | 0,0570 | |||
| AVAV / AeroVironment, Inc. | 0,31 | -10,61 | 75,03 | -31,34 | 0,5281 | -0,1990 | |||
| PWR / Quanta Services, Inc. | 0,18 | -9,41 | 74,99 | -7,74 | 0,5278 | -0,0131 | |||
| JBTM / JBT Marel Corporation | 0,49 | 5,60 | 74,30 | 13,29 | 0,5230 | 0,0865 | |||
| ABCB / Ameris Bancorp | 1,00 | 2,80 | 74,03 | 4,14 | 0,5211 | 0,0480 | |||
| TILE / Interface, Inc. | 2,63 | 3,33 | 73,41 | -0,31 | 0,5167 | 0,0267 | |||
| NOVT / Novanta Inc. | 0,61 | 3,61 | 72,82 | 23,10 | 0,5125 | 0,1189 | |||
| HEI / HEICO Corporation | 0,22 | -18,05 | 72,26 | -17,86 | 0,5086 | -0,0768 | |||
| CASY / Casey's General Stores, Inc. | 0,13 | -19,89 | 71,69 | -21,68 | 0,5046 | -0,1045 | |||
| AUB / Atlantic Union Bankshares Corporation | 1,96 | 4,68 | 69,36 | 4,71 | 0,4882 | 0,0474 | |||
| SXT / Sensient Technologies Corporation | 0,73 | 2,50 | 69,01 | 2,61 | 0,4857 | 0,0382 | |||
| NET / Cloudflare, Inc. | 0,34 | -14,39 | 67,81 | -21,34 | 0,4773 | -0,0964 | |||
| ACIW / ACI Worldwide, Inc. | 1,39 | 3,96 | 66,51 | -5,81 | 0,4681 | -0,0018 | |||
| VIK / Viking Holdings Ltd | 0,92 | -12,06 | 65,71 | 1,03 | 0,4625 | 0,0297 | |||
| CSW / CSW Industrials, Inc. | 0,22 | 4,64 | 65,00 | 26,52 | 0,4575 | 0,1156 | |||
| PLTR / Palantir Technologies Inc. | 0,36 | 1,26 | 64,38 | -1,33 | 0,4531 | 0,0189 | |||
| IWP / iShares Trust - iShares Russell Mid-Cap Growth ETF | 0,46 | 118,26 | 62,80 | 109,88 | 0,4420 | 0,2429 | |||
| PSTG / Pure Storage, Inc. | 0,93 | -25,95 | 62,14 | -40,79 | 0,4374 | -0,2610 | |||
| VCEL / Vericel Corporation | 1,66 | 11,37 | 59,94 | 27,44 | 0,4219 | 0,1089 | |||
| FSS / Federal Signal Corporation | 0,55 | 7,54 | 59,89 | -1,86 | 0,4216 | 0,0154 | |||
| CYBR / CyberArk Software Ltd. | 0,13 | -50,88 | 59,71 | -54,65 | 0,4202 | -0,4559 | |||
| CRDO / Credo Technology Group Holding Ltd | 0,41 | -0,13 | 59,47 | -1,31 | 0,4186 | 0,0176 | |||
| LMAT / LeMaitre Vascular, Inc. | 0,73 | 5,79 | 59,39 | -1,96 | 0,4180 | 0,0149 | |||
| KEX / Kirby Corporation | 0,53 | 58,38 | 0,4109 | 0,4109 | |||||
| EHC / Encompass Health Corporation | 0,55 | -11,50 | 58,18 | -26,05 | 0,4095 | -0,1140 | |||
| BCPC / Balchem Corporation | 0,38 | 1,77 | 58,08 | 4,01 | 0,4088 | 0,0372 | |||
| GWRE / Guidewire Software, Inc. | 0,29 | -18,71 | 57,96 | -28,92 | 0,4079 | -0,1346 | |||
| TGTX / TG Therapeutics, Inc. | 1,92 | 57,31 | 0,4033 | 0,4033 | |||||
| CXT / Crane NXT, Co. | 1,22 | 4,26 | 57,28 | -26,83 | 0,4031 | -0,1178 | |||
| YETI / YETI Holdings, Inc. | 1,29 | 4,82 | 57,12 | 39,54 | 0,4020 | 0,1296 | |||
| TSCO / Tractor Supply Company | 1,13 | 4,39 | 56,34 | -8,20 | 0,3965 | -0,0119 | |||
| BOX / Box, Inc. | 1,86 | -4,36 | 55,49 | -11,36 | 0,3905 | -0,0260 | |||
| FICO / Fair Isaac Corporation | 0,03 | -9,13 | 54,64 | 2,65 | 0,3846 | 0,0304 | |||
| GRMN / Garmin Ltd. | 0,25 | -34,65 | 50,04 | -46,16 | 0,3522 | -0,2662 | |||
| APG / APi Group Corporation | 1,30 | 49,67 | 0,3496 | 0,3496 | |||||
| KNF / Knife River Corporation | 0,70 | -8,56 | 49,30 | -16,32 | 0,3470 | -0,0450 | |||
| AEIS / Advanced Energy Industries, Inc. | 0,23 | 47,50 | 0,3343 | 0,3343 | |||||
| FAST / Fastenal Company | 1,18 | -24,06 | 47,23 | -37,86 | 0,3324 | -0,1733 | |||
| HLI / Houlihan Lokey, Inc. | 0,27 | -28,95 | 46,45 | -39,72 | 0,3269 | -0,1858 | |||
| BRO / Brown & Brown, Inc. | 0,58 | -13,30 | 46,27 | -26,32 | 0,3257 | -0,0923 | |||
| DDOG / Datadog, Inc. | 0,33 | -17,07 | 44,86 | -20,80 | 0,3157 | -0,0612 | |||
| UTI / Universal Technical Institute, Inc. | 1,69 | -18,40 | 44,27 | -34,50 | 0,3116 | -0,1381 | |||
| AZTA / Azenta, Inc. | 1,29 | 42,75 | 0,3009 | 0,3009 | |||||
| MDB / MongoDB, Inc. | 0,10 | 42,26 | 0,2974 | 0,2974 | |||||
| ROST / Ross Stores, Inc. | 0,23 | 41,33 | 0,2909 | 0,2909 | |||||
| CTAS / Cintas Corporation | 0,20 | -73,79 | 38,15 | -75,99 | 0,2685 | -0,7888 | |||
| IWF / iShares Trust - iShares Russell 1000 Growth ETF | 0,08 | 309,43 | 36,28 | 313,69 | 0,2554 | 0,1970 | |||
| STE / STERIS plc | 0,14 | 6,38 | 35,93 | 8,99 | 0,2529 | 0,0335 | |||
| JPM / JPMorgan Chase & Co. | 0,11 | -2,18 | 34,98 | -0,07 | 0,2462 | 0,0133 | |||
| VMI / Valmont Industries, Inc. | 0,09 | 14,06 | 34,34 | 18,35 | 0,2417 | 0,0486 | |||
| MEDP / Medpace Holdings, Inc. | 0,06 | -6,67 | 33,91 | 1,95 | 0,2387 | 0,0173 | |||
| PINS / Pinterest, Inc. | 1,31 | -34,67 | 33,87 | -47,42 | 0,2384 | -0,1903 | |||
| VBK / Vanguard Index Funds - Vanguard Small-Cap Growth ETF | 0,11 | 175,06 | 33,78 | 179,21 | 0,2378 | 0,1572 | |||
| TXRH / Texas Roadhouse, Inc. | 0,20 | -32,01 | 33,66 | -32,08 | 0,2369 | -0,0928 | |||
| TRNO / Terreno Realty Corporation | 0,57 | 3,83 | 33,26 | 7,42 | 0,2341 | 0,0280 | |||
| HD / The Home Depot, Inc. | 0,09 | -76,64 | 31,44 | -80,17 | 0,2213 | -0,8336 | |||
| BJ / BJ's Wholesale Club Holdings, Inc. | 0,34 | 13,83 | 30,98 | 9,90 | 0,2181 | 0,0305 | |||
| CAT / Caterpillar Inc. | 0,05 | -2,24 | 30,29 | 17,37 | 0,2132 | 0,0415 | |||
| CAMLX / Professionally Managed Portfolios - Congress Large Cap Growth Fund Retail Class | 0,61 | 2,82 | 29,78 | -4,14 | 0,2096 | 0,0029 | |||
| PODD / Insulet Corporation | 0,10 | 11,94 | 28,57 | 3,06 | 0,2011 | 0,0166 | |||
| PTC / PTC Inc. | 0,16 | 11,62 | 28,49 | -4,22 | 0,2005 | 0,0026 | |||
| ELF / e.l.f. Beauty, Inc. | 0,37 | 4,04 | 28,21 | -40,29 | 0,1985 | -0,1158 | |||
| TOST / Toast, Inc. | 0,78 | -36,13 | 27,58 | -37,88 | 0,1941 | -0,1013 | |||
| IWO / iShares Trust - iShares Russell 2000 Growth ETF | 0,08 | 4.991,05 | 24,63 | 5.042,80 | 0,1734 | 0,1702 | |||
| KRMN / Karman Holdings Inc. | 0,33 | 24,21 | 0,1704 | 0,1704 | |||||
| CAVA / CAVA Group, Inc. | 0,41 | -38,66 | 24,09 | -40,41 | 0,1696 | -0,0995 | |||
| LECO / Lincoln Electric Holdings, Inc. | 0,10 | 16,25 | 24,04 | 18,13 | 0,1692 | 0,0338 | |||
| GOOG / Alphabet Inc. | 0,07 | 0,44 | 23,33 | 29,42 | 0,1642 | 0,0442 | |||
| DHI / D.R. Horton, Inc. | 0,16 | -45,29 | 23,29 | -53,50 | 0,1639 | -0,1694 | |||
| ADI / Analog Devices, Inc. | 0,08 | 0,07 | 22,76 | 10,46 | 0,1602 | 0,0231 | |||
| FND / Floor & Decor Holdings, Inc. | 0,37 | 22,46 | 0,1580 | 0,1580 | |||||
| HWKN / Hawkins, Inc. | 0,15 | 10,85 | 21,69 | -13,81 | 0,1526 | -0,0148 | |||
| RRC / Range Resources Corporation | 0,61 | 13,87 | 21,65 | 6,67 | 0,1524 | 0,0173 | |||
| EXLS / ExlService Holdings, Inc. | 0,50 | 12,89 | 21,01 | 8,81 | 0,1479 | 0,0194 | |||
| PBH / Prestige Consumer Healthcare Inc. | 0,34 | 14,76 | 20,91 | 13,45 | 0,1472 | 0,0245 | |||
| TEL / TE Connectivity plc | 0,09 | -0,56 | 20,88 | 3,05 | 0,1470 | 0,0121 | |||
| SYK / Stryker Corporation | 0,06 | -1,01 | 20,46 | -5,89 | 0,1440 | -0,0007 | |||
| CWAN / Clearwater Analytics Holdings, Inc. | 0,84 | 18,75 | 20,25 | 58,96 | 0,1425 | 0,0577 | |||
| COO / The Cooper Companies, Inc. | 0,23 | -48,51 | 19,09 | -38,44 | 0,1344 | -0,0720 | |||
| ZTS / Zoetis Inc. | 0,15 | -11,07 | 19,06 | -23,53 | 0,1342 | -0,0317 | |||
| ORCL / Oracle Corporation | 0,10 | -8,64 | 18,90 | -36,68 | 0,1330 | -0,0656 | |||
| CSCO / Cisco Systems, Inc. | 0,24 | -0,80 | 18,85 | 11,68 | 0,1327 | 0,0204 | |||
| AMGN / Amgen Inc. | 0,06 | -1,36 | 18,81 | 14,41 | 0,1324 | 0,0230 | |||
| SFM / Sprouts Farmers Market, Inc. | 0,23 | -30,06 | 18,54 | -48,78 | 0,1305 | -0,1104 | |||
| CME / CME Group Inc. | 0,07 | -2,50 | 18,20 | -1,46 | 0,1281 | 0,0052 | |||
| SMMD / iShares Trust - iShares Russell 2500 ETF | 0,24 | 111,99 | 18,00 | 115,49 | 0,1267 | 0,0711 | |||
| AVY / Avery Dennison Corporation | 0,10 | 14,47 | 17,76 | 28,38 | 0,1250 | 0,0329 | |||
| BMI / Badger Meter, Inc. | 0,10 | 14,75 | 17,66 | 12,07 | 0,1243 | 0,0194 | |||
| BR / Broadridge Financial Solutions, Inc. | 0,08 | -2,43 | 17,58 | -8,57 | 0,1237 | -0,0042 | |||
| MA / Mastercard Incorporated | 0,03 | -1,77 | 17,57 | -1,41 | 0,1237 | 0,0051 | |||
| ALL / The Allstate Corporation | 0,08 | -1,41 | 17,51 | -4,39 | 0,1233 | 0,0014 | |||
| ENTG / Entegris, Inc. | 0,20 | 9,34 | 16,85 | -0,37 | 0,1186 | 0,0060 | |||
| BKNG / Booking Holdings Inc. | 0,00 | -3,56 | 16,55 | -4,35 | 0,1165 | 0,0014 | |||
| MYRG / MYR Group Inc. | 0,07 | 2,44 | 16,37 | 7,60 | 0,1152 | 0,0140 | |||
| MORN / Morningstar, Inc. | 0,07 | 12,74 | 16,20 | 5,60 | 0,1140 | 0,0119 | |||
| NEE / NextEra Energy, Inc. | 0,20 | -1,43 | 16,05 | 4,83 | 0,1129 | 0,0111 | |||
| LIN / Linde plc | 0,04 | -2,80 | 15,85 | -12,74 | 0,1116 | -0,0093 | |||
| IBM / International Business Machines Corporation | 0,05 | -0,28 | 15,62 | 4,69 | 0,1099 | 0,0107 | |||
| AME / AMETEK, Inc. | 0,08 | -1,74 | 15,60 | 7,31 | 0,1098 | 0,0131 | |||
| CDW / CDW Corporation | 0,11 | 8,65 | 15,59 | -7,10 | 0,1098 | -0,0019 | |||
| KNSL / Kinsale Capital Group, Inc. | 0,04 | 5,56 | 15,21 | -2,91 | 0,1070 | 0,0028 | |||
| MCD / McDonald's Corporation | 0,05 | -1,41 | 15,20 | -0,85 | 0,1070 | 0,0050 | |||
| SPSC / SPS Commerce, Inc. | 0,17 | 5,67 | 15,05 | -9,56 | 0,1059 | -0,0048 | |||
| ACN / Accenture plc | 0,06 | -5,15 | 15,03 | 3,19 | 0,1058 | 0,0089 | |||
| LLY / Eli Lilly and Company | 0,01 | -7,04 | 14,85 | 30,93 | 0,1045 | 0,0290 | |||
| TBBK / The Bancorp, Inc. | 0,22 | -0,45 | 14,60 | -10,24 | 0,1027 | -0,0055 | |||
| PATK / Patrick Industries, Inc. | 0,13 | 2,45 | 14,42 | 7,41 | 0,1015 | 0,0121 | |||
| HL / Hecla Mining Company | 0,74 | -6,40 | 14,21 | 48,45 | 0,1000 | 0,0363 | |||
| SHW / The Sherwin-Williams Company | 0,04 | -3,66 | 14,17 | -9,85 | 0,0998 | -0,0049 | |||
| ASML / ASML Holding N.V. - Depositary Receipt (Common Stock) | 0,01 | -1,60 | 13,84 | 8,74 | 0,0974 | 0,0127 | |||
| WMT / Walmart Inc. | 0,12 | 705,63 | 13,67 | 771,13 | 0,0962 | 0,0858 | |||
| UMBF / UMB Financial Corporation | 0,12 | -0,20 | 13,53 | -2,99 | 0,0952 | 0,0024 | |||
| IESC / IES Holdings, Inc. | 0,03 | 2,47 | 13,33 | 0,25 | 0,0938 | 0,0053 | |||
| HLNE / Hamilton Lane Incorporated | 0,10 | -1,15 | 13,21 | -1,50 | 0,0930 | 0,0037 | |||
| TROW / T. Rowe Price Group, Inc. | 0,12 | -5,99 | 12,79 | -6,23 | 0,0900 | -0,0007 | |||
| WTFC / Wintrust Financial Corporation | 0,09 | 0,04 | 12,70 | 5,60 | 0,0894 | 0,0094 | |||
| HURN / Huron Consulting Group Inc. | 0,07 | -1,05 | 12,64 | 16,57 | 0,0890 | 0,0168 | |||
| BROS / Dutch Bros Inc. | 0,21 | -3,19 | 12,62 | 13,23 | 0,0889 | 0,0147 | |||
| CVX / Chevron Corporation | 0,08 | -2,95 | 12,04 | -4,75 | 0,0848 | 0,0006 | |||
| POOL / Pool Corporation | 0,05 | 0,91 | 11,43 | -25,56 | 0,0805 | -0,0217 | |||
| ACMR / ACM Research, Inc. | 0,29 | 2,67 | 11,42 | 3,51 | 0,0804 | 0,0070 | |||
| IVV / iShares Trust - iShares Core S&P 500 ETF | 0,02 | 1.509,24 | 11,10 | 1.549,18 | 0,0781 | 0,0736 | |||
| VIRT / Virtu Financial, Inc. | 0,33 | 2,38 | 11,02 | -3,91 | 0,0776 | 0,0013 | |||
| DUOL / Duolingo, Inc. | 0,06 | 3,33 | 10,83 | -43,65 | 0,0762 | -0,0517 | |||
| TRMB / Trimble Inc. | 0,14 | -3,56 | 10,69 | -7,45 | 0,0752 | -0,0016 | |||
| GPI / Group 1 Automotive, Inc. | 0,03 | 2,83 | 10,50 | -7,56 | 0,0739 | -0,0017 | |||
| EOG / EOG Resources, Inc. | 0,10 | -9,20 | 10,46 | -14,97 | 0,0736 | -0,0082 | |||
| CDNS / Cadence Design Systems, Inc. | 0,03 | -0,95 | 10,28 | -11,85 | 0,0723 | -0,0053 | |||
| HE / Hawaiian Electric Industries, Inc. | 0,78 | 2,38 | 9,56 | 14,07 | 0,0673 | 0,0115 | |||
| TDS / Telephone and Data Systems, Inc. | 0,23 | 3,74 | 9,35 | 8,39 | 0,0658 | 0,0084 | |||
| HQY / HealthEquity, Inc. | 0,10 | 36,27 | 9,33 | 31,74 | 0,0656 | 0,0185 | |||
| CNX / CNX Resources Corporation | 0,25 | -0,89 | 9,28 | 13,45 | 0,0653 | 0,0109 | |||
| PRAX / Praxis Precision Medicines, Inc. | 0,03 | 2,65 | 9,21 | 470,92 | 0,0648 | 0,0541 | |||
| WDAY / Workday, Inc. | 0,04 | -1,23 | 8,73 | -11,88 | 0,0615 | -0,0045 | |||
| BKU / BankUnited, Inc. | 0,19 | -1,45 | 8,51 | 15,10 | 0,0599 | 0,0107 | |||
| OKTA / Okta, Inc. | 0,10 | 22,98 | 8,48 | 15,98 | 0,0597 | 0,0110 | |||
| CENX / Century Aluminum Company | 0,21 | 1,89 | 8,09 | 35,98 | 0,0569 | 0,0173 | |||
| FNB / F.N.B. Corporation | 0,47 | 2,60 | 7,98 | 8,92 | 0,0561 | 0,0074 | |||
| BOH / Bank of Hawaii Corporation | 0,12 | -2,72 | 7,92 | 1,32 | 0,0557 | 0,0037 | |||
| ATEC / Alphatec Holdings, Inc. | 0,37 | -2,80 | 7,86 | 40,64 | 0,0553 | 0,0181 | |||
| THG / The Hanover Insurance Group, Inc. | 0,04 | -2,51 | 7,79 | -1,90 | 0,0548 | 0,0020 | |||
| MNST / Monster Beverage Corporation | 0,10 | 0,93 | 7,78 | 14,96 | 0,0547 | 0,0097 | |||
| STAG / STAG Industrial, Inc. | 0,21 | 2,55 | 7,67 | 6,83 | 0,0540 | 0,0062 | |||
| CCJ / Cameco Corporation | 0,08 | 8,35 | 7,67 | 18,21 | 0,0540 | 0,0108 | |||
| NSSC / Napco Security Technologies, Inc. | 0,18 | 3,45 | 7,56 | 0,45 | 0,0532 | 0,0031 | |||
| MSI / Motorola Solutions, Inc. | 0,02 | -92,36 | 7,31 | -93,60 | 0,0515 | -0,7085 | |||
| WAFD / WaFd, Inc | 0,22 | 2,51 | 7,03 | 8,40 | 0,0495 | 0,0063 | |||
| RES / RPC, Inc. | 1,28 | 1,88 | 6,94 | 16,43 | 0,0488 | 0,0092 | |||
| CALM / Cal-Maine Foods, Inc. | 0,08 | -2,22 | 6,75 | -17,32 | 0,0475 | -0,0068 | |||
| ALKT / Alkami Technology, Inc. | 0,29 | -7,70 | 6,73 | -14,27 | 0,0473 | -0,0049 | |||
| LCII / LCI Industries | 0,06 | 2,15 | 6,69 | 33,05 | 0,0471 | 0,0136 | |||
| GPOR / Gulfport Energy Corporation | 0,03 | -7,32 | 6,67 | 6,50 | 0,0470 | 0,0053 | |||
| IBKR / Interactive Brokers Group, Inc. | 0,10 | 6,66 | 0,0469 | 0,0469 | |||||
| DOCN / DigitalOcean Holdings, Inc. | 0,14 | 2,96 | 6,55 | 45,04 | 0,0461 | 0,0160 | |||
| CNO / CNO Financial Group, Inc. | 0,15 | 2,88 | 6,48 | 10,47 | 0,0456 | 0,0066 | |||
| BKH / Black Hills Corporation | 0,09 | -2,89 | 6,30 | 9,46 | 0,0443 | 0,0060 | |||
| IJK / iShares Trust - iShares S&P Mid-Cap 400 Growth ETF | 0,06 | 1.608,68 | 6,30 | 1.629,40 | 0,0443 | 0,0419 | |||
| PCH / PotlatchDeltic Corporation | 0,16 | 2,97 | 6,27 | 0,51 | 0,0442 | 0,0026 | |||
| WINA / Winmark Corporation | 0,02 | 2,21 | 6,12 | -16,85 | 0,0431 | -0,0059 | |||
| MHO / M/I Homes, Inc. | 0,05 | -2,63 | 6,05 | -13,74 | 0,0426 | -0,0041 | |||
| POR / Portland General Electric Company | 0,12 | -3,67 | 5,84 | 5,08 | 0,0411 | 0,0041 | |||
| XOM / Exxon Mobil Corporation | 0,05 | -0,68 | 5,82 | 6,00 | 0,0409 | 0,0044 | |||
| GTY / Getty Realty Corp. | 0,21 | -1,88 | 5,81 | 0,10 | 0,0409 | 0,0023 | |||
| BWXT / BWX Technologies, Inc. | 0,03 | -0,70 | 5,77 | -6,91 | 0,0406 | -0,0006 | |||
| VST / Vistra Corp. | 0,04 | 18,13 | 5,76 | -2,74 | 0,0405 | 0,0011 | |||
| APLE / Apple Hospitality REIT, Inc. | 0,47 | 1,73 | 5,60 | 0,38 | 0,0394 | 0,0023 | |||
| AOK / iShares Trust - iShares Core 30/70 Conservative Allocation ETF | 0,14 | 222,01 | 5,45 | 221,91 | 0,0384 | 0,0271 | |||
| TCBI / Texas Capital Bancshares, Inc. | 0,06 | -5,13 | 5,30 | 1,61 | 0,0373 | 0,0026 | |||
| BLBD / Blue Bird Corporation | 0,11 | 2,93 | 5,27 | -15,94 | 0,0371 | -0,0046 | |||
| MQ / Marqeta, Inc. | 1,09 | 2,93 | 5,15 | -7,40 | 0,0363 | -0,0008 | |||
| SR / Spire Inc. | 0,06 | 2,96 | 5,13 | 4,46 | 0,0361 | 0,0034 | |||
| DHT / DHT Holdings, Inc. | 0,41 | -3,22 | 5,04 | -1,12 | 0,0355 | 0,0016 | |||
| AMAL / Amalgamated Financial Corp. | 0,15 | -6,07 | 4,77 | 10,80 | 0,0336 | 0,0049 | |||
| CMC / Commercial Metals Company | 0,06 | -7,81 | 4,38 | 11,43 | 0,0308 | 0,0047 | |||
| ASGN / ASGN Incorporated | 0,09 | 3,55 | 4,28 | 5,34 | 0,0301 | 0,0031 | |||
| OZK / Bank OZK | 0,09 | 3,00 | 4,13 | -7,02 | 0,0291 | -0,0005 | |||
| FTNT / Fortinet, Inc. | 0,05 | -79,03 | 4,10 | -80,19 | 0,0289 | -0,1090 | |||
| PG / The Procter & Gamble Company | 0,03 | -24,65 | 4,05 | -29,73 | 0,0285 | -0,0099 | |||
| TALO / Talos Energy Inc. | 0,36 | -5,91 | 3,98 | 8,11 | 0,0280 | 0,0035 | |||
| NOMD / Nomad Foods Limited | 0,31 | -3,25 | 3,89 | -7,97 | 0,0274 | -0,0007 | |||
| POWL / Powell Industries, Inc. | 0,01 | 2,97 | 3,86 | 7,70 | 0,0272 | 0,0033 | |||
| FHI / Federated Hermes, Inc. | 0,07 | 2,93 | 3,76 | 3,21 | 0,0265 | 0,0022 | |||
| CLSK / CleanSpark, Inc. | 0,36 | 2,96 | 3,64 | -28,15 | 0,0256 | -0,0081 | |||
| DVAX / Dynavax Technologies Corporation | 0,23 | 1,50 | 3,58 | 57,22 | 0,0252 | 0,0101 | |||
| RLAY / Relay Therapeutics, Inc. | 0,41 | 1,30 | 3,50 | 64,15 | 0,0247 | 0,0105 | |||
| VWO / Vanguard International Equity Index Funds - Vanguard FTSE Emerging Markets ETF | 0,06 | -3,39 | 3,49 | -4,14 | 0,0246 | 0,0003 | |||
| HIW / Highwoods Properties, Inc. | 0,13 | 2,64 | 3,41 | -16,71 | 0,0240 | -0,0032 | |||
| CRSP / CRISPR Therapeutics AG | 0,06 | -7,01 | 3,32 | -24,76 | 0,0234 | -0,0060 | |||
| AMLP / ALPS ETF Trust - Alerian MLP ETF | 0,07 | -5,29 | 3,31 | -5,13 | 0,0233 | 0,0001 | |||
| HLIO / Helios Technologies, Inc. | 0,06 | 3,05 | 3,24 | 5,75 | 0,0228 | 0,0024 | |||
| ACVA / ACV Auctions Inc. | 0,39 | 2,27 | 3,12 | -17,23 | 0,0219 | -0,0031 | |||
| AVA / Avista Corporation | 0,08 | -7,74 | 3,04 | -5,96 | 0,0214 | -0,0001 | |||
| BKR / Baker Hughes Company | 0,06 | -11,60 | 2,94 | -17,38 | 0,0207 | -0,0030 | |||
| ANGL / VanEck ETF Trust - VanEck Fallen Angel High Yield Bond ETF | 0,10 | -4,96 | 2,92 | -6,14 | 0,0206 | -0,0001 | |||
| URI / United Rentals, Inc. | 0,00 | 0,00 | 2,89 | -15,24 | 0,0203 | -0,0023 | |||
| PFF / iShares Trust - iShares Preferred and Income Securities ETF | 0,09 | -6,09 | 2,86 | -8,05 | 0,0201 | -0,0006 | |||
| LUMN / Lumen Technologies, Inc. | 0,36 | -12,71 | 2,83 | 10,85 | 0,0199 | 0,0029 | |||
| VUG / Vanguard Index Funds - Vanguard Growth ETF | 0,01 | 30,54 | 2,79 | 32,75 | 0,0197 | 0,0057 | |||
| BBT / Beacon Financial Corporation | 0,10 | -8,03 | 2,74 | 2,31 | 0,0193 | 0,0015 | |||
| MTDR / Matador Resources Company | 0,06 | 2,75 | 2,70 | -2,94 | 0,0190 | 0,0005 | |||
| KFY / Korn Ferry | 0,04 | 3,10 | 2,66 | -2,74 | 0,0187 | 0,0005 | |||
| ADBE / Adobe Inc. | 0,01 | -1,64 | 2,66 | -2,42 | 0,0187 | 0,0006 | |||
| CSMD / Professionally Managed Portfolios - Congress SMid Growth ETF | 0,08 | 9,24 | 2,60 | 3,72 | 0,0183 | 0,0016 | |||
| EFA / iShares Trust - iShares MSCI EAFE ETF | 0,03 | -1,34 | 2,54 | 1,48 | 0,0179 | 0,0012 | |||
| SPY / SPDR S&P 500 ETF | 0,00 | 18,77 | 2,51 | 21,61 | 0,0177 | 0,0039 | |||
| BDN / Brandywine Realty Trust | 0,86 | 2,90 | 2,50 | -27,96 | 0,0176 | -0,0055 | |||
| CAML / Professionally Managed Portfolios - Congress Large Cap Growth ETF | 0,07 | -8,37 | 2,49 | -9,81 | 0,0175 | -0,0009 | |||
| PLXS / Plexus Corp. | 0,02 | 2,79 | 2,45 | 4,43 | 0,0173 | 0,0016 | |||
| EQIX / Equinix, Inc. | 0,00 | -2,80 | 2,34 | -4,95 | 0,0165 | 0,0001 | |||
| CP / Canadian Pacific Kansas City Limited | 0,03 | -4,75 | 2,33 | -5,87 | 0,0164 | -0,0001 | |||
| IDA / IDACORP, Inc. | 0,02 | -11,24 | 2,22 | -14,96 | 0,0156 | -0,0018 | |||
| IRT / Independence Realty Trust, Inc. | 0,12 | -7,79 | 2,18 | -1,67 | 0,0153 | 0,0006 | |||
| TNGX / Tango Therapeutics, Inc. | 0,23 | 2,85 | 2,08 | 8,46 | 0,0146 | 0,0019 | |||
| INTU / Intuit Inc. | 0,00 | -15,05 | 2,02 | -17,60 | 0,0142 | -0,0021 | |||
| CVI / CVR Energy, Inc. | 0,08 | -8,59 | 1,98 | -36,26 | 0,0139 | -0,0067 | |||
| ACHC / Acadia Healthcare Company, Inc. | 0,14 | 2,95 | 1,96 | -41,01 | 0,0138 | -0,0083 | |||
| ADSK / Autodesk, Inc. | 0,01 | -2,68 | 1,89 | -9,34 | 0,0133 | -0,0006 | |||
| SM / SM Energy Company | 0,10 | -91,84 | 1,85 | -93,89 | 0,0130 | -0,1885 | |||
| MTH / Meritage Homes Corporation | 0,03 | 3,19 | 1,78 | -6,27 | 0,0125 | -0,0001 | |||
| MS / Morgan Stanley | 0,01 | -5,92 | 1,74 | 5,06 | 0,0123 | 0,0012 | |||
| ACLX / Arcellx, Inc. | 0,03 | 2,75 | 1,70 | -18,39 | 0,0119 | -0,0019 | |||
| FCN / FTI Consulting, Inc. | 0,01 | -6,69 | 1,68 | -1,35 | 0,0118 | 0,0005 | |||
| AJG / Arthur J. Gallagher & Co. | 0,01 | -98,40 | 1,65 | -98,66 | 0,0116 | -0,8112 | |||
| VSS / Vanguard International Equity Index Funds - Vanguard FTSE All-World ex-US Small-Cap ETF | 0,01 | -8,64 | 1,63 | -8,14 | 0,0114 | -0,0003 | |||
| AAXJ / iShares Trust - iShares MSCI All Country Asia ex Japan ETF | 0,02 | -8,82 | 1,61 | -6,97 | 0,0114 | -0,0002 | |||
| TMUS / T-Mobile US, Inc. | 0,01 | -4,01 | 1,53 | -18,58 | 0,0108 | -0,0017 | |||
| VOT / Vanguard Index Funds - Vanguard Mid-Cap Growth ETF | 0,01 | 27,45 | 1,52 | 21,12 | 0,0107 | 0,0023 | |||
| CPRT / Copart, Inc. | 0,04 | -31,26 | 1,49 | -40,16 | 0,0105 | -0,0061 | |||
| CL / Colgate-Palmolive Company | 0,02 | -87,68 | 1,46 | -87,82 | 0,0103 | -0,0697 | |||
| CMIDX / Professionally Managed Portfolios - Congress Mid Cap Growth Fund Retail Class | 0,08 | -22,23 | 1,46 | -36,18 | 0,0102 | -0,0049 | |||
| PAVE / Global X Funds - Global X U.S. Infrastructure Development ETF | 0,03 | -8,65 | 1,43 | -8,34 | 0,0101 | -0,0003 | |||
| PDBC / Invesco Optimum Yield Diversified Commodity Strategy No K-1 ETF | 0,11 | -8,47 | 1,42 | -9,73 | 0,0100 | -0,0005 | |||
| IJR / iShares Trust - iShares Core S&P Small-Cap ETF | 0,01 | -8,46 | 1,33 | -7,45 | 0,0094 | -0,0002 | |||
| APD / Air Products and Chemicals, Inc. | 0,01 | -17,15 | 1,30 | -24,93 | 0,0092 | -0,0024 | |||
| VRT / Vertiv Holdings Co | 0,01 | 0,00 | 1,26 | 7,40 | 0,0089 | 0,0011 | |||
| SPGI / S&P Global Inc. | 0,00 | 0,00 | 1,23 | 7,41 | 0,0087 | 0,0010 | |||
| DECK / Deckers Outdoor Corporation | 0,01 | -40,84 | 1,23 | -39,49 | 0,0087 | -0,0049 | |||
| INSP / Inspire Medical Systems, Inc. | 0,01 | -3,21 | 1,21 | 20,38 | 0,0085 | 0,0018 | |||
| VOO / Vanguard Index Funds - Vanguard S&P 500 ETF | 0,00 | 6,59 | 1,19 | 9,20 | 0,0084 | 0,0011 | |||
| TDY / Teledyne Technologies Incorporated | 0,00 | -44,55 | 1,12 | -51,71 | 0,0079 | -0,0075 | |||
| TTWO / Take-Two Interactive Software, Inc. | 0,00 | -42,45 | 1,12 | -43,00 | 0,0079 | -0,0052 | |||
| DRI / Darden Restaurants, Inc. | 0,01 | -41,18 | 1,10 | -43,12 | 0,0077 | -0,0051 | |||
| PGR / The Progressive Corporation | 0,00 | 0,00 | 1,05 | -7,76 | 0,0074 | -0,0002 | |||
| KO / The Coca-Cola Company | 0,01 | -5,84 | 1,04 | -0,67 | 0,0073 | 0,0003 | |||
| MAR / Marriott International, Inc. | 0,00 | 0,00 | 1,02 | 19,11 | 0,0072 | 0,0015 | |||
| GD / General Dynamics Corporation | 0,00 | -7,67 | 1,00 | -8,89 | 0,0071 | -0,0003 | |||
| Congress Small Cap Growth Fund / (74316P710) | 0,02 | 1,00 | 0,0000 | ||||||
| NXPI / NXP Semiconductors N.V. | 0,00 | -21,03 | 0,97 | -24,69 | 0,0068 | -0,0018 | |||
| MLTX / MoonLake Immunotherapeutics | 0,07 | -3,09 | 0,94 | 78,14 | 0,0066 | 0,0031 | |||
| JNJ / Johnson & Johnson | 0,00 | -1,57 | 0,91 | 9,92 | 0,0064 | 0,0009 | |||
| ROK / Rockwell Automation, Inc. | 0,00 | 0,00 | 0,90 | 11,34 | 0,0064 | 0,0010 | |||
| RMD / ResMed Inc. | 0,00 | -43,61 | 0,90 | -50,39 | 0,0063 | -0,0057 | |||
| ADP / Automatic Data Processing, Inc. | 0,00 | -2,11 | 0,90 | -14,19 | 0,0063 | -0,0006 | |||
| BK / The Bank of New York Mellon Corporation | 0,01 | 0,00 | 0,89 | 6,50 | 0,0062 | 0,0007 | |||
| ABBV / AbbVie Inc. | 0,00 | -5,77 | 0,84 | -7,09 | 0,0059 | -0,0001 | |||
| TFC / Truist Financial Corporation | 0,02 | -7,70 | 0,80 | -0,62 | 0,0056 | 0,0003 | |||
| TXN / Texas Instruments Incorporated | 0,00 | -8,29 | 0,79 | -13,41 | 0,0056 | -0,0005 | |||
| JANX / Janux Therapeutics, Inc. | 0,06 | 2,81 | 0,79 | -41,97 | 0,0056 | -0,0035 | |||
| BAH / Booz Allen Hamilton Holding Corporation | 0,01 | -98,31 | 0,79 | -98,57 | 0,0055 | -0,3619 | |||
| EVH / Evolent Health, Inc. | 0,19 | 2,81 | 0,77 | -51,41 | 0,0055 | -0,0052 | |||
| TER / Teradyne, Inc. | 0,00 | 0,00 | 0,75 | 40,68 | 0,0053 | 0,0017 | |||
| Congress Large Cap Growth Fund - Retail Cl / (742935216) | 0,01 | 0,71 | 0,0000 | ||||||
| TSLA / Tesla, Inc. | 0,00 | -3,10 | 0,70 | -2,09 | 0,0050 | 0,0002 | |||
| CHD / Church & Dwight Co., Inc. | 0,01 | -41,08 | 0,69 | -43,63 | 0,0049 | -0,0033 | |||
| ROP / Roper Technologies, Inc. | 0,00 | -23,60 | 0,69 | -31,78 | 0,0048 | -0,0019 | |||
| HON / Honeywell International Inc. | 0,00 | -4,59 | 0,68 | -11,63 | 0,0048 | -0,0003 | |||
| IWM / iShares Trust - iShares Russell 2000 ETF | 0,00 | 0,00 | 0,65 | 1,72 | 0,0046 | 0,0003 | |||
| LRCX / Lam Research Corporation | 0,00 | 0,18 | 0,65 | 28,15 | 0,0046 | 0,0012 | |||
| BRK.B / Berkshire Hathaway Inc. | 0,00 | 0,00 | 0,63 | 0,00 | 0,0044 | 0,0002 | |||
| MRK / Merck & Co., Inc. | 0,01 | -7,05 | 0,62 | 16,64 | 0,0044 | 0,0008 | |||
| USFD / US Foods Holding Corp. | 0,01 | -56,15 | 0,61 | -56,90 | 0,0043 | -0,0051 | |||
| XLK / The Select Sector SPDR Trust - State Street Technology Select Sector SPDR ETF | 0,00 | 100,00 | 0,57 | 2,15 | 0,0040 | 0,0003 | |||
| CHDN / Churchill Downs Incorporated | 0,00 | -2,54 | 0,56 | 14,37 | 0,0039 | 0,0007 | |||
| MDY / SPDR S&P MidCap 400 ETF Trust | 0,00 | -45,04 | 0,54 | -44,33 | 0,0038 | -0,0026 | |||
| SO / The Southern Company | 0,01 | -9,26 | 0,51 | -16,61 | 0,0036 | -0,0005 | |||
| FN / Fabrinet | 0,00 | -40,27 | 0,50 | -25,37 | 0,0035 | -0,0009 | |||
| ITW / Illinois Tool Works Inc. | 0,00 | 0,00 | 0,50 | -5,71 | 0,0035 | -0,0000 | |||
| IJT / iShares Trust - iShares S&P Small-Cap 600 Growth ETF | 0,00 | 0,49 | 0,0035 | 0,0035 | |||||
| UNH / UnitedHealth Group Incorporated | 0,00 | -30,43 | 0,48 | -33,57 | 0,0034 | -0,0014 | |||
| KEYS / Keysight Technologies, Inc. | 0,00 | -52,05 | 0,47 | -44,39 | 0,0033 | -0,0023 | |||
| FXI / iShares Trust - iShares China Large-Cap ETF | 0,01 | 0,00 | 0,46 | -6,94 | 0,0032 | -0,0001 | |||
| GNRC / Generac Holdings Inc. | 0,00 | 0,00 | 0,44 | -18,54 | 0,0031 | -0,0005 | |||
| VRTX / Vertex Pharmaceuticals Incorporated | 0,00 | -99,42 | 0,42 | -99,33 | 0,0030 | -0,4163 | |||
| ICE / Intercontinental Exchange, Inc. | 0,00 | 0,00 | 0,41 | -3,99 | 0,0029 | 0,0000 | |||
| MMC / Marsh & McLennan Companies, Inc. | 0,00 | 0,00 | 0,39 | -7,86 | 0,0027 | -0,0001 | |||
| UNP / Union Pacific Corporation | 0,00 | 0,18 | 0,39 | -1,78 | 0,0027 | 0,0001 | |||
| FCX / Freeport-McMoRan Inc. | 0,01 | -45,08 | 0,37 | -28,95 | 0,0026 | -0,0009 | |||
| CNS / Cohen & Steers, Inc. | 0,01 | -99,08 | 0,37 | -99,13 | 0,0026 | -0,2788 | |||
| SCCO / Southern Copper Corporation | 0,00 | 0,81 | 0,36 | 19,00 | 0,0025 | 0,0005 | |||
| MRVL / Marvell Technology, Inc. | 0,00 | -22,16 | 0,35 | -21,36 | 0,0024 | -0,0005 | |||
| US46637K2814 / JPMORGAN HEDGED EQUITY-I | 0,01 | 0,16 | 0,33 | 2,52 | 0,0023 | 0,0002 | |||
| DE / Deere & Company | 0,00 | 0,14 | 0,32 | 2,22 | 0,0023 | 0,0002 | |||
| MTD / Mettler-Toledo International Inc. | 0,00 | -55,53 | 0,30 | -49,58 | 0,0021 | -0,0019 | |||
| NOC / Northrop Grumman Corporation | 0,00 | 0,38 | 0,30 | -6,27 | 0,0021 | -0,0000 | |||
| SAIA / Saia, Inc. | 0,00 | -68,69 | 0,30 | -65,82 | 0,0021 | -0,0037 | |||
| LOW / Lowe's Companies, Inc. | 0,00 | 0,00 | 0,29 | -4,28 | 0,0021 | 0,0000 | |||
| QLYS / Qualys, Inc. | 0,00 | -68,35 | 0,28 | -68,20 | 0,0020 | -0,0039 | |||
| HPQ / HP Inc. | 0,01 | -12,69 | 0,27 | -28,65 | 0,0019 | -0,0006 | |||
| PNC / The PNC Financial Services Group, Inc. | 0,00 | 0,00 | 0,27 | 3,89 | 0,0019 | 0,0002 | |||
| ABT / Abbott Laboratories | 0,00 | -10,63 | 0,26 | -16,51 | 0,0019 | -0,0002 | |||
| CRM / Salesforce, Inc. | 0,00 | -1,99 | 0,25 | 9,73 | 0,0017 | 0,0002 | |||
| SSD / Simpson Manufacturing Co., Inc. | 0,00 | 0,00 | 0,25 | -3,50 | 0,0017 | 0,0000 | |||
| QQQ / Invesco QQQ Trust, Series 1 | 0,00 | 0,25 | 0,25 | 2,90 | 0,0017 | 0,0001 | |||
| COIN / Coinbase Global, Inc. | 0,00 | 0,00 | 0,24 | -33,24 | 0,0017 | -0,0007 | |||
| WSM / Williams-Sonoma, Inc. | 0,00 | -77,81 | 0,23 | -79,73 | 0,0016 | -0,0059 | |||
| THR / Thermon Group Holdings, Inc. | 0,01 | 0,23 | 0,0016 | 0,0016 | |||||
| WTS / Watts Water Technologies, Inc. | 0,00 | -60,31 | 0,23 | -60,80 | 0,0016 | -0,0022 | |||
| DHR / Danaher Corporation | 0,00 | -3,45 | 0,22 | 11,44 | 0,0016 | 0,0002 | |||
| A / Agilent Technologies, Inc. | 0,00 | 0,22 | 0,0016 | 0,0016 | |||||
| ONTO / Onto Innovation Inc. | 0,00 | -72,03 | 0,21 | -65,92 | 0,0015 | -0,0027 | |||
| XLY / The Select Sector SPDR Trust - State Street Consumer Discretionary Select Sector SPDR ETF | 0,00 | 100,00 | 0,21 | 0,00 | 0,0015 | 0,0001 | |||
| VRSK / Verisk Analytics, Inc. | 0,00 | 0,00 | 0,21 | -11,21 | 0,0015 | -0,0001 | |||
| CNI / Canadian National Railway Company | 0,00 | 0,20 | 0,0014 | 0,0014 | |||||
| SPTM / SPDR Series Trust - State Street SPDR Portfolio S&P 1500 Composite Stock Market ETF | 0,00 | -12,49 | 0,20 | -10,71 | 0,0014 | -0,0001 | |||
| ORRCF / Oroco Resource Corp. | 0,02 | 0,00 | 0,01 | 0,00 | 0,0000 | 0,0000 | |||
| TTD / The Trade Desk, Inc. | 0,00 | -100,00 | 0,00 | 0,0000 | |||||
| WERN / Werner Enterprises, Inc. | 0,00 | -100,00 | 0,00 | 0,0000 | |||||
| LRN / Stride, Inc. | 0,00 | -100,00 | 0,00 | -100,00 | -0,4614 | ||||
| PAYC / Paycom Software, Inc. | 0,00 | -100,00 | 0,00 | 0,0000 | |||||
| WAL / Western Alliance Bancorporation | 0,00 | -100,00 | 0,00 | 0,0000 | |||||
| SMPL / The Simply Good Foods Company | 0,00 | -100,00 | 0,00 | -100,00 | -0,0676 | ||||
| NBIX / Neurocrine Biosciences, Inc. | 0,00 | -100,00 | 0,00 | 0,0000 | |||||
| DSGX / The Descartes Systems Group Inc. | 0,00 | -100,00 | 0,00 | -100,00 | -0,4441 | ||||
| CIEN / Ciena Corporation | 0,00 | -100,00 | 0,00 | 0,0000 | |||||
| MAS / Masco Corporation | 0,00 | -100,00 | 0,00 | 0,0000 | |||||
| SUI / Sun Communities, Inc. | 0,00 | -100,00 | 0,00 | 0,0000 | |||||
| CART / Maplebear Inc. | 0,00 | -100,00 | 0,00 | 0,0000 | |||||
| US9032887690 / USAA S&P 500 INDEX-RWRD | 0,00 | -100,00 | 0,00 | 0,0000 | |||||
| TREE / LendingTree, Inc. | 0,00 | -100,00 | 0,00 | -100,00 | -0,0107 | ||||
| US2332034139 / DFA US Core Equity 1 Portfolio | 0,00 | -100,00 | 0,00 | 0,0000 | |||||
| GDDY / GoDaddy Inc. | 0,00 | -100,00 | 0,00 | 0,0000 | |||||
| POWI / Power Integrations, Inc. | 0,00 | -100,00 | 0,00 | 0,0000 | |||||
| ITGR / Integer Holdings Corporation | 0,00 | -100,00 | 0,00 | 0,0000 | |||||
| ATR / AptarGroup, Inc. | 0,00 | -100,00 | 0,00 | 0,0000 | |||||
| CRL / Charles River Laboratories International, Inc. | 0,00 | -100,00 | 0,00 | 0,0000 | |||||
| DXCM / DexCom, Inc. | 0,00 | -100,00 | 0,00 | 0,0000 | |||||
| WST / West Pharmaceutical Services, Inc. | 0,00 | -100,00 | 0,00 | 0,0000 | |||||
| ULTA / Ulta Beauty, Inc. | 0,00 | -100,00 | 0,00 | 0,0000 | |||||
| ABG / Asbury Automotive Group, Inc. | 0,00 | -100,00 | 0,00 | 0,0000 | |||||
| IEX / IDEX Corporation | 0,00 | -100,00 | 0,00 | 0,0000 | |||||
| Charles Schwab Family Of Funds TREAS OB MNY INV / (808515621) | 0,00 | -100,00 | 0,00 | 0,0000 | |||||
| BDX / Becton, Dickinson and Company | 0,00 | -100,00 | 0,00 | 0,0000 |