Basisstatistiken
| Portfolio-Wert | $ 19.154.485.365 |
| Aktuelle Positionen | 107 |
Neueste Bestände, Performance, AUM (aus 13F, 13D)
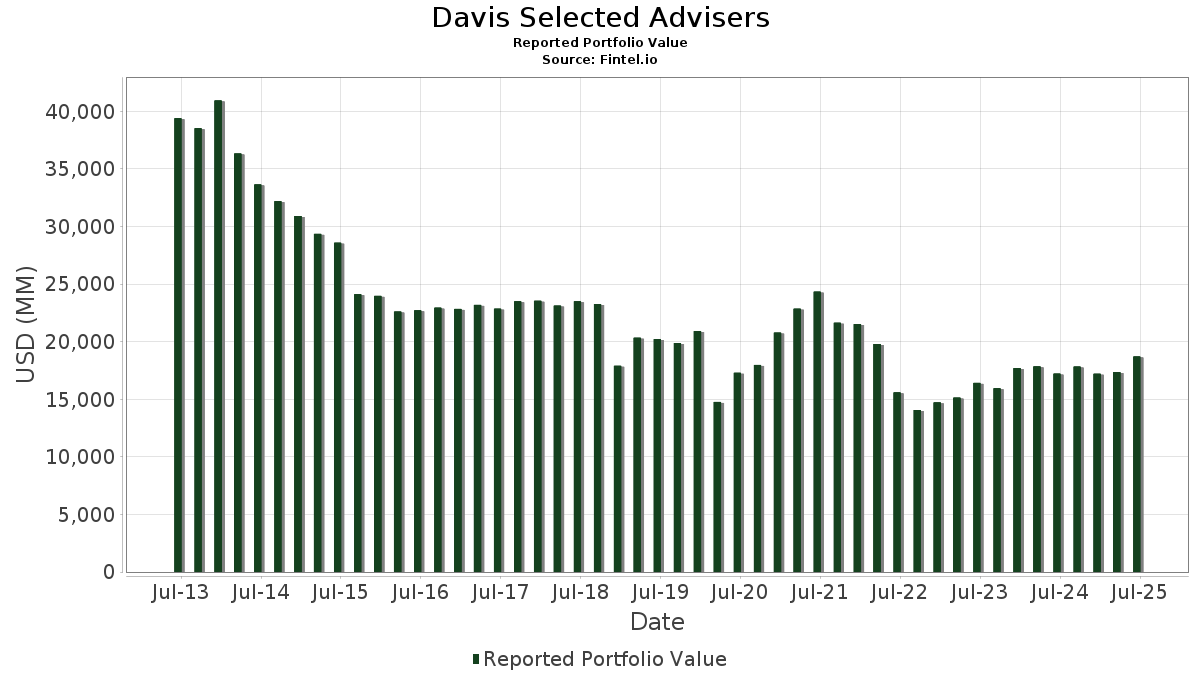
Davis Selected Advisers hat 107 Gesamtbeteiligungen in seinen letzten SEC-Einreichungen offengelegt. Der jüngste Portfoliowert wird auf $ 19.154.485.365 USD berechnet. Das tatsächliche verwaltete Vermögen (AUM) ist dieser Wert plus Barmittel (die nicht offengelegt werden). Davis Selected Adviserss Top-Bestände sind Capital One Financial Corporation (US:COF) , Meta Platforms, Inc. (US:META) , Applied Materials, Inc. (US:AMAT) , U.S. Bancorp (US:USB) , and CVS Health Corporation (US:CVS) . Davis Selected Adviserss neue Positionen sind Pinterest, Inc. (US:PINS) , Chime Financial, Inc. (US:CHYM) , Synopsys, Inc. (US:SNPS) , . Davis Selected Adviserss wichtigste Branchen sind "Wholesale Trade-durable Goods" (sic 50) , "Electric, Gas, And Sanitary Services " (sic 49) , and "Health Services" (sic 80) .
Top-Zuwächse in diesem Quartal
Wir verwenden die Veränderung der Portfolioallokation, weil dies die aussagekräftigste Kennzahl ist. Die Änderungen können auf Trades oder Änderungen der Aktienkurse zurückzuführen sein.
| Wertpapier | Aktien (MM) |
Wert (MM$) |
Portfolio % | ΔPortfolio % |
|---|---|---|---|---|
| PINS / Pinterest, Inc. | 7,89 | 253,89 | 1,3255 | 1,3255 |
| CTRA / Coterra Energy Inc. | 19,88 | 470,24 | 2,4550 | 1,1878 |
| AMAT / Applied Materials, Inc. | 5,55 | 1.137,12 | 5,9366 | 1,0838 |
| GOOGL / Alphabet Inc. | 2,77 | 673,53 | 3,5163 | 0,8266 |
| APP / AppLovin Corporation | 0,22 | 160,65 | 0,8387 | 0,4361 |
| VTRS / Viatris Inc. | 69,35 | 686,52 | 3,5841 | 0,4148 |
| TCOM / Trip.com Group Limited - Depositary Receipt (Common Stock) | 4,94 | 371,60 | 1,9400 | 0,3881 |
| YMM / Full Truck Alliance Co. Ltd. - Depositary Receipt (Common Stock) | 14,98 | 194,31 | 1,0145 | 0,2797 |
| CHYM / Chime Financial, Inc. | 2,40 | 48,39 | 0,2526 | 0,2526 |
| USB / U.S. Bancorp | 19,43 | 939,13 | 4,9029 | 0,2257 |
Top-Rückgänge in diesem Quartal
Wir verwenden die Veränderung der Portfolioallokation, weil dies die aussagekräftigste Kennzahl ist. Änderungen können auf Handelsgeschäfte oder Änderungen der Aktienkurse zurückzuführen sein.
| Wertpapier | Aktien (MM) |
Wert (MM$) |
Portfolio % | ΔPortfolio % |
|---|---|---|---|---|
| META / Meta Platforms, Inc. | 1,72 | 1.259,84 | 6,5773 | -1,7413 |
| HUM / Humana Inc. | 0,39 | 100,31 | 0,5237 | -1,6368 |
| CPNG / Coupang, Inc. | 0,00 | 0,00 | -0,9219 | |
| COF / Capital One Financial Corporation | 8,38 | 1.781,45 | 9,3004 | -0,8877 |
| MSFT / Microsoft Corporation | 0,05 | 27,09 | 0,1414 | -0,5180 |
| TXN / Texas Instruments Incorporated | 2,32 | 425,78 | 2,2229 | -0,4195 |
| BK / The Bank of New York Mellon Corporation | 1,01 | 110,12 | 0,5749 | -0,3499 |
| AMZN / Amazon.com, Inc. | 3,14 | 689,01 | 3,5971 | -0,2378 |
| MKL / Markel Group Inc. | 0,37 | 713,95 | 3,7273 | -0,2363 |
| BRK.A / Berkshire Hathaway Inc. | 0,00 | 752,69 | 3,9296 | -0,2205 |
13D/G Einreichungen
Dies ist eine Liste der 13D- und 13G-Einreichungen des letzten Jahres (falls vorhanden). Klicken Sie auf das Link-Symbol, um die vollständige Transaktionshistorie anzuzeigen. Grüne Zeilen zeigen neue Positionen an. Rote Zeilen zeigen geschlossene Positionen an.
| Datei Datum | Formular | Wertpapier | Vorherige Aktien |
Aktuelle Aktien |
ΔAktien % | % Eigentümerschaft |
% ΔEigentümerschaft | |
|---|---|---|---|---|---|---|---|---|
| 2025-11-10 | VTRS / Viatris Inc. | 66.375.520 | 69.345.645 | 4,47 | 6,70 | 8,06 | ||
| 2025-11-10 | MGM / MGM Resorts International | 23.821.109 | 23.953.452 | 0,56 | 9,60 | 1,05 |
13F und Fondseinreichungen
Dieses Formular wurde am 2025-12-29 für den Berichtszeitraum eingereicht 2025-09-30. Klicken Sie auf das Link-Symbol , um den gesamten Transaktionsverlauf zu sehen.
Upgrade um die Prämiendaten zu entsperren und nach Excel zu exportieren ![]() .
.
| Wertpapier | Typ | Durchschnittlicher Aktienkurs | Aktien (MM) |
ΔAktien (%) |
Wert ($MM) |
ΔAktien (%) |
Portfolio (%) |
ΔPortfolio (%) |
|
|---|---|---|---|---|---|---|---|---|---|
| COF / Capital One Financial Corporation | 8,38 | -6,43 | 1.781,45 | -6,51 | 9,3004 | -0,8877 | |||
| META / Meta Platforms, Inc. | 1,72 | -18,61 | 1.259,84 | -19,02 | 6,5773 | -1,7413 | |||
| AMAT / Applied Materials, Inc. | 5,55 | 12,03 | 1.137,12 | 25,29 | 5,9366 | 1,0838 | |||
| USB / U.S. Bancorp | 19,43 | 0,52 | 939,13 | 7,36 | 4,9029 | 0,2257 | |||
| CVS / CVS Health Corporation | 11,40 | -1,58 | 859,72 | 7,57 | 4,4884 | 0,2148 | |||
| MGM / MGM Resorts International | 23,95 | 0,56 | 830,23 | 1,35 | 4,3344 | -0,0459 | |||
| BRK.A / Berkshire Hathaway Inc. | 0,00 | -6,29 | 752,69 | -3,03 | 3,9296 | -0,2205 | |||
| MKL / Markel Group Inc. | 0,37 | 0,65 | 713,95 | -3,69 | 3,7273 | -0,2363 | |||
| AMZN / Amazon.com, Inc. | 3,14 | -4,01 | 689,01 | -3,93 | 3,5971 | -0,2378 | |||
| VTRS / Viatris Inc. | 69,35 | 4,47 | 686,52 | 15,82 | 3,5841 | 0,4148 | |||
| GOOGL / Alphabet Inc. | 2,77 | -2,94 | 673,53 | 33,89 | 3,5163 | 0,8266 | |||
| WFC / Wells Fargo & Company | 7,79 | -4,77 | 652,63 | -0,38 | 3,4072 | -0,0956 | |||
| TSN / Tyson Foods, Inc. | 9,96 | 11,23 | 540,94 | 7,97 | 2,8241 | 0,1452 | |||
| TECK / Teck Resources Limited | 11,02 | -0,10 | 483,83 | 8,58 | 2,5259 | 0,1434 | |||
| CTRA / Coterra Energy Inc. | 19,88 | 112,93 | 470,24 | 98,41 | 2,4550 | 1,1878 | |||
| TXN / Texas Instruments Incorporated | 2,32 | -2,64 | 425,78 | -13,84 | 2,2229 | -0,4195 | |||
| SOLV / Solventum Corporation | 5,52 | 0,45 | 402,79 | -3,31 | 2,1028 | -0,1245 | |||
| UNH / UnitedHealth Group Incorporated | 1,14 | 0,57 | 393,40 | 11,31 | 2,0538 | 0,1641 | |||
| TCOM / Trip.com Group Limited - Depositary Receipt (Common Stock) | 4,94 | -0,16 | 371,60 | 28,03 | 1,9400 | 0,3881 | |||
| CB / Chubb Limited | 1,07 | -0,13 | 302,13 | -2,70 | 1,5773 | -0,0830 | |||
| BRK.B / Berkshire Hathaway Inc. | 0,53 | -3,59 | 268,44 | -0,22 | 1,4014 | -0,0371 | |||
| DGX / Quest Diagnostics Incorporated | 1,36 | 0,53 | 259,50 | 6,66 | 1,3548 | 0,0539 | |||
| PINS / Pinterest, Inc. | 7,89 | 253,89 | 1,3255 | 1,3255 | |||||
| OC / Owens Corning | 1,78 | 0,47 | 251,43 | 3,35 | 1,3126 | 0,0118 | |||
| QSR / Restaurant Brands International Inc. | 3,54 | 3,59 | 227,21 | 0,23 | 1,1862 | -0,0259 | |||
| YMM / Full Truck Alliance Co. Ltd. - Depositary Receipt (Common Stock) | 14,98 | 28,75 | 194,31 | 41,40 | 1,0145 | 0,2797 | |||
| AGCO / AGCO Corporation | 1,81 | 0,46 | 194,11 | 4,27 | 1,0134 | 0,0180 | |||
| CI / The Cigna Group | 0,66 | 0,07 | 189,18 | -12,75 | 0,9877 | -0,1717 | |||
| JPM / JPMorgan Chase & Co. | 0,60 | -6,35 | 187,88 | 1,89 | 0,9809 | -0,0051 | |||
| DUSA / Davis Fundamental ETF Trust - Davis Select U.S. Equity ETF | 3,38 | 0,00 | 162,06 | 3,50 | 0,8461 | 0,0089 | |||
| APP / AppLovin Corporation | 0,22 | 3,95 | 160,65 | 113,36 | 0,8387 | 0,4361 | |||
| GOOG / Alphabet Inc. | 0,65 | -0,67 | 157,35 | 36,38 | 0,8215 | 0,2046 | |||
| COP / ConocoPhillips | 1,60 | 0,87 | 151,28 | 6,32 | 0,7898 | 0,0290 | |||
| FITB / Fifth Third Bancorp | 2,67 | 6,21 | 118,90 | 15,04 | 0,6207 | 0,0681 | |||
| BK / The Bank of New York Mellon Corporation | 1,01 | -46,76 | 110,12 | -36,33 | 0,5749 | -0,3499 | |||
| DINT / Davis Fundamental ETF Trust - Davis Select International ETF | 3,89 | 0,00 | 108,84 | 8,20 | 0,5682 | 0,0304 | |||
| PNC / The PNC Financial Services Group, Inc. | 0,50 | -0,11 | 100,83 | 7,67 | 0,5264 | 0,0257 | |||
| HUM / Humana Inc. | 0,39 | -76,67 | 100,31 | -75,18 | 0,5237 | -1,6368 | |||
| DFNL / Davis Fundamental ETF Trust - Davis Select Financial ETF | 2,13 | 0,00 | 96,31 | 5,31 | 0,5028 | 0,0138 | |||
| NTES / NetEase, Inc. - Depositary Receipt (Common Stock) | 0,59 | 0,23 | 90,39 | 13,20 | 0,4719 | 0,0450 | |||
| DWLD / Davis Fundamental ETF Trust - Davis Select Worldwide ETF | 1,92 | 0,00 | 86,67 | 9,14 | 0,4525 | 0,0279 | |||
| AXP / American Express Company | 0,25 | -8,34 | 82,36 | -4,55 | 0,4300 | -0,0314 | |||
| SE / Sea Limited - Depositary Receipt (Common Stock) | 0,44 | -1,72 | 78,75 | 9,83 | 0,4111 | 0,0277 | |||
| IAC / IAC Inc. | 2,24 | -1,63 | 76,44 | -10,24 | 0,3991 | -0,0563 | |||
| DAR / Darling Ingredients Inc. | 2,45 | 0,42 | 75,75 | -18,29 | 0,3955 | -0,1002 | |||
| WCC / WESCO International, Inc. | 0,29 | 0,63 | 61,88 | 14,92 | 0,3230 | 0,0351 | |||
| RKT / Rocket Companies, Inc. | 3,13 | 0,05 | 60,74 | 36,74 | 0,3171 | 0,0796 | |||
| L / Loews Corporation | 0,60 | -0,28 | 59,80 | 9,22 | 0,3122 | 0,0195 | |||
| BAC / Bank of America Corporation | 1,15 | -0,24 | 59,36 | 8,76 | 0,3099 | 0,0181 | |||
| CHYM / Chime Financial, Inc. | 2,40 | 48,39 | 0,2526 | 0,2526 | |||||
| NTB / The Bank of N.T. Butterfield & Son Limited | 1,06 | -0,33 | 45,44 | -3,39 | 0,2372 | -0,0143 | |||
| RNR / RenaissanceRe Holdings Ltd. | 0,14 | 0,05 | 36,35 | 4,60 | 0,1898 | 0,0040 | |||
| BEKE / KE Holdings Inc. - Depositary Receipt (Common Stock) | 1,85 | -0,05 | 35,18 | 7,05 | 0,1837 | 0,0079 | |||
| VALE / Vale S.A. - Depositary Receipt (Common Stock) | 2,93 | -0,59 | 31,83 | 11,18 | 0,1662 | 0,0131 | |||
| SCHW / The Charles Schwab Corporation | 0,30 | 0,00 | 28,30 | 4,64 | 0,1478 | 0,0031 | |||
| MSFT / Microsoft Corporation | 0,05 | -78,91 | 27,09 | -78,03 | 0,1414 | -0,5180 | |||
| PLD / Prologis, Inc. | 0,20 | 53,35 | 22,69 | 67,06 | 0,1185 | 0,0458 | |||
| JCI / Johnson Controls International plc | 0,19 | -24,18 | 20,45 | -21,07 | 0,1068 | -0,0318 | |||
| ORCL / Oracle Corporation | 0,07 | -49,04 | 18,86 | -34,45 | 0,0985 | -0,0554 | |||
| BXP / Boston Properties, Inc. | 0,24 | 14,37 | 17,82 | 26,02 | 0,0931 | 0,0174 | |||
| EQIX / Equinix, Inc. | 0,02 | 39,20 | 17,08 | 37,06 | 0,0892 | 0,0225 | |||
| NVDD / Direxion Shares ETF Trust - Direxion Daily NVDA Bear 1X Shares | 0,09 | 0,74 | 16,75 | 18,97 | 0,0875 | 0,0122 | |||
| REXR / Rexford Industrial Realty, Inc. | 0,40 | 5,37 | 16,24 | 21,78 | 0,0848 | 0,0135 | |||
| BRX / Brixmor Property Group Inc. | 0,57 | 14,37 | 15,78 | 21,57 | 0,0824 | 0,0130 | |||
| ANGI / Angi Inc. | 0,95 | -19,71 | 15,43 | -14,44 | 0,0806 | -0,0159 | |||
| ARE / Alexandria Real Estate Equities, Inc. | 0,18 | 15,35 | 15,01 | 32,36 | 0,0784 | 0,0177 | |||
| CUZ / Cousins Properties Incorporated | 0,51 | 11,32 | 14,83 | 7,29 | 0,0774 | 0,0035 | |||
| SPG / Simon Property Group, Inc. | 0,08 | 30,67 | 14,40 | 52,54 | 0,0752 | 0,0247 | |||
| DLR / Digital Realty Trust, Inc. | 0,08 | 18,73 | 14,05 | 17,74 | 0,0734 | 0,0095 | |||
| EG / Everest Group, Ltd. | 0,04 | -0,18 | 13,81 | 2,86 | 0,0721 | 0,0003 | |||
| PSA / Public Storage | 0,04 | 10,42 | 12,89 | 8,70 | 0,0673 | 0,0039 | |||
| AVB / AvalonBay Communities, Inc. | 0,07 | 15,15 | 12,86 | 9,31 | 0,0671 | 0,0042 | |||
| AMT / American Tower Corporation | 0,07 | -28,35 | 12,63 | -37,65 | 0,0659 | -0,0424 | |||
| SAP / SAP SE - Depositary Receipt (Common Stock) | 0,05 | 0,04 | 12,50 | -12,10 | 0,0653 | -0,0108 | |||
| SHO / Sunstone Hotel Investors, Inc. | 1,31 | 13,53 | 12,29 | 22,55 | 0,0642 | 0,0105 | |||
| STT / State Street Corporation | 0,10 | 43,65 | 12,04 | 56,71 | 0,0629 | 0,0218 | |||
| JD / JD.com, Inc. - Depositary Receipt (Common Stock) | 0,34 | -0,52 | 11,95 | 6,62 | 0,0624 | 0,0025 | |||
| NOAH / Noah Holdings Limited - Depositary Receipt (Common Stock) | 1,02 | 0,00 | 11,84 | -2,93 | 0,0618 | -0,0034 | |||
| REG / Regency Centers Corporation | 0,14 | 15,00 | 10,21 | 17,71 | 0,0533 | 0,0069 | |||
| MTB / M&T Bank Corporation | 0,05 | 0,16 | 10,08 | 2,02 | 0,0526 | -0,0002 | |||
| CPT / Camden Property Trust | 0,09 | 13,31 | 9,52 | 7,37 | 0,0497 | 0,0023 | |||
| AMH / American Homes 4 Rent | 0,29 | 14,08 | 9,50 | 5,16 | 0,0496 | 0,0013 | |||
| EGP / EastGroup Properties, Inc. | 0,05 | 14,76 | 8,96 | 16,23 | 0,0468 | 0,0056 | |||
| CDP / COPT Defense Properties | 0,30 | 104,84 | 8,78 | 115,86 | 0,0458 | 0,0241 | |||
| DOC / Healthpeak Properties, Inc. | 0,45 | 14,82 | 8,56 | 25,58 | 0,0447 | 0,0082 | |||
| MAA / Mid-America Apartment Communities, Inc. | 0,06 | 14,72 | 8,50 | 8,30 | 0,0444 | 0,0024 | |||
| VTR / Ventas, Inc. | 0,12 | -42,30 | 8,21 | -36,06 | 0,0429 | -0,0258 | |||
| EXR / Extra Space Storage Inc. | 0,06 | -3,01 | 7,76 | -7,29 | 0,0405 | -0,0042 | |||
| VICI / VICI Properties Inc. | 0,22 | 30,56 | 7,23 | 30,60 | 0,0377 | 0,0081 | |||
| TFC / Truist Financial Corporation | 0,16 | 0,38 | 7,15 | 6,76 | 0,0373 | 0,0015 | |||
| EQR / Equity Residential | 0,11 | 5,40 | 6,94 | 1,09 | 0,0362 | -0,0005 | |||
| UDR / UDR, Inc. | 0,19 | 14,94 | 6,94 | 4,88 | 0,0362 | 0,0009 | |||
| TRNO / Terreno Realty Corporation | 0,12 | 16,04 | 6,86 | 17,44 | 0,0358 | 0,0046 | |||
| HPP / Hudson Pacific Properties, Inc. | 2,30 | 0,18 | 6,35 | 0,92 | 0,0331 | -0,0005 | |||
| NTST / NETSTREIT Corp. | 0,34 | 55,28 | 6,18 | 65,63 | 0,0323 | 0,0123 | |||
| O / Realty Income Corporation | 0,09 | 91,49 | 5,69 | 102,06 | 0,0297 | 0,0146 | |||
| SUI / Sun Communities, Inc. | 0,04 | 14,54 | 5,67 | 16,81 | 0,0296 | 0,0036 | |||
| CHCT / Community Healthcare Trust Incorporated | 0,33 | 0,27 | 5,10 | -7,75 | 0,0266 | -0,0029 | |||
| DEI / Douglas Emmett, Inc. | 0,32 | 14,76 | 4,95 | 18,81 | 0,0258 | 0,0036 | |||
| ESS / Essex Property Trust, Inc. | 0,02 | -40,61 | 4,54 | -43,90 | 0,0237 | -0,0196 | |||
| SNPS / Synopsys, Inc. | 0,01 | 4,27 | 0,0223 | 0,0223 | |||||
| CCI / Crown Castle Inc. | 0,04 | 2,22 | 4,17 | -3,98 | 0,0218 | -0,0015 | |||
| TSM / Taiwan Semiconductor Manufacturing Company Limited - Depositary Receipt (Common Stock) | 0,01 | 0,00 | 2,01 | 23,31 | 0,0105 | 0,0018 | |||
| LRCX / Lam Research Corporation | 0,01 | 0,00 | 1,64 | 37,57 | 0,0086 | 0,0022 | |||
| IVE / iShares Trust - iShares S&P 500 Value ETF | 0,01 | -39,75 | 1,37 | -36,36 | 0,0071 | -0,0043 | |||
| CCK / Crown Holdings, Inc. | 0,01 | 0,00 | 0,83 | -6,24 | 0,0043 | -0,0004 | |||
| RH / RH | 0,00 | 0,00 | 0,46 | 7,57 | 0,0024 | 0,0001 | |||
| XOM / Exxon Mobil Corporation | 0,00 | -100,00 | 0,00 | -100,00 | -0,0012 | ||||
| AAPL / Apple Inc. | 0,00 | -100,00 | 0,00 | -100,00 | -0,0014 | ||||
| CPNG / Coupang, Inc. | 0,00 | -100,00 | 0,00 | -100,00 | -0,9219 |