Basisstatistiken
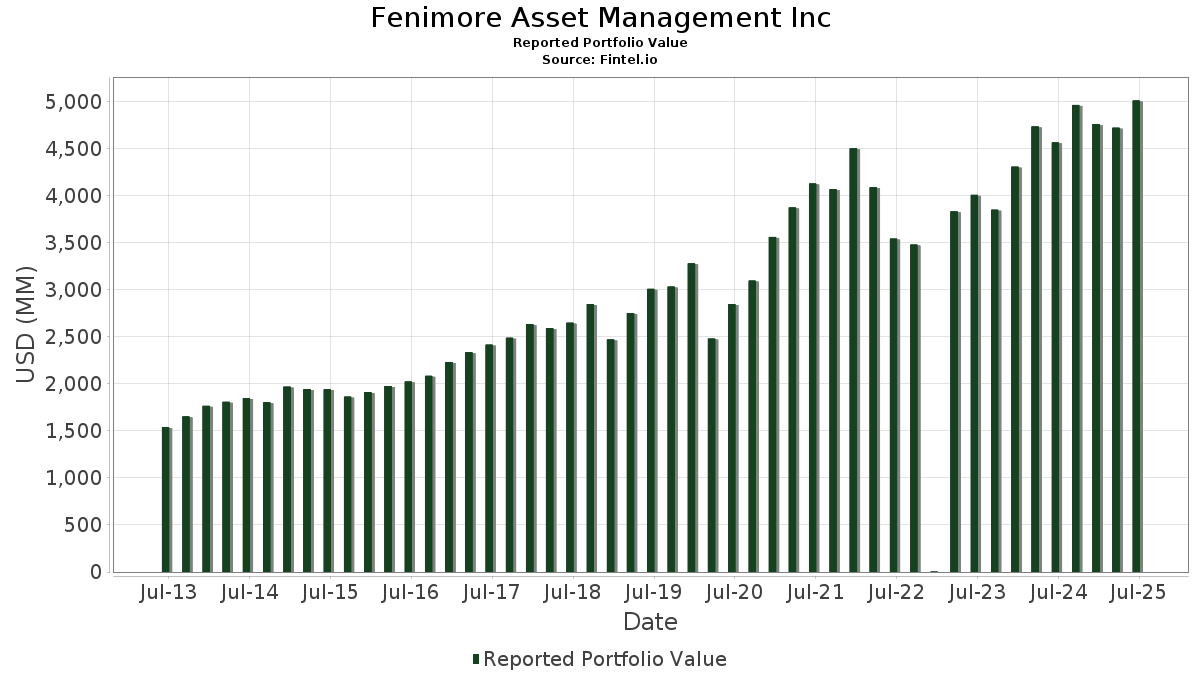
| Portfolio-Wert | $ 4.987.992.495 |
| Aktuelle Positionen | 91 |
Neueste Bestände, Performance, AUM (aus 13F, 13D)
Fenimore Asset Management Inc hat 91 Gesamtbeteiligungen in seinen letzten SEC-Einreichungen offengelegt. Der jüngste Portfoliowert wird auf $ 4.987.992.495 USD berechnet. Das tatsächliche verwaltete Vermögen (AUM) ist dieser Wert plus Barmittel (die nicht offengelegt werden). Fenimore Asset Management Incs Top-Bestände sind Amphenol Corporation (US:APH) , Ross Stores, Inc. (US:ROST) , Vulcan Materials Company (US:VMC) , Brown & Brown, Inc. (US:BRO) , and Stryker Corporation (US:SYK) . Fenimore Asset Management Incs neue Positionen sind Intuit Inc. (US:INTU) , .
Top-Zuwächse in diesem Quartal
Wir verwenden die Veränderung der Portfolioallokation, weil dies die aussagekräftigste Kennzahl ist. Die Änderungen können auf Trades oder Änderungen der Aktienkurse zurückzuführen sein.
| Wertpapier | Aktien (MM) |
Wert (MM$) |
Portfolio % | ΔPortfolio % |
|---|---|---|---|---|
| A / Agilent Technologies, Inc. | 0,59 | 75,28 | 1,5092 | 1,0832 |
| ROST / Ross Stores, Inc. | 1,61 | 244,63 | 4,9043 | 0,8176 |
| VMC / Vulcan Materials Company | 0,67 | 204,77 | 4,1053 | 0,6395 |
| APH / Amphenol Corporation | 2,05 | 253,72 | 5,0866 | 0,5787 |
| LSTR / Landstar System, Inc. | 0,34 | 41,81 | 0,8382 | 0,5525 |
| FAST / Fastenal Company | 3,75 | 183,96 | 3,6880 | 0,5468 |
| AZO / AutoZone, Inc. | 0,03 | 141,98 | 2,8465 | 0,3796 |
| BKFOF / Brookfield Corporation - Preferred Stock | 2,58 | 176,60 | 3,5405 | 0,3403 |
| CWST / Casella Waste Systems, Inc. | 0,11 | 10,84 | 0,2173 | 0,2173 |
| FSV / FirstService Corporation | 0,14 | 27,55 | 0,5523 | 0,2026 |
Top-Rückgänge in diesem Quartal
Wir verwenden die Veränderung der Portfolioallokation, weil dies die aussagekräftigste Kennzahl ist. Änderungen können auf Handelsgeschäfte oder Änderungen der Aktienkurse zurückzuführen sein.
| Wertpapier | Aktien (MM) |
Wert (MM$) |
Portfolio % | ΔPortfolio % |
|---|---|---|---|---|
| BRO / Brown & Brown, Inc. | 2,16 | 202,25 | 4,0548 | -0,6806 |
| PNFP / Pinnacle Financial Partners, Inc. | 0,95 | 88,89 | 1,7821 | -0,5909 |
| POOL / Pool Corporation | 0,00 | 0,43 | 0,0085 | -0,5442 |
| CDW / CDW Corporation | 1,14 | 181,75 | 3,6438 | -0,4065 |
| NOMD / Nomad Foods Limited | 0,00 | 0,00 | -0,3124 | |
| SYK / Stryker Corporation | 0,53 | 194,24 | 3,8941 | -0,2495 |
| PGR / The Progressive Corporation | 0,56 | 138,13 | 2,7692 | -0,2098 |
| IEX / IDEX Corporation | 0,87 | 142,36 | 2,8541 | -0,2035 |
| BROS / Dutch Bros Inc. | 0,35 | 18,29 | 0,3666 | -0,1839 |
| TT / Trane Technologies plc | 0,41 | 173,23 | 3,4729 | -0,1610 |
13F und Fondseinreichungen
Dieses Formular wurde am 2025-10-20 für den Berichtszeitraum eingereicht 2025-09-30. Klicken Sie auf das Link-Symbol , um den gesamten Transaktionsverlauf zu sehen.
Upgrade um die Prämiendaten zu entsperren und nach Excel zu exportieren ![]() .
.
| Wertpapier | Typ | Durchschnittlicher Aktienkurs | Aktien (MM) |
ΔAktien (%) |
Wert ($MM) |
ΔAktien (%) |
Portfolio (%) |
ΔPortfolio (%) |
|
|---|---|---|---|---|---|---|---|---|---|
| APH / Amphenol Corporation | 2,05 | -10,37 | 253,72 | 12,32 | 5,0866 | 0,5787 | |||
| ROST / Ross Stores, Inc. | 1,61 | 0,01 | 244,63 | 19,46 | 4,9043 | 0,8176 | |||
| VMC / Vulcan Materials Company | 0,67 | -0,03 | 204,77 | 17,91 | 4,1053 | 0,6395 | |||
| BRO / Brown & Brown, Inc. | 2,16 | 0,76 | 202,25 | -14,76 | 4,0548 | -0,6806 | |||
| SYK / Stryker Corporation | 0,53 | 0,12 | 194,24 | -6,45 | 3,8941 | -0,2495 | |||
| FAST / Fastenal Company | 3,75 | 0,09 | 183,96 | 16,87 | 3,6880 | 0,5468 | |||
| CDW / CDW Corporation | 1,14 | 0,41 | 181,75 | -10,45 | 3,6438 | -0,4065 | |||
| BKFOF / Brookfield Corporation - Preferred Stock | 2,58 | -0,68 | 176,60 | 10,13 | 3,5405 | 0,3403 | |||
| TT / Trane Technologies plc | 0,41 | -1,38 | 173,23 | -4,87 | 3,4729 | -0,1610 | |||
| MKL / Markel Group Inc. | 0,09 | -0,00 | 168,94 | -4,31 | 3,3870 | -0,1364 | |||
| IEX / IDEX Corporation | 0,87 | 0,23 | 142,36 | -7,08 | 2,8541 | -0,2035 | |||
| AZO / AutoZone, Inc. | 0,03 | -0,61 | 141,98 | 14,86 | 2,8465 | 0,3796 | |||
| PGR / The Progressive Corporation | 0,56 | -0,01 | 138,13 | -7,47 | 2,7692 | -0,2098 | |||
| EXLS / ExlService Holdings, Inc. | 2,79 | 0,68 | 122,84 | 1,23 | 2,4628 | 0,0410 | |||
| ADI / Analog Devices, Inc. | 0,50 | -0,00 | 121,94 | 3,22 | 2,4447 | 0,0871 | |||
| KEYS / Keysight Technologies, Inc. | 0,63 | 1,06 | 110,63 | 7,88 | 2,2178 | 0,1714 | |||
| HEIA / Heico Corp. - Class A | 0,43 | 1,63 | 110,45 | -0,20 | 2,2143 | 0,0058 | |||
| AJG / Arthur J. Gallagher & Co. | 0,36 | -0,29 | 110,05 | -3,53 | 2,2063 | -0,0702 | |||
| BKNG / Booking Holdings Inc. | 0,02 | 0,29 | 107,94 | -6,46 | 2,1640 | -0,1390 | |||
| ZBRA / Zebra Technologies Corporation | 0,35 | 0,65 | 105,17 | -3,01 | 2,1084 | -0,0554 | |||
| ITW / Illinois Tool Works Inc. | 0,40 | 0,54 | 103,17 | 6,03 | 2,0683 | 0,1265 | |||
| GGG / Graco Inc. | 1,10 | 0,39 | 93,70 | -0,79 | 1,8785 | -0,0063 | |||
| MCHP / Microchip Technology Incorporated | 1,43 | 1,82 | 91,54 | -7,08 | 1,8352 | -0,1308 | |||
| PNFP / Pinnacle Financial Partners, Inc. | 0,95 | -12,00 | 88,89 | -25,25 | 1,7821 | -0,5909 | |||
| STE / STERIS plc | 0,32 | 4,14 | 80,41 | 7,27 | 1,6121 | 0,1161 | |||
| BR / Broadridge Financial Solutions, Inc. | 0,32 | 0,71 | 75,93 | -1,30 | 1,5222 | -0,0130 | |||
| A / Agilent Technologies, Inc. | 0,59 | 224,25 | 75,28 | 252,67 | 1,5092 | 1,0832 | |||
| AME / AMETEK, Inc. | 0,37 | 1,40 | 69,09 | 5,34 | 1,3851 | 0,0762 | |||
| RSG / Republic Services, Inc. | 0,28 | 0,42 | 64,75 | -6,56 | 1,2980 | -0,0847 | |||
| CTAS / Cintas Corporation | 0,28 | 0,36 | 57,19 | -7,57 | 1,1466 | -0,0882 | |||
| MLM / Martin Marietta Materials, Inc. | 0,09 | 0,91 | 56,51 | 15,86 | 1,1329 | 0,1595 | |||
| PAYX / Paychex, Inc. | 0,42 | 0,10 | 53,63 | -12,77 | 1,0753 | -0,1518 | |||
| BAM / Brookfield Asset Management Ltd. | 0,94 | 0,62 | 53,31 | 3,65 | 1,0688 | 0,0423 | |||
| ENTG / Entegris, Inc. | 0,55 | -0,37 | 50,47 | 14,22 | 1,0119 | 0,1300 | |||
| EOG / EOG Resources, Inc. | 0,39 | 3,51 | 43,47 | -2,97 | 0,8714 | -0,0226 | |||
| LSTR / Landstar System, Inc. | 0,34 | 231,33 | 41,81 | 192,10 | 0,8382 | 0,5525 | |||
| BRK.A / Berkshire Hathaway Inc. | 0,00 | 0,00 | 39,22 | 3,49 | 0,7863 | 0,0299 | |||
| CIGI / Colliers International Group Inc. | 0,25 | -0,18 | 38,62 | 19,45 | 0,7742 | 0,1290 | |||
| JKHY / Jack Henry & Associates, Inc. | 0,24 | 1,74 | 35,26 | -15,90 | 0,7068 | -0,1298 | |||
| VRSK / Verisk Analytics, Inc. | 0,14 | 2,82 | 34,64 | -16,98 | 0,6945 | -0,1383 | |||
| WSO.B / Watsco, Inc. | 0,07 | 1,04 | 28,58 | -7,50 | 0,5731 | -0,0436 | |||
| FSV / FirstService Corporation | 0,14 | 44,11 | 27,55 | 57,21 | 0,5523 | 0,2026 | |||
| ROP / Roper Technologies, Inc. | 0,05 | 0,98 | 24,67 | -11,16 | 0,4946 | -0,0596 | |||
| CBZ / CBIZ, Inc. | 0,46 | 5,31 | 24,12 | -22,22 | 0,4835 | -0,1353 | |||
| BIPC / Brookfield Infrastructure Corporation | 0,57 | -0,12 | 23,29 | -1,28 | 0,4668 | -0,0039 | |||
| AVY / Avery Dennison Corporation | 0,14 | 0,02 | 23,23 | -7,56 | 0,4657 | -0,0358 | |||
| FTDR / Frontdoor, Inc. | 0,34 | 0,11 | 22,92 | 14,29 | 0,4595 | 0,0593 | |||
| HLI / Houlihan Lokey, Inc. | 0,11 | 2,16 | 21,86 | 16,56 | 0,4383 | 0,0640 | |||
| OSW / OneSpaWorld Holdings Limited | 0,94 | -0,01 | 19,78 | 3,67 | 0,3965 | 0,0158 | |||
| SITE / SiteOne Landscape Supply, Inc. | 0,15 | -0,19 | 19,70 | 6,29 | 0,3949 | 0,0251 | |||
| TRRSF / Trisura Group Ltd. | 0,69 | -0,18 | 19,04 | -16,32 | 0,3818 | -0,0724 | |||
| CHH / Choice Hotels International, Inc. | 0,18 | -0,28 | 19,02 | -15,98 | 0,3814 | -0,0705 | |||
| BROS / Dutch Bros Inc. | 0,35 | -13,41 | 18,29 | -33,71 | 0,3666 | -0,1839 | |||
| DFH / Dream Finders Homes, Inc. | 0,69 | 0,12 | 17,86 | 3,27 | 0,3581 | 0,0129 | |||
| CHE / Chemed Corporation | 0,04 | 28,33 | 16,67 | 18,01 | 0,3343 | 0,0523 | |||
| AIF / Altus Group Limited | 0,38 | 0,25 | 16,30 | 10,38 | 0,3268 | 0,0321 | |||
| EXPO / Exponent, Inc. | 0,23 | 18,27 | 15,74 | 10,00 | 0,3155 | 0,0300 | |||
| ESI / Element Solutions Inc | 0,62 | 0,09 | 15,68 | 11,23 | 0,3144 | 0,0330 | |||
| SPSC / SPS Commerce, Inc. | 0,15 | 17,79 | 15,19 | -9,87 | 0,3046 | -0,0318 | |||
| HOMB / Home Bancshares, Inc. (Conway, AR) | 0,51 | 0,35 | 14,54 | -0,21 | 0,2915 | 0,0007 | |||
| BWIN / The Baldwin Insurance Group, Inc. | 0,51 | 44,30 | 14,30 | -4,91 | 0,2868 | -0,0134 | |||
| GEHC / GE HealthCare Technologies Inc. | 0,19 | 49,74 | 14,06 | 51,82 | 0,2818 | 0,0970 | |||
| CASS / Cass Information Systems, Inc. | 0,34 | 0,30 | 13,39 | -9,21 | 0,2685 | -0,0259 | |||
| FELE / Franklin Electric Co., Inc. | 0,14 | 0,22 | 13,32 | 6,32 | 0,2671 | 0,0170 | |||
| FND / Floor & Decor Holdings, Inc. | 0,17 | 0,45 | 12,78 | -2,54 | 0,2563 | -0,0055 | |||
| BOC / Boston Omaha Corporation | 0,95 | -0,05 | 12,46 | -6,88 | 0,2498 | -0,0172 | |||
| DC2 / The Descartes Systems Group Inc. | 0,13 | 0,13 | 12,37 | -7,17 | 0,2481 | -0,0180 | |||
| ESAB / ESAB Corporation | 0,11 | 0,14 | 11,90 | -7,18 | 0,2386 | -0,0173 | |||
| CWST / Casella Waste Systems, Inc. | 0,11 | 10,84 | 0,2173 | 0,2173 | |||||
| BRK.B / Berkshire Hathaway Inc. | 0,01 | -6,72 | 7,16 | -3,46 | 0,1436 | -0,0045 | |||
| AAPL / Apple Inc. | 0,01 | 0,00 | 3,43 | 24,12 | 0,0688 | 0,0136 | |||
| VUG / Vanguard Index Funds - Vanguard Growth ETF | 0,01 | 0,00 | 3,16 | 9,39 | 0,0633 | 0,0057 | |||
| Invesco Large-Cap Growth / ETF (73935X609) | 0,02 | 2,13 | 0,0000 | ||||||
| ABBV / AbbVie Inc. | 0,01 | 0,00 | 1,73 | 24,73 | 0,0346 | 0,0070 | |||
| SPY / SPDR S&P 500 ETF | 0,00 | 0,00 | 0,98 | 7,79 | 0,0197 | 0,0015 | |||
| IVV / iShares Trust - iShares Core S&P 500 ETF | 0,00 | 0,00 | 0,80 | 7,79 | 0,0161 | 0,0012 | |||
| XLY / The Select Sector SPDR Trust - State Street Consumer Discretionary Select Sector SPDR ETF | 0,00 | 0,00 | 0,75 | 10,28 | 0,0151 | 0,0015 | |||
| IBM / International Business Machines Corporation | 0,00 | 0,00 | 0,73 | -4,35 | 0,0146 | -0,0006 | |||
| MSFT / Microsoft Corporation | 0,00 | 0,00 | 0,70 | 4,15 | 0,0141 | 0,0006 | |||
| NBTB / NBT Bancorp Inc. | 0,01 | 0,00 | 0,60 | 0,50 | 0,0121 | 0,0001 | |||
| RYAN / Ryan Specialty Holdings, Inc. | 0,01 | 0,60 | 0,0121 | 0,0121 | |||||
| POOL / Pool Corporation | 0,00 | -98,55 | 0,43 | -98,46 | 0,0085 | -0,5442 | |||
| CNMD / CONMED Corporation | 0,01 | -0,01 | 0,42 | -9,72 | 0,0084 | -0,0009 | |||
| XOM / Exxon Mobil Corporation | 0,00 | 0,00 | 0,38 | 4,40 | 0,0076 | 0,0004 | |||
| UNP / Union Pacific Corporation | 0,00 | 0,00 | 0,37 | 2,75 | 0,0075 | 0,0002 | |||
| USB / U.S. Bancorp | 0,01 | -0,01 | 0,35 | 6,95 | 0,0071 | 0,0005 | |||
| MSCI / MSCI Inc. | 0,00 | 0,00 | 0,32 | -1,52 | 0,0065 | -0,0001 | |||
| ZTS / Zoetis Inc. | 0,00 | 0,00 | 0,30 | -6,29 | 0,0060 | -0,0004 | |||
| MCO / Moody's Corporation | 0,00 | 0,00 | 0,28 | -4,73 | 0,0057 | -0,0003 | |||
| INTU / Intuit Inc. | 0,00 | 0,20 | 0,0041 | 0,0041 | |||||
| AXP / American Express Company | 0,00 | 0,20 | 0,0040 | 0,0040 | |||||
| COST / Costco Wholesale Corporation | 0,00 | -100,00 | 0,00 | 0,0000 | |||||
| WAT / Waters Corporation | 0,00 | -100,00 | 0,00 | 0,0000 | |||||
| NOMD / Nomad Foods Limited | 0,00 | -100,00 | 0,00 | -100,00 | -0,3124 |