Basisstatistiken
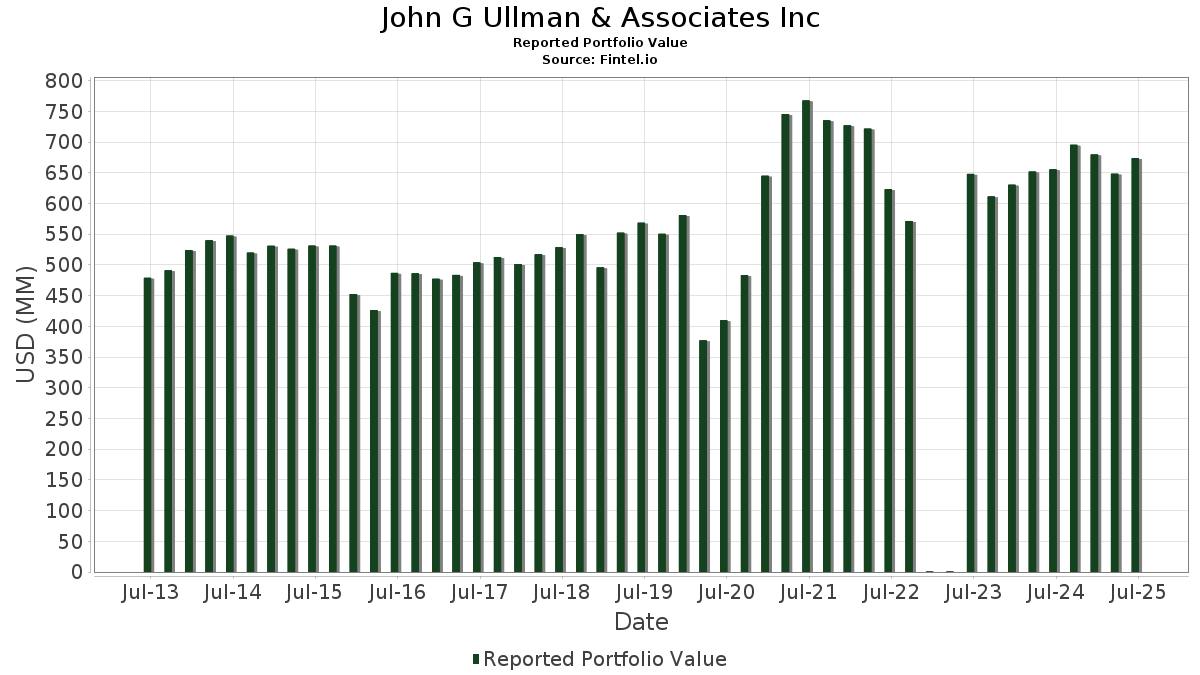
| Portfolio-Wert | $ 742.668.709 |
| Aktuelle Positionen | 173 |
Neueste Bestände, Performance, AUM (aus 13F, 13D)
John G Ullman & Associates Inc hat 173 Gesamtbeteiligungen in seinen letzten SEC-Einreichungen offengelegt. Der jüngste Portfoliowert wird auf $ 742.668.709 USD berechnet. Das tatsächliche verwaltete Vermögen (AUM) ist dieser Wert plus Barmittel (die nicht offengelegt werden). John G Ullman & Associates Incs Top-Bestände sind Taiwan Semiconductor Manufacturing Company Limited - Depositary Receipt (Common Stock) (US:TSM) , Emerson Electric Co. (US:EMR) , Corning Incorporated (US:GLW) , Broadcom Inc. (US:AVGO) , and OGE Energy Corp. (US:OGE) . John G Ullman & Associates Incs neue Positionen sind Adobe Inc. (US:ADBE) , Twilio Inc. (US:TWLO) , Haemonetics Corporation (DE:HAZ) , Fidelity Covington Trust - Fidelity Enhanced Small Cap ETF (US:FESM) , and GS Connect S&P GSCI Enhanced Commodity Total Return ETN (US:GSCE) .
Top-Zuwächse in diesem Quartal
Wir verwenden die Veränderung der Portfolioallokation, weil dies die aussagekräftigste Kennzahl ist. Die Änderungen können auf Trades oder Änderungen der Aktienkurse zurückzuführen sein.
| Wertpapier | Aktien (MM) |
Wert (MM$) |
Portfolio % | ΔPortfolio % |
|---|---|---|---|---|
| BE / Bloom Energy Corporation | 0,23 | 19,04 | 2,5642 | 1,5607 |
| NEE / NextEra Energy, Inc. | 0,16 | 11,83 | 1,5923 | 1,3147 |
| WTRG / Essential Utilities, Inc. | 0,46 | 18,55 | 2,4978 | 1,0316 |
| D / Dominion Energy, Inc. | 0,18 | 11,04 | 1,4866 | 0,6211 |
| ES / Eversource Energy | 0,16 | 11,59 | 1,5607 | 0,4966 |
| TSM / Taiwan Semiconductor Manufacturing Company Limited - Depositary Receipt (Common Stock) | 0,14 | 37,80 | 5,0894 | 0,4276 |
| TEL / TE Connectivity plc | 0,10 | 22,44 | 3,0216 | 0,4204 |
| EQT / EQT Corporation | 0,14 | 7,83 | 1,0543 | 0,3523 |
| WDC / Western Digital Corporation | 0,08 | 9,13 | 1,2296 | 0,3507 |
| ADBE / Adobe Inc. | 0,01 | 2,30 | 0,3092 | 0,3092 |
Top-Rückgänge in diesem Quartal
Wir verwenden die Veränderung der Portfolioallokation, weil dies die aussagekräftigste Kennzahl ist. Änderungen können auf Handelsgeschäfte oder Änderungen der Aktienkurse zurückzuführen sein.
| Wertpapier | Aktien (MM) |
Wert (MM$) |
Portfolio % | ΔPortfolio % |
|---|---|---|---|---|
| NVS / Novartis AG - Depositary Receipt (Common Stock) | 0,00 | 0,38 | 0,0515 | -2,4162 |
| IBM / International Business Machines Corporation | 0,07 | 19,19 | 2,5843 | -1,0352 |
| EMR / Emerson Electric Co. | 0,28 | 36,94 | 4,9740 | -0,6448 |
| HRI / Herc Holdings Inc. | 0,00 | 0,00 | -0,5879 | |
| GE / General Electric Company | 0,00 | 0,44 | 0,0588 | -0,4656 |
| CSCO / Cisco Systems, Inc. | 0,33 | 22,87 | 3,0790 | -0,3833 |
| XPRO / Expro Group Holdings N.V. | 0,04 | 4,90 | 0,6592 | -0,2820 |
| AMT / American Tower Corporation | 0,06 | 10,91 | 1,4688 | -0,2691 |
| DIS / The Walt Disney Company | 0,07 | 8,57 | 1,1539 | -0,2518 |
| AMZN / Amazon.com, Inc. | 0,07 | 14,95 | 2,0131 | -0,2270 |
13F und Fondseinreichungen
Dieses Formular wurde am 2025-11-05 für den Berichtszeitraum eingereicht 2025-09-30. Klicken Sie auf das Link-Symbol , um den gesamten Transaktionsverlauf zu sehen.
Upgrade um die Prämiendaten zu entsperren und nach Excel zu exportieren ![]() .
.
| Wertpapier | Typ | Durchschnittlicher Aktienkurs | Aktien (MM) |
ΔAktien (%) |
Wert ($MM) |
ΔAktien (%) |
Portfolio (%) |
ΔPortfolio (%) |
|
|---|---|---|---|---|---|---|---|---|---|
| TSM / Taiwan Semiconductor Manufacturing Company Limited - Depositary Receipt (Common Stock) | 0,14 | -2,42 | 37,80 | 20,33 | 5,0894 | 0,4276 | |||
| EMR / Emerson Electric Co. | 0,28 | -0,83 | 36,94 | -2,43 | 4,9740 | -0,6448 | |||
| GLW / Corning Incorporated | 0,41 | -26,97 | 33,56 | 13,92 | 4,5194 | 0,1468 | |||
| AVGO / Broadcom Inc. | 0,08 | -6,39 | 27,03 | 12,03 | 3,6391 | 0,0590 | |||
| OGE / OGE Energy Corp. | 0,51 | -1,21 | 23,52 | 3,00 | 3,1665 | -0,2220 | |||
| CSCO / Cisco Systems, Inc. | 0,33 | -0,61 | 22,87 | -1,99 | 3,0790 | -0,3833 | |||
| TEL / TE Connectivity plc | 0,10 | -1,63 | 22,44 | 28,03 | 3,0216 | 0,4204 | |||
| IBM / International Business Machines Corporation | 0,07 | -17,79 | 19,19 | -21,31 | 2,5843 | -1,0352 | |||
| BE / Bloom Energy Corporation | 0,23 | -20,35 | 19,04 | 181,62 | 2,5642 | 1,5607 | |||
| WTRG / Essential Utilities, Inc. | 0,46 | 74,78 | 18,55 | 87,77 | 2,4978 | 1,0316 | |||
| MSFT / Microsoft Corporation | 0,03 | -0,59 | 16,55 | 3,51 | 2,2289 | -0,1443 | |||
| AMZN / Amazon.com, Inc. | 0,07 | -1,03 | 14,95 | -0,95 | 2,0131 | -0,2270 | |||
| XOM / Exxon Mobil Corporation | 0,11 | -0,24 | 12,04 | 4,34 | 1,6212 | -0,0912 | |||
| NEE / NextEra Energy, Inc. | 0,16 | 481,34 | 11,83 | 532,35 | 1,5923 | 1,3147 | |||
| ES / Eversource Energy | 0,16 | 44,56 | 11,59 | 61,65 | 1,5607 | 0,4966 | |||
| D / Dominion Energy, Inc. | 0,18 | 74,92 | 11,04 | 89,33 | 1,4866 | 0,6211 | |||
| AMT / American Tower Corporation | 0,06 | 7,05 | 10,91 | -6,85 | 1,4688 | -0,2691 | |||
| CACI / CACI International Inc | 0,02 | -1,65 | 9,93 | 2,91 | 1,3364 | -0,0949 | |||
| GNRC / Generac Holdings Inc. | 0,06 | -0,73 | 9,69 | 16,04 | 1,3045 | 0,0654 | |||
| POR / Portland General Electric Company | 0,22 | 18,23 | 9,67 | 28,04 | 1,3024 | 0,1813 | |||
| SLB / SLB N.V. | 0,28 | 0,34 | 9,46 | 2,03 | 1,2732 | -0,1021 | |||
| WDC / Western Digital Corporation | 0,08 | -17,81 | 9,13 | 54,21 | 1,2296 | 0,3507 | |||
| ASTE / Astec Industries, Inc. | 0,18 | -2,02 | 8,68 | 13,12 | 1,1683 | 0,0299 | |||
| DIS / The Walt Disney Company | 0,07 | -2,01 | 8,57 | -9,52 | 1,1539 | -0,2518 | |||
| GVA / Granite Construction Incorporated | 0,08 | -2,08 | 8,51 | 14,83 | 1,1462 | 0,0459 | |||
| MRKCL / Merck & Co., Inc. | 0,10 | 4,66 | 8,28 | 10,97 | 1,1155 | 0,0075 | |||
| LNN / Lindsay Corporation | 0,06 | -0,36 | 8,15 | -2,92 | 1,0973 | -0,1484 | |||
| EQT / EQT Corporation | 0,14 | 77,37 | 7,83 | 65,55 | 1,0543 | 0,3523 | |||
| VMC / Vulcan Materials Company | 0,03 | -1,65 | 7,80 | 16,01 | 1,0500 | 0,0523 | |||
| FLS / Flowserve Corporation | 0,14 | -1,64 | 7,50 | -0,16 | 1,0100 | -0,1049 | |||
| ITRI / Itron, Inc. | 0,06 | -0,83 | 7,23 | -6,14 | 0,9729 | -0,1697 | |||
| MDU / MDU Resources Group, Inc. | 0,39 | -0,65 | 6,98 | 6,15 | 0,9394 | -0,0361 | |||
| ECG / Everus Construction Group, Inc. | 0,08 | -10,53 | 6,94 | 20,78 | 0,9346 | 0,0816 | |||
| BMY / Bristol-Myers Squibb Company | 0,15 | -1,64 | 6,86 | -4,16 | 0,9237 | -0,1387 | |||
| HON / Honeywell International Inc. | 0,03 | -0,75 | 6,31 | -10,29 | 0,8492 | -0,1941 | |||
| LITE / Lumentum Holdings Inc. | 0,04 | -25,03 | 6,13 | 28,33 | 0,8254 | 0,1165 | |||
| INTC / Intel Corporation | 0,18 | 0,31 | 6,10 | 50,22 | 0,8213 | 0,2188 | |||
| TMO / Thermo Fisher Scientific Inc. | 0,01 | 4,10 | 5,86 | 24,51 | 0,7896 | 0,0907 | |||
| NJR / New Jersey Resources Corporation | 0,12 | -1,09 | 5,83 | 6,26 | 0,7844 | -0,0292 | |||
| SYY / Sysco Corporation | 0,07 | -2,85 | 5,78 | 5,61 | 0,7785 | -0,0339 | |||
| EXP / Eagle Materials Inc. | 0,02 | 55,31 | 5,71 | 79,08 | 0,7688 | 0,2956 | |||
| TMP / Tompkins Financial Corporation | 0,08 | -1,92 | 5,62 | 3,52 | 0,7564 | -0,0489 | |||
| NXST / Nexstar Media Group, Inc. | 0,03 | -0,43 | 5,43 | 13,83 | 0,7315 | 0,0233 | |||
| GOOGL / Alphabet Inc. | 0,02 | -1,70 | 5,43 | 35,62 | 0,7307 | 0,1368 | |||
| VNM / VanEck ETF Trust - VanEck Vietnam ETF | 0,30 | -4,68 | 5,35 | 23,69 | 0,7199 | 0,0783 | |||
| GRC / The Gorman-Rupp Company | 0,11 | 2,82 | 5,33 | 29,95 | 0,7182 | 0,1090 | |||
| LOW / Lowe's Companies, Inc. | 0,02 | -1,58 | 5,08 | 11,49 | 0,6846 | 0,0077 | |||
| IDA / IDACORP, Inc. | 0,04 | -3,13 | 5,07 | 10,89 | 0,6829 | 0,0041 | |||
| STT / State Street Corporation | 0,04 | -0,93 | 4,94 | 8,09 | 0,6653 | -0,0132 | |||
| XPRO / Expro Group Holdings N.V. | 0,04 | 3,23 | 4,90 | -22,80 | 0,6592 | -0,2820 | |||
| JAZZ / Jazz Pharmaceuticals plc | 0,04 | -1,49 | 4,66 | 22,36 | 0,6278 | 0,0622 | |||
| SNOW / Snowflake Inc. | 0,02 | -0,29 | 4,53 | 0,49 | 0,6094 | -0,0589 | |||
| KNF / Knife River Corporation | 0,06 | -0,09 | 4,45 | -5,91 | 0,5997 | -0,1029 | |||
| ORCL / Oracle Corporation | 0,02 | -24,38 | 4,39 | -2,72 | 0,5915 | -0,0787 | |||
| AAPL / Apple Inc. | 0,02 | -0,73 | 4,34 | 23,21 | 0,5848 | 0,0616 | |||
| EA / Electronic Arts Inc. | 0,02 | -8,92 | 4,27 | 15,00 | 0,5751 | 0,0240 | |||
| VOO / Vanguard Index Funds - Vanguard S&P 500 ETF | 0,01 | -1,24 | 4,19 | 6,46 | 0,5638 | -0,0199 | |||
| GOOG / Alphabet Inc. | 0,02 | 11,83 | 4,13 | 53,53 | 0,5566 | 0,1570 | |||
| COHR / Coherent Corp. | 0,04 | -22,68 | 4,07 | -6,64 | 0,5475 | -0,0989 | |||
| ABT / Abbott Laboratories | 0,03 | 0,67 | 4,05 | -0,86 | 0,5453 | -0,0610 | |||
| PFE / Pfizer Inc. | 0,15 | 1,26 | 3,89 | 6,43 | 0,5235 | -0,0186 | |||
| GEHC / GE HealthCare Technologies Inc. | 0,05 | -7,18 | 3,61 | -5,87 | 0,4861 | -0,0832 | |||
| EHC / Encompass Health Corporation | 0,03 | -1,05 | 3,59 | 2,48 | 0,4840 | -0,0365 | |||
| GSK / GSK plc - Depositary Receipt (Common Stock) | 0,08 | -1,39 | 3,49 | 10,85 | 0,4705 | 0,0026 | |||
| WTS / Watts Water Technologies, Inc. | 0,01 | -2,31 | 3,27 | 10,93 | 0,4400 | 0,0029 | |||
| BKH / Black Hills Corporation | 0,05 | -1,23 | 3,22 | 8,45 | 0,4337 | -0,0071 | |||
| PEG / Public Service Enterprise Group Incorporated | 0,04 | -2,30 | 3,19 | -3,13 | 0,4295 | -0,0592 | |||
| SNDK / Sandisk Corporation | 0,03 | -6,01 | 3,16 | 132,50 | 0,4259 | 0,2240 | |||
| UTHR / United Therapeutics Corporation | 0,01 | -2,76 | 2,97 | 41,87 | 0,3996 | 0,0891 | |||
| BCE / BCE Inc. | 0,13 | 19,39 | 2,93 | 26,00 | 0,3941 | 0,0493 | |||
| CRM / Salesforce, Inc. | 0,01 | -8,24 | 2,89 | -20,26 | 0,3885 | -0,1485 | |||
| PYPL / PayPal Holdings, Inc. | 0,04 | -4,24 | 2,65 | -13,60 | 0,3569 | -0,0984 | |||
| VNT / Vontier Corporation | 0,06 | -0,81 | 2,58 | 12,83 | 0,3471 | 0,0080 | |||
| AMGN / Amgen Inc. | 0,01 | -0,78 | 2,54 | 0,28 | 0,3420 | -0,0339 | |||
| CCK / Crown Holdings, Inc. | 0,03 | -1,16 | 2,49 | -7,27 | 0,3348 | -0,0632 | |||
| SO / The Southern Company | 0,03 | -0,43 | 2,46 | 2,75 | 0,3315 | -0,0241 | |||
| CIEN / Ciena Corporation | 0,02 | 0,00 | 2,43 | 79,09 | 0,3276 | 0,1260 | |||
| ADBE / Adobe Inc. | 0,01 | 2,30 | 0,3092 | 0,3092 | |||||
| GEV / GE Vernova Inc. | 0,00 | -0,68 | 2,24 | 15,43 | 0,3013 | 0,0136 | |||
| ZBH / Zimmer Biomet Holdings, Inc. | 0,02 | -12,19 | 2,24 | -5,18 | 0,3011 | -0,0488 | |||
| A / Agilent Technologies, Inc. | 0,02 | 0,00 | 2,19 | 8,73 | 0,2951 | -0,0040 | |||
| LLY / Eli Lilly and Company | 0,00 | -1,42 | 2,17 | -3,52 | 0,2920 | -0,0416 | |||
| SOLV / Solventum Corporation | 0,03 | -2,11 | 2,04 | -5,78 | 0,2742 | -0,0466 | |||
| EQNR / Equinor ASA - Depositary Receipt (Common Stock) | 0,08 | 6,29 | 1,98 | 3,07 | 0,2664 | -0,0185 | |||
| TWLO / Twilio Inc. | 0,02 | 1,98 | 0,2661 | 0,2661 | |||||
| HAL / Halliburton Company | 0,08 | 25,11 | 1,96 | 51,00 | 0,2640 | 0,0713 | |||
| SKBSY / Skanska AB (publ) - Depositary Receipt (Common Stock) | 0,07 | -1,67 | 1,89 | 10,42 | 0,2541 | 0,0003 | |||
| OTTR / Otter Tail Corporation | 0,02 | 29,47 | 1,69 | 37,67 | 0,2279 | 0,0454 | |||
| WBS / Webster Financial Corporation | 0,03 | -1,70 | 1,66 | 7,05 | 0,2229 | -0,0067 | |||
| AZTA / Azenta, Inc. | 0,05 | 8,17 | 1,51 | 0,94 | 0,2035 | -0,0187 | |||
| VERSX / Vanguard Emerging Markets Stock Index Fund | 0,03 | -0,40 | 1,37 | 9,11 | 0,1838 | -0,0019 | |||
| BAX / Baxter International Inc. | 0,05 | -25,41 | 1,20 | -43,89 | 0,1620 | -0,1563 | |||
| AGX / Argan, Inc. | 0,00 | 0,00 | 1,11 | 22,59 | 0,1491 | 0,0149 | |||
| REGN / Regeneron Pharmaceuticals, Inc. | 0,00 | 39,15 | 1,10 | 49,12 | 0,1480 | 0,0385 | |||
| H / Hydro One Limited | 0,03 | 0,00 | 1,06 | 0,28 | 0,1426 | -0,0141 | |||
| CVX / Chevron Corporation | 0,01 | -0,90 | 1,00 | 7,45 | 0,1341 | -0,0034 | |||
| EBMT / Eagle Bancorp Montana, Inc. | 0,06 | -2,35 | 0,99 | 1,13 | 0,1329 | -0,0119 | |||
| BRK.B / Berkshire Hathaway Inc. | 0,00 | 0,00 | 0,94 | 3,51 | 0,1272 | -0,0083 | |||
| JCI / Johnson Controls International plc | 0,01 | 8,58 | 0,90 | 13,14 | 0,1218 | 0,0030 | |||
| WSBF / Waterstone Financial, Inc. | 0,06 | 10,56 | 0,88 | 24,96 | 0,1187 | 0,0139 | |||
| BDX / Becton, Dickinson and Company | 0,00 | 9,65 | 0,85 | 19,15 | 0,1140 | 0,0085 | |||
| CEG / Constellation Energy Corporation | 0,00 | 0,00 | 0,81 | 2,01 | 0,1092 | -0,0089 | |||
| SHEL / Shell plc - Depositary Receipt (Common Stock) | 0,01 | 0,00 | 0,79 | 1,54 | 0,1069 | -0,0091 | |||
| DUK / Duke Energy Corporation | 0,01 | -6,28 | 0,79 | -1,74 | 0,1067 | -0,0130 | |||
| GILD / Gilead Sciences, Inc. | 0,01 | -0,34 | 0,78 | -0,26 | 0,1045 | -0,0109 | |||
| RBB / RBB Bancorp | 0,04 | -2,16 | 0,77 | 6,69 | 0,1032 | -0,0035 | |||
| LNT / Alliant Energy Corporation | 0,01 | 0,00 | 0,76 | 11,42 | 0,1026 | 0,0012 | |||
| EMA / Emera Incorporated | 0,02 | 0,00 | 0,76 | 4,70 | 0,1020 | -0,0053 | |||
| BP / BP p.l.c. - Depositary Receipt (Common Stock) | 0,02 | 0,23 | 0,76 | 15,42 | 0,1018 | 0,0046 | |||
| AOS / A. O. Smith Corporation | 0,01 | 5,43 | 0,71 | 18,08 | 0,0959 | 0,0064 | |||
| MTSI / MACOM Technology Solutions Holdings, Inc. | 0,01 | 0,00 | 0,71 | -13,11 | 0,0955 | -0,0257 | |||
| APTV / Aptiv PLC | 0,01 | 45,54 | 0,70 | 83,77 | 0,0946 | 0,0379 | |||
| ACVA / ACV Auctions Inc. | 0,07 | 0,00 | 0,66 | -38,98 | 0,0884 | -0,0711 | |||
| TYG / Tortoise Energy Infrastructure Corporation | 0,02 | 0,00 | 0,66 | -1,80 | 0,0884 | -0,0108 | |||
| TXN / Texas Instruments Incorporated | 0,00 | -2,95 | 0,64 | -14,08 | 0,0864 | -0,0245 | |||
| LH / Labcorp Holdings Inc. | 0,00 | -4,33 | 0,63 | 4,62 | 0,0854 | -0,0046 | |||
| XLU / The Select Sector SPDR Trust - State Street Utilities Select Sector SPDR ETF | 0,01 | 0,00 | 0,62 | 6,77 | 0,0829 | -0,0027 | |||
| MRNA / Moderna, Inc. | 0,02 | 47,52 | 0,61 | 38,06 | 0,0826 | 0,0167 | |||
| ILMN / Illumina, Inc. | 0,01 | 57,32 | 0,61 | 56,52 | 0,0825 | 0,0244 | |||
| MMM / 3M Company | 0,00 | 5,41 | 0,61 | 7,46 | 0,0815 | -0,0021 | |||
| HAZ / Haemonetics Corporation | 0,01 | 0,58 | 0,0784 | 0,0784 | |||||
| ITW / Illinois Tool Works Inc. | 0,00 | 0,00 | 0,57 | 5,52 | 0,0772 | -0,0035 | |||
| TDC / Teradata Corporation | 0,03 | 73,51 | 0,56 | 67,56 | 0,0759 | 0,0259 | |||
| BUSE / First Busey Corporation | 0,02 | -1,64 | 0,53 | -0,56 | 0,0714 | -0,0077 | |||
| PSX / Phillips 66 | 0,00 | 0,00 | 0,52 | 13,94 | 0,0705 | 0,0023 | |||
| FELE / Franklin Electric Co., Inc. | 0,01 | 0,00 | 0,51 | 6,20 | 0,0692 | -0,0027 | |||
| MU / Micron Technology, Inc. | 0,00 | 7,24 | 0,50 | 45,59 | 0,0668 | 0,0162 | |||
| CRUS / Cirrus Logic, Inc. | 0,00 | 0,00 | 0,49 | 20,20 | 0,0658 | 0,0055 | |||
| OCFC / OceanFirst Financial Corp. | 0,03 | -0,74 | 0,47 | -0,84 | 0,0639 | -0,0072 | |||
| AGCO / AGCO Corporation | 0,00 | 0,00 | 0,46 | 3,84 | 0,0620 | -0,0038 | |||
| VTI / Vanguard Index Funds - Vanguard Total Stock Market ETF | 0,00 | 0,00 | 0,44 | 8,03 | 0,0598 | -0,0012 | |||
| GE / General Electric Company | 0,00 | -89,42 | 0,44 | -87,66 | 0,0588 | -0,4656 | |||
| PANW / Palo Alto Networks, Inc. | 0,00 | -7,71 | 0,42 | -8,24 | 0,0571 | -0,0114 | |||
| XYL / Xylem Inc. | 0,00 | 9,69 | 0,42 | 25,23 | 0,0562 | 0,0067 | |||
| KO / The Coca-Cola Company | 0,01 | 13,29 | 0,41 | 6,19 | 0,0556 | -0,0021 | |||
| ITT / ITT Inc. | 0,00 | 0,00 | 0,41 | 14,21 | 0,0552 | 0,0018 | |||
| AQN / Algonquin Power & Utilities Corp. | 0,07 | 32,53 | 0,40 | 24,30 | 0,0538 | 0,0061 | |||
| SHW / The Sherwin-Williams Company | 0,00 | 0,00 | 0,40 | 1,02 | 0,0536 | -0,0050 | |||
| NVS / Novartis AG - Depositary Receipt (Common Stock) | 0,00 | -97,83 | 0,38 | -97,70 | 0,0515 | -2,4162 | |||
| AEP / American Electric Power Company, Inc. | 0,00 | -2,28 | 0,38 | 6,13 | 0,0514 | -0,0021 | |||
| IQV / IQVIA Holdings Inc. | 0,00 | 0,00 | 0,36 | 20,40 | 0,0486 | 0,0042 | |||
| NTIOF / National Bank of Canada | 0,00 | 0,00 | 0,35 | 2,92 | 0,0476 | -0,0033 | |||
| EEMV / iShares, Inc. - iShares MSCI Emerging Markets Min Vol Factor ETF | 0,01 | -0,93 | 0,34 | 0,90 | 0,0456 | -0,0043 | |||
| VGT / Vanguard World Fund - Vanguard Information Technology ETF | 0,00 | 0,00 | 0,33 | 12,54 | 0,0447 | 0,0009 | |||
| TPC / Tutor Perini Corporation | 0,01 | 0,00 | 0,33 | 40,34 | 0,0442 | 0,0094 | |||
| ETN / Eaton Corporation plc | 0,00 | 0,00 | 0,32 | 4,85 | 0,0437 | -0,0022 | |||
| GABC / German American Bancorp, Inc. | 0,01 | 0,00 | 0,32 | 1,90 | 0,0433 | -0,0035 | |||
| NWFL / Norwood Financial Corp. | 0,01 | -7,35 | 0,32 | -8,57 | 0,0431 | -0,0089 | |||
| STX / Seagate Technology Holdings plc | 0,00 | 0,32 | 0,0425 | 0,0425 | |||||
| GM / General Motors Company | 0,01 | 0,00 | 0,31 | 23,79 | 0,0415 | 0,0046 | |||
| XRAY / DENTSPLY SIRONA Inc. | 0,02 | 50,00 | 0,30 | 20,00 | 0,0405 | 0,0033 | |||
| CRH ADR REPSG 1 ORD / ADR (12626K203) | 0,00 | 0,30 | 0,0000 | ||||||
| PHO / Invesco Exchange-Traded Fund Trust - Invesco Water Resources ETF | 0,00 | 0,00 | 0,28 | 2,92 | 0,0381 | -0,0026 | |||
| WEC / WEC Energy Group, Inc. | 0,00 | 0,00 | 0,28 | 10,16 | 0,0380 | -0,0001 | |||
| KRE / SPDR Series Trust - State Street SPDR S&P Regional Banking ETF | 0,00 | 0,00 | 0,27 | 6,67 | 0,0367 | -0,0012 | |||
| FE / FirstEnergy Corp. | 0,01 | 0,00 | 0,25 | 13,82 | 0,0333 | 0,0011 | |||
| IBB / iShares Trust - iShares Biotechnology ETF | 0,00 | 0,00 | 0,25 | 13,95 | 0,0330 | 0,0011 | |||
| ROP / Roper Technologies, Inc. | 0,00 | 0,00 | 0,24 | -11,91 | 0,0329 | -0,0083 | |||
| ABBV / AbbVie Inc. | 0,00 | 0,24 | 0,0329 | 0,0329 | |||||
| META / Meta Platforms, Inc. | 0,00 | 0,00 | 0,23 | -0,43 | 0,0311 | -0,0034 | |||
| QQQ / Invesco QQQ Trust, Series 1 | 0,00 | 0,00 | 0,23 | 8,61 | 0,0306 | -0,0004 | |||
| RHHBY / Roche Holding AG - Depositary Receipt (Common Stock) | 0,01 | 0,00 | 0,22 | 2,31 | 0,0298 | -0,0022 | |||
| FESM / Fidelity Covington Trust - Fidelity Enhanced Small Cap ETF | 0,01 | 0,21 | 0,0288 | 0,0288 | |||||
| DGX / Quest Diagnostics Incorporated | 0,00 | 0,00 | 0,21 | 6,00 | 0,0286 | -0,0011 | |||
| GSCE / GS Connect S&P GSCI Enhanced Commodity Total Return ETN | 0,00 | 0,21 | 0,0284 | 0,0284 | |||||
| RSP / Invesco Exchange-Traded Fund Trust - Invesco S&P 500 Equal Weight ETF | 0,00 | 0,00 | 0,21 | 4,48 | 0,0283 | -0,0016 | |||
| MXF / The Mexico Fund, Inc. | 0,01 | 0,00 | 0,21 | 11,83 | 0,0281 | 0,0005 | |||
| VZ / Verizon Communications Inc. | 0,00 | -2,07 | 0,21 | -0,96 | 0,0280 | -0,0030 | |||
| AVTR / Avantor, Inc. | 0,02 | 42,98 | 0,20 | 32,68 | 0,0274 | 0,0046 | |||
| VTV / Vanguard Index Funds - Vanguard Value ETF | 0,00 | 0,20 | 0,0274 | 0,0274 | |||||
| ASRV / AmeriServ Financial, Inc. | 0,07 | -3,04 | 0,19 | -7,35 | 0,0255 | -0,0049 | |||
| GT / The Goodyear Tire & Rubber Company | 0,02 | 1,67 | 0,14 | -26,88 | 0,0184 | -0,0093 | |||
| AVL / Avalon Advanced Materials Inc. | 0,02 | 0,00 | 0,00 | 0,0001 | 0,0000 | ||||
| MPC / Marathon Petroleum Corporation | 0,00 | -100,00 | 0,00 | 0,0000 | |||||
| BCV / Bancroft Fund Ltd. | 0,00 | -100,00 | 0,00 | 0,0000 | |||||
| ACM / AECOM | 0,00 | -100,00 | 0,00 | 0,0000 | |||||
| FLR / Fluor Corporation | 0,00 | -100,00 | 0,00 | 0,0000 | |||||
| APH / Amphenol Corporation | 0,00 | -100,00 | 0,00 | 0,0000 | |||||
| HRI / Herc Holdings Inc. | 0,00 | -100,00 | 0,00 | -100,00 | -0,5879 | ||||
| BSX / Boston Scientific Corporation | 0,00 | -100,00 | 0,00 | 0,0000 | |||||
| PM / Philip Morris International Inc. | 0,00 | -100,00 | 0,00 | 0,0000 | |||||
| MOS / The Mosaic Company | 0,00 | -100,00 | 0,00 | -100,00 | -0,0311 |