Basisstatistiken
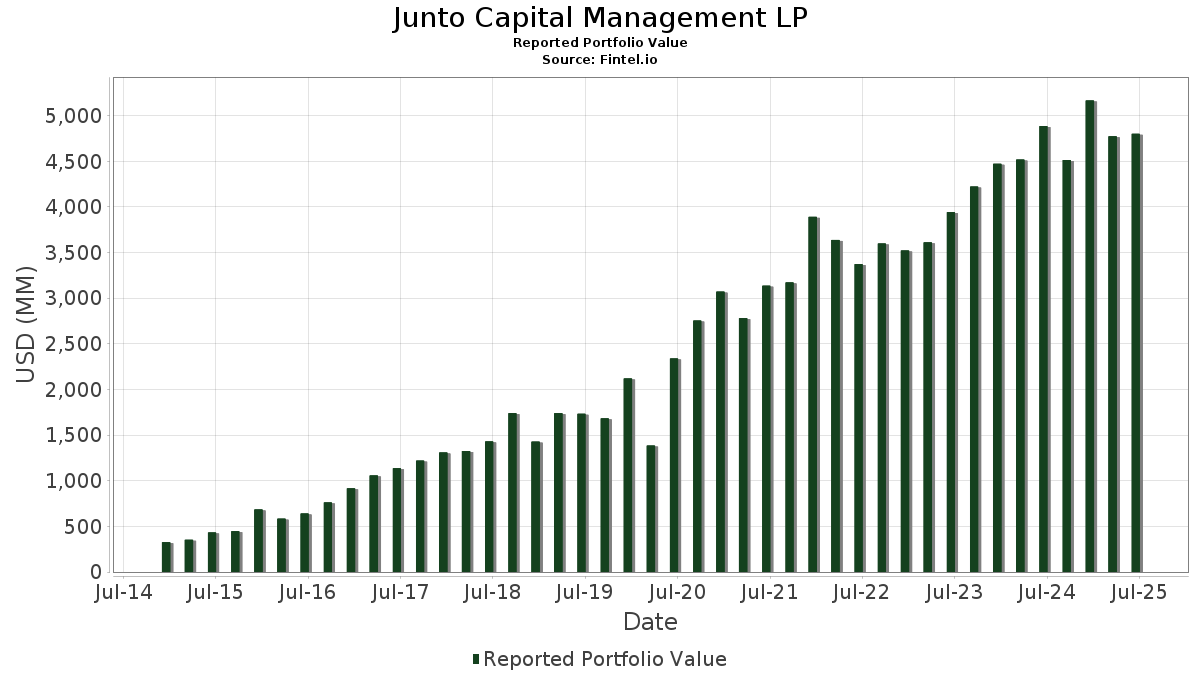
| Portfolio-Wert | $ 4.539.677.862 |
| Aktuelle Positionen | 70 |
Neueste Bestände, Performance, AUM (aus 13F, 13D)
Junto Capital Management LP hat 70 Gesamtbeteiligungen in seinen letzten SEC-Einreichungen offengelegt. Der jüngste Portfoliowert wird auf $ 4.539.677.862 USD berechnet. Das tatsächliche verwaltete Vermögen (AUM) ist dieser Wert plus Barmittel (die nicht offengelegt werden). Junto Capital Management LPs Top-Bestände sind BlackRock, Inc. (US:BLK) , Morgan Stanley (US:MS) , Ross Stores, Inc. (US:ROST) , CSX Corporation (US:CSX) , and Visa Inc. (US:V) . Junto Capital Management LPs neue Positionen sind FedEx Corporation (US:FDX) , F5, Inc. (US:FFIV) , Q2 Holdings, Inc. (US:QTWO) , Hyatt Hotels Corporation (US:H) , and Saia, Inc. (US:SAIA) .
Top-Zuwächse in diesem Quartal
Wir verwenden die Veränderung der Portfolioallokation, weil dies die aussagekräftigste Kennzahl ist. Die Änderungen können auf Trades oder Änderungen der Aktienkurse zurückzuführen sein.
| Wertpapier | Aktien (MM) |
Wert (MM$) |
Portfolio % | ΔPortfolio % |
|---|---|---|---|---|
| EFX / Equifax Inc. | 0,65 | 140,07 | 3,0854 | 3,0854 |
| FDX / FedEx Corporation | 0,45 | 130,15 | 2,8669 | 2,8669 |
| GWW / W.W. Grainger, Inc. | 0,12 | 122,18 | 2,6913 | 2,6913 |
| ICE / Intercontinental Exchange, Inc. | 0,71 | 115,28 | 2,5394 | 2,5394 |
| JKHY / Jack Henry & Associates, Inc. | 0,46 | 83,64 | 1,8424 | 1,8424 |
| OMC / Omnicom Group Inc. | 1,01 | 81,60 | 1,7974 | 1,7974 |
| BLK / BlackRock, Inc. | 0,23 | 251,05 | 5,5302 | 1,7849 |
| ACN / Accenture plc | 0,29 | 78,06 | 1,7196 | 1,7196 |
| PANW / Palo Alto Networks, Inc. | 0,42 | 76,87 | 1,6932 | 1,6932 |
| LII / Lennox International Inc. | 0,16 | 76,74 | 1,6905 | 1,6905 |
Top-Rückgänge in diesem Quartal
Wir verwenden die Veränderung der Portfolioallokation, weil dies die aussagekräftigste Kennzahl ist. Änderungen können auf Handelsgeschäfte oder Änderungen der Aktienkurse zurückzuführen sein.
| Wertpapier | Aktien (MM) |
Wert (MM$) |
Portfolio % | ΔPortfolio % |
|---|---|---|---|---|
| CCL / Carnival Corporation & plc | 0,00 | 0,00 | -1,6595 | |
| LPLA / LPL Financial Holdings Inc. | 0,13 | 47,80 | 1,0529 | -1,3401 |
| HBAN / Huntington Bancshares Incorporated | 1,53 | 26,57 | 0,5852 | -1,1697 |
| CHWY / Chewy, Inc. | 0,00 | 0,00 | -0,7080 | |
| AS / Amer Sports, Inc. | 1,31 | 49,10 | 1,0815 | -0,6485 |
| PLNT / Planet Fitness, Inc. | 0,36 | 39,24 | 0,8643 | -0,6431 |
| YUM / Yum! Brands, Inc. | 0,63 | 95,81 | 2,1105 | -0,6185 |
| BKNG / Booking Holdings Inc. | 0,01 | 56,71 | 1,2492 | -0,3965 |
| CRM / Salesforce, Inc. | 0,14 | 36,64 | 0,8071 | -0,3657 |
| DKS / DICK'S Sporting Goods, Inc. | 0,06 | 11,24 | 0,2476 | -0,3371 |
13F und Fondseinreichungen
Dieses Formular wurde am 2026-02-17 für den Berichtszeitraum eingereicht 2025-12-31. Klicken Sie auf das Link-Symbol , um den gesamten Transaktionsverlauf zu sehen.
Upgrade um die Prämiendaten zu entsperren und nach Excel zu exportieren ![]() .
.
| Wertpapier | Typ | Durchschnittlicher Aktienkurs | Aktien (MM) |
ΔAktien (%) |
Wert ($MM) |
ΔWert (%) |
Portfolio (%) |
ΔPortfolio (%) |
|
|---|---|---|---|---|---|---|---|---|---|
| BLK / BlackRock, Inc. | 0,23 | 49,54 | 251,05 | 37,28 | 5,5302 | 1,7849 | |||
| MS / Morgan Stanley | 0,99 | -7,09 | 176,43 | 3,76 | 3,8864 | 0,4040 | |||
| ROST / Ross Stores, Inc. | 0,85 | -12,22 | 153,11 | 3,77 | 3,3728 | 0,3508 | |||
| CSX / CSX Corporation | 4,05 | -4,29 | 146,88 | -2,29 | 3,2355 | 0,1568 | |||
| V / Visa Inc. | 0,40 | 25,13 | 141,45 | 28,55 | 3,1158 | 0,8624 | |||
| EFX / Equifax Inc. | 0,65 | 140,07 | 3,0854 | 3,0854 | |||||
| FDX / FedEx Corporation | 0,45 | 130,15 | 2,8669 | 2,8669 | |||||
| GWW / W.W. Grainger, Inc. | 0,12 | 122,18 | 2,6913 | 2,6913 | |||||
| WAB / Westinghouse Air Brake Technologies Corporation | 0,54 | 35,85 | 115,95 | 44,65 | 2,5541 | 0,9124 | |||
| ICE / Intercontinental Exchange, Inc. | 0,71 | 115,28 | 2,5394 | 2,5394 | |||||
| YUM / Yum! Brands, Inc. | 0,63 | -27,75 | 95,81 | -28,10 | 2,1105 | -0,6185 | |||
| AMAT / Applied Materials, Inc. | 0,33 | 32,80 | 85,97 | 66,69 | 1,8936 | 0,8374 | |||
| BAC / Bank of America Corporation | 1,52 | 11,57 | 83,79 | 18,95 | 1,8457 | 0,4031 | |||
| JKHY / Jack Henry & Associates, Inc. | 0,46 | 83,64 | 1,8424 | 1,8424 | |||||
| MSFT / Microsoft Corporation | 0,17 | 12,87 | 83,24 | 5,39 | 1,8337 | 0,2160 | |||
| OMC / Omnicom Group Inc. | 1,01 | 81,60 | 1,7974 | 1,7974 | |||||
| FLEX / Flex Ltd. | 1,30 | 34,42 | 78,84 | 40,10 | 1,7366 | 0,5842 | |||
| ACN / Accenture plc | 0,29 | 78,06 | 1,7196 | 1,7196 | |||||
| SSNC / SS&C Technologies Holdings, Inc. | 0,88 | -12,15 | 77,25 | -13,47 | 1,7017 | -0,1268 | |||
| PANW / Palo Alto Networks, Inc. | 0,42 | 76,87 | 1,6932 | 1,6932 | |||||
| LII / Lennox International Inc. | 0,16 | 76,74 | 1,6905 | 1,6905 | |||||
| TJX / The TJX Companies, Inc. | 0,49 | 75,59 | 1,6652 | 1,6652 | |||||
| EVR / Evercore Inc. | 0,22 | 190,12 | 75,53 | 192,64 | 1,6639 | 1,1352 | |||
| COF / Capital One Financial Corporation | 0,31 | -7,80 | 74,37 | 5,12 | 1,6381 | 0,1893 | |||
| IWM / iShares Trust - iShares Russell 2000 ETF | Put | 0,30 | 72,89 | 1,6056 | 1,6056 | ||||
| FFIV / F5, Inc. | 0,27 | 67,92 | 1,4961 | 1,4961 | |||||
| SATS / EchoStar Corporation | 0,61 | -15,31 | 66,55 | 20,56 | 1,4659 | 0,3354 | |||
| QTWO / Q2 Holdings, Inc. | 0,92 | 66,24 | 1,4591 | 1,4591 | |||||
| H / Hyatt Hotels Corporation | 0,39 | 62,04 | 1,3667 | 1,3667 | |||||
| VRSK / Verisk Analytics, Inc. | 0,27 | 61,48 | 1,3543 | 1,3543 | |||||
| ONTO / Onto Innovation Inc. | 0,37 | 18,76 | 57,82 | 45,08 | 1,2736 | 0,4574 | |||
| SAIA / Saia, Inc. | 0,18 | 57,35 | 1,2633 | 1,2633 | |||||
| LYV / Live Nation Entertainment, Inc. | 0,40 | 56,80 | 1,2513 | 1,2513 | |||||
| BKNG / Booking Holdings Inc. | 0,01 | -28,85 | 56,71 | -29,43 | 1,2492 | -0,3965 | |||
| BA / The Boeing Company | 0,26 | 56,50 | 1,2446 | 1,2446 | |||||
| F / Ford Motor Company | 4,27 | 56,03 | 1,2343 | 1,2343 | |||||
| TOL / Toll Brothers, Inc. | 0,40 | 54,54 | 1,2014 | 1,2014 | |||||
| AS / Amer Sports, Inc. | 1,31 | -45,93 | 49,10 | -41,88 | 1,0815 | -0,6485 | |||
| LPLA / LPL Financial Holdings Inc. | 0,13 | -61,90 | 47,80 | -59,09 | 1,0529 | -1,3401 | |||
| CVCO / Cavco Industries, Inc. | 0,08 | 46,58 | 1,0262 | 1,0262 | |||||
| GOOGL / Alphabet Inc. | 0,14 | 44,29 | 0,9757 | 0,9757 | |||||
| CSGP / CoStar Group, Inc. | 0,62 | 41,42 | 0,9124 | 0,9124 | |||||
| MUSA / Murphy USA Inc. | 0,10 | 39,79 | 0,8765 | 0,8765 | |||||
| CMG / Chipotle Mexican Grill, Inc. | 1,07 | 39,42 | 0,8683 | 0,8683 | |||||
| PLNT / Planet Fitness, Inc. | 0,36 | -48,99 | 39,24 | -46,69 | 0,8643 | -0,6431 | |||
| CFG / Citizens Financial Group, Inc. | 0,67 | -12,38 | 39,00 | -3,73 | 0,8591 | 0,0294 | |||
| CBOE / Cboe Global Markets, Inc. | 0,15 | 38,76 | 0,8538 | 0,8538 | |||||
| ONON / On Holding AG | 0,83 | 38,65 | 0,8514 | 0,8514 | |||||
| AMD / Advanced Micro Devices, Inc. | 0,18 | 38,29 | 0,8434 | 0,8434 | |||||
| NVR / NVR, Inc. | 0,01 | 37,57 | 0,8275 | 0,8275 | |||||
| CRS / Carpenter Technology Corporation | 0,12 | 37,32 | 0,8220 | 0,8220 | |||||
| CRM / Salesforce, Inc. | 0,14 | -42,76 | 36,64 | -36,02 | 0,8071 | -0,3657 | |||
| SNAP / Snap Inc. | 4,47 | 18,61 | 36,09 | 24,15 | 0,1996 | ||||
| GM / General Motors Company | 0,44 | -15,13 | 35,52 | 13,20 | 0,7825 | 0,1398 | |||
| WTFC / Wintrust Financial Corporation | 0,25 | 35,44 | 0,7807 | 0,7807 | |||||
| MHO / M/I Homes, Inc. | 0,27 | 9,68 | 34,85 | -2,84 | 0,7677 | 0,0331 | |||
| TSM / Taiwan Semiconductor Manufacturing Company Limited - Depositary Receipt (Common Stock) | 0,11 | -32,18 | 34,33 | -26,21 | 0,7562 | -0,1966 | |||
| ZM / Zoom Communications, Inc. | 0,40 | 12,79 | 34,30 | 17,97 | 0,7556 | 0,1601 | |||
| ARES / Ares Management Corporation | 0,21 | 33,35 | 0,7346 | 0,7346 | |||||
| INTU / Intuit Inc. | 0,05 | 33,29 | 0,7334 | 0,7334 | |||||
| NOC / Northrop Grumman Corporation | 0,05 | 30,85 | 0,6796 | 0,6796 | |||||
| AVGO / Broadcom Inc. | 0,09 | 30,76 | 0,6775 | 0,6775 | |||||
| LULU / lululemon athletica inc. | 0,13 | 27,59 | 0,6078 | 0,6078 | |||||
| HBAN / Huntington Bancshares Incorporated | 1,53 | -69,14 | 26,57 | -69,00 | 0,5852 | -1,1697 | |||
| C / Citigroup Inc. | 0,23 | -41,91 | 26,52 | -33,21 | 0,5843 | -0,2291 | |||
| JHX / James Hardie Industries plc | 1,27 | 26,32 | 0,5798 | 0,5798 | |||||
| ANF / Abercrombie & Fitch Co. | 0,16 | -37,02 | 20,10 | -7,34 | 0,4428 | -0,0015 | |||
| RKT / Rocket Companies, Inc. | 0,96 | 18,63 | 0,4105 | 0,4105 | |||||
| CPRI / Capri Holdings Limited | 0,71 | -33,99 | 17,35 | -19,14 | 0,3822 | -0,0573 | |||
| DKS / DICK'S Sporting Goods, Inc. | 0,06 | -55,81 | 11,24 | -60,63 | 0,2476 | -0,3371 | |||
| BR / Broadridge Financial Solutions, Inc. | 0,00 | -100,00 | 0,00 | 0,0000 | |||||
| SPGI / S&P Global Inc. | 0,00 | -100,00 | 0,00 | 0,0000 | |||||
| CHWY / Chewy, Inc. | 0,00 | -100,00 | 0,00 | -100,00 | -0,7080 | ||||
| PTC / PTC Inc. | 0,00 | -100,00 | 0,00 | 0,0000 | |||||
| CSCO / Cisco Systems, Inc. | 0,00 | -100,00 | 0,00 | 0,0000 | |||||
| META / Meta Platforms, Inc. | 0,00 | -100,00 | 0,00 | 0,0000 | |||||
| KR / The Kroger Co. | 0,00 | -100,00 | 0,00 | 0,0000 | |||||
| IWM / iShares Trust - iShares Russell 2000 ETF | Call | 0,00 | -100,00 | 0,00 | 0,0000 | ||||
| AMZN / Amazon.com, Inc. | 0,00 | -100,00 | 0,00 | 0,0000 | |||||
| LMT / Lockheed Martin Corporation | 0,00 | -100,00 | 0,00 | 0,0000 | |||||
| PHM / PulteGroup, Inc. | 0,00 | -100,00 | 0,00 | 0,0000 | |||||
| RSP / Invesco Exchange-Traded Fund Trust - Invesco S&P 500 Equal Weight ETF | 0,00 | -100,00 | 0,00 | 0,0000 | |||||
| CME / CME Group Inc. | 0,00 | -100,00 | 0,00 | 0,0000 | |||||
| EAT / Brinker International, Inc. | 0,00 | -100,00 | 0,00 | 0,0000 | |||||
| PSN / Parsons Corporation | 0,00 | -100,00 | 0,00 | 0,0000 | |||||
| KKR / KKR & Co. Inc. | 0,00 | -100,00 | 0,00 | 0,0000 | |||||
| TT / Trane Technologies plc | 0,00 | -100,00 | 0,00 | 0,0000 | |||||
| XYZ / Block, Inc. | 0,00 | -100,00 | 0,00 | 0,0000 | |||||
| TTMI / TTM Technologies, Inc. | 0,00 | -100,00 | 0,00 | 0,0000 | |||||
| PFGC / Performance Food Group Company | 0,00 | -100,00 | 0,00 | 0,0000 | |||||
| HUBS / HubSpot, Inc. | 0,00 | -100,00 | 0,00 | 0,0000 | |||||
| TMUS / T-Mobile US, Inc. | 0,00 | -100,00 | 0,00 | 0,0000 | |||||
| ASO / Academy Sports and Outdoors, Inc. | 0,00 | -100,00 | 0,00 | 0,0000 | |||||
| AAPL / Apple Inc. | 0,00 | -100,00 | 0,00 | 0,0000 | |||||
| PNC / The PNC Financial Services Group, Inc. | 0,00 | -100,00 | 0,00 | 0,0000 | |||||
| ORLY / O'Reilly Automotive, Inc. | 0,00 | -100,00 | 0,00 | 0,0000 | |||||
| CCL / Carnival Corporation & plc | 0,00 | -100,00 | 0,00 | -100,00 | -1,6595 | ||||
| BURL / Burlington Stores, Inc. | 0,00 | -100,00 | 0,00 | 0,0000 | |||||
| KNX / Knight-Swift Transportation Holdings Inc. | 0,00 | -100,00 | 0,00 | 0,0000 | |||||
| OC / Owens Corning | 0,00 | -100,00 | 0,00 | 0,0000 | |||||
| BX / Blackstone Inc. | 0,00 | -100,00 | 0,00 | 0,0000 | |||||
| GPC / Genuine Parts Company | 0,00 | -100,00 | 0,00 | 0,0000 | |||||
| SPOT / Spotify Technology S.A. | 0,00 | -100,00 | 0,00 | 0,0000 | |||||
| TXRH / Texas Roadhouse, Inc. | 0,00 | -100,00 | 0,00 | 0,0000 | |||||
| NVDD / Direxion Shares ETF Trust - Direxion Daily NVDA Bear 1X ETF | 0,00 | -100,00 | 0,00 | 0,0000 | |||||
| TMHC / Taylor Morrison Home Corporation | 0,00 | -100,00 | 0,00 | 0,0000 | |||||
| USMV / iShares Trust - iShares MSCI USA Min Vol Factor ETF | 0,00 | -100,00 | 0,00 | 0,0000 | |||||
| CNK / Cinemark Holdings, Inc. | 0,00 | -100,00 | 0,00 | 0,0000 | |||||
| DIS / The Walt Disney Company | 0,00 | -100,00 | 0,00 | 0,0000 | |||||
| ARMK / Aramark | 0,00 | -100,00 | 0,00 | 0,0000 |