Basisstatistiken
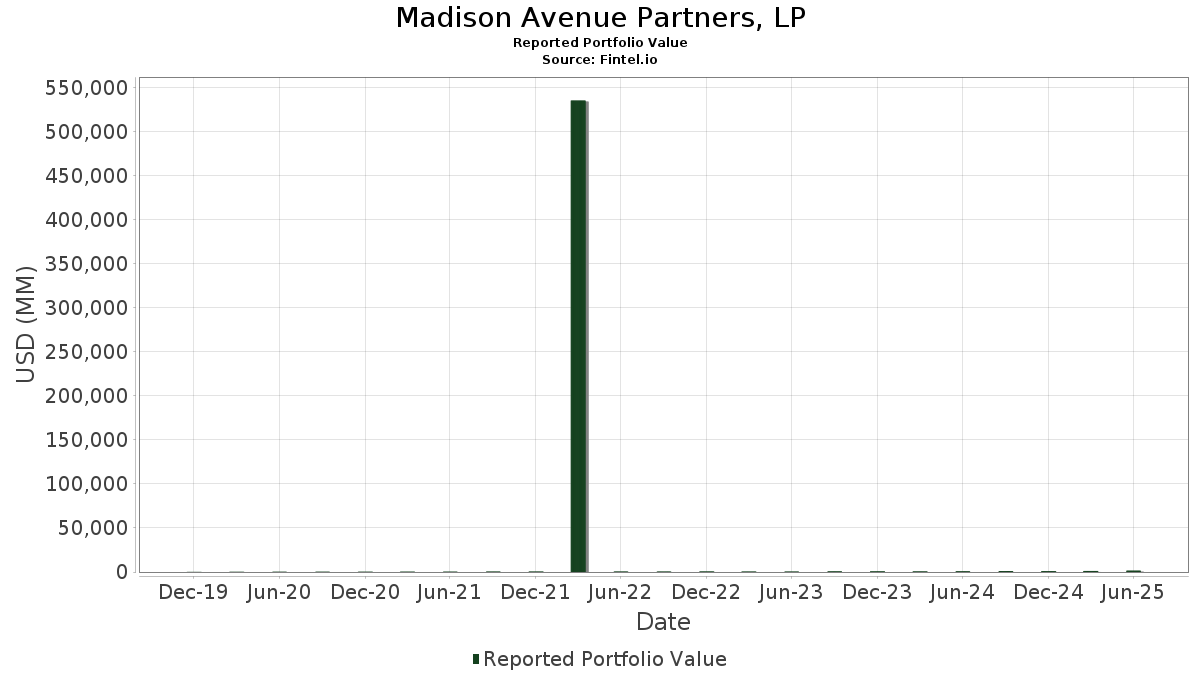
| Portfolio-Wert | $ 1.675.690.897 |
| Aktuelle Positionen | 20 |
Neueste Bestände, Performance, AUM (aus 13F, 13D)
Madison Avenue Partners, LP hat 20 Gesamtbeteiligungen in seinen letzten SEC-Einreichungen offengelegt. Der jüngste Portfoliowert wird auf $ 1.675.690.897 USD berechnet. Das tatsächliche verwaltete Vermögen (AUM) ist dieser Wert plus Barmittel (die nicht offengelegt werden). Madison Avenue Partners, LPs Top-Bestände sind Graham Holdings Company (US:GHC) , Sandisk Corporation (US:SNDK) , Markel Group Inc. (US:MKL) , Indivior PLC (US:INDV) , and Globus Medical, Inc. (US:GMED) . Madison Avenue Partners, LPs neue Positionen sind British American Tobacco p.l.c. - Depositary Receipt (Common Stock) (US:BTI) , Centuri Holdings, Inc. (US:CTRI) , . Madison Avenue Partners, LPs wichtigste Branchen sind "Real Estate" (sic 65) , "Wholesale Trade-non-durable Goods" (sic 51) , and "Motion Pictures and Film" (sic 78) .
Top-Zuwächse in diesem Quartal
Wir verwenden die Veränderung der Portfolioallokation, weil dies die aussagekräftigste Kennzahl ist. Die Änderungen können auf Trades oder Änderungen der Aktienkurse zurückzuführen sein.
| Wertpapier | Aktien (MM) |
Wert (MM$) |
Portfolio % | ΔPortfolio % |
|---|---|---|---|---|
| BTI / British American Tobacco p.l.c. - Depositary Receipt (Common Stock) | 1,22 | 64,96 | 3,8765 | 3,8765 |
| SNDK / Sandisk Corporation | 2,06 | 231,41 | 13,8101 | 2,9976 |
| NWSA / News Corporation | 1,45 | 44,63 | 2,6635 | 2,6635 |
| GMED / Globus Medical, Inc. | 2,55 | 145,93 | 8,7088 | 1,9622 |
| GHC / Graham Holdings Company | 0,25 | 289,42 | 17,2715 | 1,7776 |
| INDV / Indivior PLC | 6,46 | 155,84 | 9,2999 | 1,5036 |
| 0TB / Theravance Biopharma, Inc. | 9,51 | 138,86 | 8,2869 | 1,2828 |
| GLPG / Galapagos NV - Depositary Receipt (Common Stock) | 2,20 | 76,06 | 4,5391 | 1,0315 |
| CTRI / Centuri Holdings, Inc. | 0,69 | 14,67 | 0,8757 | 0,8757 |
| AIV / Apartment Investment and Management Company | 3,62 | 28,69 | 1,7118 | 0,8607 |
Top-Rückgänge in diesem Quartal
Wir verwenden die Veränderung der Portfolioallokation, weil dies die aussagekräftigste Kennzahl ist. Änderungen können auf Handelsgeschäfte oder Änderungen der Aktienkurse zurückzuführen sein.
| Wertpapier | Aktien (MM) |
Wert (MM$) |
Portfolio % | ΔPortfolio % |
|---|---|---|---|---|
| SAGE / Sage Therapeutics, Inc. | 0,00 | 0,00 | -3,7003 | |
| WLYB / John Wiley & Sons, Inc. | 1,17 | 47,38 | 2,8272 | -3,2892 |
| SOLV / Solventum Corporation | 1,99 | 145,15 | 8,6622 | -2,7019 |
| INVX / Innovex International, Inc. | 0,00 | 0,00 | -1,8438 | |
| MKL / Markel Group Inc. | 0,08 | 161,15 | 9,6167 | -1,6262 |
| MRP / Millrose Properties, Inc. | 0,00 | 0,00 | -1,5719 | |
| CRGX / CARGO Therapeutics, Inc. | 0,00 | 0,00 | -1,1535 | |
| NNI / Nelnet, Inc. | 0,03 | 3,95 | 0,2360 | -0,9302 |
| MAGN / Magnera Corporation | 2,83 | 33,19 | 1,9809 | -0,7161 |
| ALMS / Alumis Inc. | 0,42 | 1,67 | 0,0995 | -0,2695 |
13D/G Einreichungen
Dies ist eine Liste der 13D- und 13G-Einreichungen des letzten Jahres (falls vorhanden). Klicken Sie auf das Link-Symbol, um die vollständige Transaktionshistorie anzuzeigen. Grüne Zeilen zeigen neue Positionen an. Rote Zeilen zeigen geschlossene Positionen an.
| Datei Datum | Formular | Wertpapier | Vorherige Aktien |
Aktuelle Aktien |
ΔAktien % | % Eigentümerschaft |
% ΔEigentümerschaft | |
|---|---|---|---|---|---|---|---|---|
| 2025-11-14 | MAGN / Magnera Corporation | 3.198.329 | 2.832.281 | -11,44 | 8,00 | -11,11 | ||
| 2025-11-14 | CRGX / CARGO Therapeutics, Inc. | 4.193.626 | 0 | -100,00 | 0,00 | -100,00 | ||
| 2025-11-14 | SAGE / Sage Therapeutics, Inc. | 6.077.065 | 0 | -100,00 | 0,00 | -100,00 | ||
| 2025-05-14 | KROS / Keros Therapeutics, Inc. | 2.614.402 | 6,40 | |||||
| 2025-04-30 | SLRN / Acelyrin, Inc. | 5.089.260 | 5,10 | |||||
| 2025-03-18 | INDV / Indivior PLC | 7.438.153 | 6,00 | |||||
| 2025-02-14 | OVID / Ovid Therapeutics Inc. | 3.648.509 | 2.852.352 | -21,82 | 4,00 | -23,08 | ||
| 2025-02-14 | WLY / John Wiley & Sons, Inc. | 2.290.206 | 2.229.904 | -2,63 | 4,95 | -2,94 |
13F und Fondseinreichungen
Dieses Formular wurde am 2025-11-14 für den Berichtszeitraum eingereicht 2025-09-30. Klicken Sie auf das Link-Symbol , um den gesamten Transaktionsverlauf zu sehen.
Upgrade um die Prämiendaten zu entsperren und nach Excel zu exportieren ![]() .
.
| Wertpapier | Typ | Durchschnittlicher Aktienkurs | Aktien (MM) |
ΔAktien (%) |
Wert ($MM) |
ΔAktien (%) |
Portfolio (%) |
ΔPortfolio (%) |
|
|---|---|---|---|---|---|---|---|---|---|
| GHC / Graham Holdings Company | 0,25 | 0,23 | 289,42 | 24,71 | 17,2715 | 1,7776 | |||
| SNDK / Sandisk Corporation | 2,06 | -42,24 | 231,41 | 42,89 | 13,8101 | 2,9976 | |||
| MKL / Markel Group Inc. | 0,08 | 0,00 | 161,15 | -4,31 | 9,6167 | -1,6262 | |||
| INDV / Indivior PLC | 6,46 | -18,41 | 155,84 | 33,45 | 9,2999 | 1,5036 | |||
| GMED / Globus Medical, Inc. | 2,55 | 48,83 | 145,93 | 44,42 | 8,7088 | 1,9622 | |||
| SOLV / Solventum Corporation | 1,99 | -11,41 | 145,15 | -14,72 | 8,6622 | -2,7019 | |||
| 0TB / Theravance Biopharma, Inc. | 9,51 | 0,00 | 138,86 | 32,37 | 8,2869 | 1,2828 | |||
| GLPG / Galapagos NV - Depositary Receipt (Common Stock) | 2,20 | 16,98 | 76,06 | 44,78 | 4,5391 | 1,0315 | |||
| BTI / British American Tobacco p.l.c. - Depositary Receipt (Common Stock) | 1,22 | 64,96 | 3,8765 | 3,8765 | |||||
| WLYB / John Wiley & Sons, Inc. | 1,17 | -42,97 | 47,38 | -48,29 | 2,8272 | -3,2892 | |||
| STGW / Stagwell Inc. | 8,01 | 0,00 | 45,12 | 25,11 | 2,6927 | 0,2848 | |||
| NWSA / News Corporation | 1,45 | 44,63 | 2,6635 | 2,6635 | |||||
| KROS / Keros Therapeutics, Inc. | 2,71 | 0,62 | 42,84 | 19,24 | 2,5568 | 0,1579 | |||
| MAGN / Magnera Corporation | 2,83 | -15,30 | 33,19 | -17,83 | 1,9809 | -0,7161 | |||
| AIV / Apartment Investment and Management Company | 3,62 | 145,44 | 28,69 | 125,02 | 1,7118 | 0,8607 | |||
| CTRI / Centuri Holdings, Inc. | 0,69 | 14,67 | 0,8757 | 0,8757 | |||||
| FSP / Franklin Street Properties Corp. | 2,58 | 0,00 | 4,13 | -2,43 | 0,2464 | -0,0362 | |||
| NNI / Nelnet, Inc. | 0,03 | -78,13 | 3,95 | -77,37 | 0,2360 | -0,9302 | |||
| ALMS / Alumis Inc. | 0,42 | -77,32 | 1,67 | -69,85 | 0,0995 | -0,2695 | |||
| SN / SharkNinja, Inc. | 0,01 | 0,00 | 0,63 | 4,28 | 0,0379 | -0,0028 | |||
| INVX / Innovex International, Inc. | 0,00 | -100,00 | 0,00 | -100,00 | -1,8438 | ||||
| PLRX / Pliant Therapeutics, Inc. | 0,00 | -100,00 | 0,00 | -100,00 | -0,1727 | ||||
| CNNE / Cannae Holdings, Inc. | 0,00 | -100,00 | 0,00 | 0,0000 | |||||
| SAGE / Sage Therapeutics, Inc. | 0,00 | -100,00 | 0,00 | -100,00 | -3,7003 | ||||
| MRP / Millrose Properties, Inc. | 0,00 | -100,00 | 0,00 | -100,00 | -1,5719 | ||||
| ARVN / Arvinas, Inc. | 0,00 | -100,00 | 0,00 | -100,00 | -0,2457 | ||||
| CRGX / CARGO Therapeutics, Inc. | 0,00 | -100,00 | 0,00 | -100,00 | -1,1535 | ||||
| OVID / Ovid Therapeutics Inc. | 0,00 | -100,00 | 0,00 | 0,0000 | |||||
| CMCO / Columbus McKinnon Corporation | 0,00 | -100,00 | 0,00 | -100,00 | -0,0469 |