Basisstatistiken
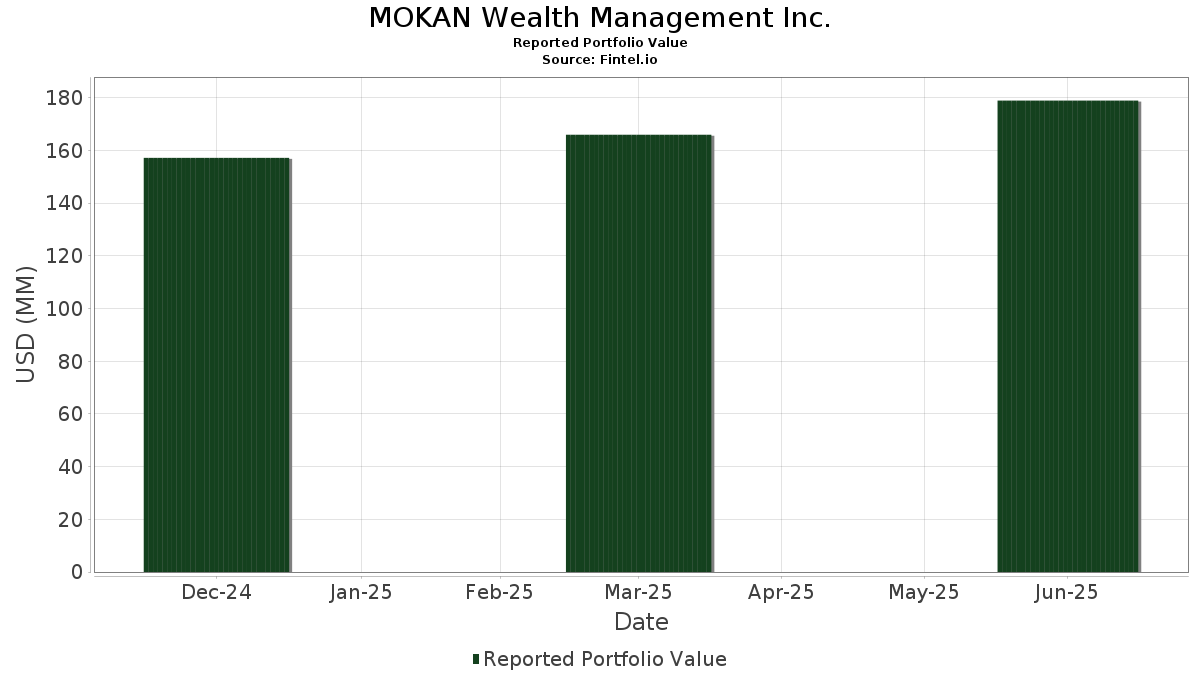
| Portfolio-Wert | $ 198.786.120 |
| Aktuelle Positionen | 99 |
Neueste Bestände, Performance, AUM (aus 13F, 13D)
MOKAN Wealth Management Inc. hat 99 Gesamtbeteiligungen in seinen letzten SEC-Einreichungen offengelegt. Der jüngste Portfoliowert wird auf $ 198.786.120 USD berechnet. Das tatsächliche verwaltete Vermögen (AUM) ist dieser Wert plus Barmittel (die nicht offengelegt werden). MOKAN Wealth Management Inc.s Top-Bestände sind Vanguard Scottsdale Funds - Vanguard Short-Term Treasury ETF (US:VGSH) , SPDR Series Trust - State Street SPDR Bloomberg 1-3 Month T-Bill ETF (US:BIL) , SPDR Series Trust - State Street SPDR Bloomberg 3-12 Month T-Bill ETF (US:BILS) , Vanguard World Fund - Vanguard Information Technology ETF (US:VGT) , and Broadcom Inc. (US:AVGO) . MOKAN Wealth Management Inc.s neue Positionen sind JPMorgan Chase & Co. (US:JPM) , A. O. Smith Corporation (US:AOS) , W.W. Grainger, Inc. (US:GWW) , Cognizant Technology Solutions Corporation (US:CTSH) , and The Kraft Heinz Company (US:KHC) .
Top-Zuwächse in diesem Quartal
Wir verwenden die Veränderung der Portfolioallokation, weil dies die aussagekräftigste Kennzahl ist. Die Änderungen können auf Trades oder Änderungen der Aktienkurse zurückzuführen sein.
| Wertpapier | Aktien (MM) |
Wert (MM$) |
Portfolio % | ΔPortfolio % |
|---|---|---|---|---|
| JPM / JPMorgan Chase & Co. | 0,01 | 2,95 | 1,4850 | 1,4850 |
| VUG / Vanguard Index Funds - Vanguard Growth ETF | 0,01 | 6,57 | 3,3061 | 1,0549 |
| AOS / A. O. Smith Corporation | 0,02 | 1,30 | 0,6533 | 0,6533 |
| VGT / Vanguard World Fund - Vanguard Information Technology ETF | 0,01 | 8,85 | 4,4519 | 0,6475 |
| GWW / W.W. Grainger, Inc. | 0,00 | 1,25 | 0,6292 | 0,6292 |
| CTSH / Cognizant Technology Solutions Corporation | 0,02 | 1,24 | 0,6215 | 0,6215 |
| WMT / Walmart Inc. | 0,06 | 5,73 | 2,8821 | 0,5153 |
| VTV / Vanguard Index Funds - Vanguard Value ETF | 0,02 | 3,14 | 1,5772 | 0,4350 |
| KHC / The Kraft Heinz Company | 0,03 | 0,70 | 0,3529 | 0,3529 |
| CMCSA / Comcast Corporation | 0,02 | 0,67 | 0,3379 | 0,3379 |
Top-Rückgänge in diesem Quartal
Wir verwenden die Veränderung der Portfolioallokation, weil dies die aussagekräftigste Kennzahl ist. Änderungen können auf Handelsgeschäfte oder Änderungen der Aktienkurse zurückzuführen sein.
| Wertpapier | Aktien (MM) |
Wert (MM$) |
Portfolio % | ΔPortfolio % |
|---|---|---|---|---|
| UNH / UnitedHealth Group Incorporated | 0,00 | 0,32 | 0,1598 | -1,3721 |
| GILD / Gilead Sciences, Inc. | 0,01 | 0,81 | 0,4071 | -0,7922 |
| MA / Mastercard Incorporated | 0,00 | 0,00 | -0,7918 | |
| COP / ConocoPhillips | 0,03 | 3,15 | 1,5866 | -0,7014 |
| MRK / Merck & Co., Inc. | 0,05 | 4,28 | 2,1507 | -0,4770 |
| BIL / SPDR Series Trust - State Street SPDR Bloomberg 1-3 Month T-Bill ETF | 0,14 | 12,69 | 6,3815 | -0,4605 |
| CSCO / Cisco Systems, Inc. | 0,00 | 0,00 | -0,4350 | |
| VGSH / Vanguard Scottsdale Funds - Vanguard Short-Term Treasury ETF | 0,22 | 12,88 | 6,4804 | -0,4342 |
| BILS / SPDR Series Trust - State Street SPDR Bloomberg 3-12 Month T-Bill ETF | 0,12 | 11,54 | 5,8071 | -0,3653 |
| SCHD / Schwab Strategic Trust - Schwab U.S. Dividend Equity ETF | 0,14 | 3,80 | 1,9130 | -0,3200 |
13F und Fondseinreichungen
Dieses Formular wurde am 2025-10-30 für den Berichtszeitraum eingereicht 2025-09-30. Klicken Sie auf das Link-Symbol , um den gesamten Transaktionsverlauf zu sehen.
Upgrade um die Prämiendaten zu entsperren und nach Excel zu exportieren ![]() .
.
| Wertpapier | Typ | Durchschnittlicher Aktienkurs | Aktien (MM) |
ΔAktien (%) |
Wert ($MM) |
ΔAktien (%) |
Portfolio (%) |
ΔPortfolio (%) |
|
|---|---|---|---|---|---|---|---|---|---|
| VGSH / Vanguard Scottsdale Funds - Vanguard Short-Term Treasury ETF | 0,22 | 4,00 | 12,88 | 4,12 | 6,4804 | -0,4342 | |||
| BIL / SPDR Series Trust - State Street SPDR Bloomberg 1-3 Month T-Bill ETF | 0,14 | 3,60 | 12,69 | 3,62 | 6,3815 | -0,4605 | |||
| BILS / SPDR Series Trust - State Street SPDR Bloomberg 3-12 Month T-Bill ETF | 0,12 | 4,43 | 11,54 | 4,52 | 5,8071 | -0,3653 | |||
| VGT / Vanguard World Fund - Vanguard Information Technology ETF | 0,01 | 15,52 | 8,85 | 30,02 | 4,4519 | 0,6475 | |||
| AVGO / Broadcom Inc. | 0,03 | -9,35 | 8,36 | 8,49 | 4,2051 | -0,1014 | |||
| BRK.A / Berkshire Hathaway Inc. | 0,02 | 15,50 | 7,87 | 19,51 | 3,9610 | 0,2786 | |||
| AAPL / Apple Inc. | 0,03 | -5,69 | 6,77 | 17,04 | 3,4079 | 0,1727 | |||
| VUG / Vanguard Index Funds - Vanguard Growth ETF | 0,01 | 49,06 | 6,57 | 63,20 | 3,3061 | 1,0549 | |||
| MSFT / Microsoft Corporation | 0,01 | 1,42 | 6,35 | 5,69 | 3,1939 | -0,1633 | |||
| WMT / Walmart Inc. | 0,06 | 28,34 | 5,73 | 35,31 | 2,8821 | 0,5153 | |||
| AMZN / Amazon.com, Inc. | 0,02 | 0,77 | 4,72 | 0,92 | 2,3734 | -0,2394 | |||
| MRK / Merck & Co., Inc. | 0,05 | -14,23 | 4,28 | -9,06 | 2,1507 | -0,4770 | |||
| ABBV / AbbVie Inc. | 0,02 | -0,56 | 4,21 | 24,03 | 2,1191 | 0,2209 | |||
| MCD / McDonald's Corporation | 0,01 | 8,06 | 3,90 | 12,36 | 1,9625 | 0,0217 | |||
| NVDA / NVIDIA Corporation | 0,02 | -1,28 | 3,84 | 16,56 | 1,9302 | 0,0909 | |||
| SCHD / Schwab Strategic Trust - Schwab U.S. Dividend Equity ETF | 0,14 | -7,61 | 3,80 | -4,83 | 1,9130 | -0,3200 | |||
| GOOG / Alphabet Inc. | 0,01 | -16,61 | 3,63 | 14,57 | 1,8237 | 0,0553 | |||
| ABT / Abbott Laboratories | 0,02 | 8,78 | 3,21 | 7,12 | 1,6127 | -0,0599 | |||
| COP / ConocoPhillips | 0,03 | -26,92 | 3,15 | -22,97 | 1,5866 | -0,7014 | |||
| VTV / Vanguard Index Funds - Vanguard Value ETF | 0,02 | 45,48 | 3,14 | 53,45 | 1,5772 | 0,4350 | |||
| COST / Costco Wholesale Corporation | 0,00 | 17,69 | 3,13 | 10,16 | 1,5771 | -0,0132 | |||
| JPM / JPMorgan Chase & Co. | 0,01 | 2,95 | 1,4850 | 1,4850 | |||||
| HD / The Home Depot, Inc. | 0,01 | -0,08 | 2,59 | 10,44 | 1,3044 | -0,0077 | |||
| GJR / Strats Trust For Procter & Gambel Security - Preferred Security | 0,02 | 4,24 | 2,45 | 0,49 | 1,2346 | -0,1303 | |||
| JNJ / Johnson & Johnson | 0,01 | -11,68 | 2,31 | 7,19 | 1,1627 | -0,0424 | |||
| CBOE / Cboe Global Markets, Inc. | 0,01 | -0,91 | 2,22 | 4,17 | 1,1173 | -0,0743 | |||
| SNA / Snap-on Incorporated | 0,01 | -0,91 | 2,22 | 10,23 | 1,1170 | -0,0087 | |||
| HSY / The Hershey Company | 0,01 | -10,33 | 2,14 | 1,04 | 1,0744 | -0,1066 | |||
| ITW / Illinois Tool Works Inc. | 0,01 | 37,65 | 2,06 | 45,44 | 1,0338 | 0,2437 | |||
| PEP / PepsiCo, Inc. | 0,01 | -8,37 | 2,04 | -2,54 | 1,0247 | -0,1430 | |||
| EOG / EOG Resources, Inc. | 0,02 | -1,96 | 1,98 | -8,13 | 0,9952 | -0,2082 | |||
| VGRSX / Vanguard REIT Index Fund | 0,01 | 8,46 | 1,97 | 14,40 | 0,9915 | 0,0287 | |||
| GOOGL / Alphabet Inc. | 0,01 | -0,68 | 1,56 | 37,11 | 0,7867 | 0,1493 | |||
| VOO / Vanguard Index Funds - Vanguard S&P 500 ETF | 0,00 | 10,70 | 1,45 | 19,00 | 0,7311 | 0,0486 | |||
| V / Visa Inc. | 0,00 | 4,08 | 1,45 | 0,14 | 0,7280 | -0,0799 | |||
| YUM / Yum! Brands, Inc. | 0,01 | -2,80 | 1,44 | -0,35 | 0,7266 | -0,0835 | |||
| QCOM / QUALCOMM Incorporated | 0,01 | -8,52 | 1,44 | -4,50 | 0,7264 | -0,1185 | |||
| EXPD / Expeditors International of Washington, Inc. | 0,01 | -9,58 | 1,39 | -3,06 | 0,7006 | -0,1021 | |||
| ALLE / Allegion plc | 0,01 | -21,08 | 1,34 | -2,82 | 0,6763 | -0,0968 | |||
| AON / Aon plc | 0,00 | -1,75 | 1,30 | -1,66 | 0,6552 | -0,0850 | |||
| AOS / A. O. Smith Corporation | 0,02 | 1,30 | 0,6533 | 0,6533 | |||||
| PAYX / Paychex, Inc. | 0,01 | 13,27 | 1,28 | -1,39 | 0,6445 | -0,0819 | |||
| AVY / Avery Dennison Corporation | 0,01 | 4,25 | 1,27 | -3,58 | 0,6368 | -0,0967 | |||
| ACN / Accenture plc | 0,01 | 21,54 | 1,26 | 0,08 | 0,6354 | -0,0704 | |||
| ZTS / Zoetis Inc. | 0,01 | 7,87 | 1,25 | 1,29 | 0,6299 | -0,0609 | |||
| GWW / W.W. Grainger, Inc. | 0,00 | 1,25 | 0,6292 | 0,6292 | |||||
| CTSH / Cognizant Technology Solutions Corporation | 0,02 | 1,24 | 0,6215 | 0,6215 | |||||
| PHM / PulteGroup, Inc. | 0,01 | -28,63 | 1,23 | -10,57 | 0,6173 | -0,1496 | |||
| VYM / Vanguard Whitehall Funds - Vanguard High Dividend Yield ETF | 0,01 | 13,41 | 1,15 | 19,96 | 0,5810 | 0,0432 | |||
| RTX / RTX Corporation | 0,01 | -0,12 | 0,99 | 14,53 | 0,4997 | 0,0147 | |||
| GILD / Gilead Sciences, Inc. | 0,01 | -62,32 | 0,81 | -62,28 | 0,4071 | -0,7922 | |||
| CME / CME Group Inc. | 0,00 | 14,90 | 0,81 | 12,83 | 0,4070 | 0,0061 | |||
| VZ / Verizon Communications Inc. | 0,02 | 7,48 | 0,78 | 9,14 | 0,3906 | -0,0069 | |||
| CF / CF Industries Holdings, Inc. | 0,01 | 19,71 | 0,77 | 16,52 | 0,3873 | 0,0185 | |||
| DGX / Quest Diagnostics Incorporated | 0,00 | 3,82 | 0,76 | 10,22 | 0,3801 | -0,0033 | |||
| TROW / T. Rowe Price Group, Inc. | 0,01 | -5,95 | 0,75 | 0,00 | 0,3781 | -0,0420 | |||
| FOXA / Fox Corporation | 0,01 | -1,02 | 0,75 | 11,29 | 0,3772 | 0,0008 | |||
| TSLA / Tesla, Inc. | 0,00 | -2,86 | 0,74 | 36,10 | 0,3721 | 0,0681 | |||
| GIS / General Mills, Inc. | 0,01 | 16,27 | 0,74 | 13,19 | 0,3715 | 0,0068 | |||
| MO / Altria Group, Inc. | 0,01 | -0,64 | 0,74 | 11,85 | 0,3707 | 0,0027 | |||
| KMB / Kimberly-Clark Corporation | 0,01 | 14,56 | 0,73 | 10,45 | 0,3671 | -0,0020 | |||
| USB / U.S. Bancorp | 0,01 | -0,57 | 0,72 | 6,35 | 0,3622 | -0,0167 | |||
| VICI / VICI Properties Inc. | 0,02 | 3,74 | 0,71 | 3,82 | 0,3556 | -0,0250 | |||
| KHC / The Kraft Heinz Company | 0,03 | 0,70 | 0,3529 | 0,3529 | |||||
| CAG / Conagra Brands, Inc. | 0,04 | 28,31 | 0,69 | 14,69 | 0,3460 | 0,0110 | |||
| CL / Colgate-Palmolive Company | 0,01 | 16,55 | 0,69 | 2,54 | 0,3446 | -0,0288 | |||
| CMCSA / Comcast Corporation | 0,02 | 0,67 | 0,3379 | 0,3379 | |||||
| XOM / Exxon Mobil Corporation | 0,01 | 0,83 | 0,66 | 5,63 | 0,3306 | -0,0175 | |||
| KO / The Coca-Cola Company | 0,01 | 1,03 | 0,56 | -5,25 | 0,2819 | -0,0489 | |||
| TMUS / T-Mobile US, Inc. | 0,00 | 0,35 | 0,48 | 0,83 | 0,2440 | -0,0248 | |||
| VXUS / Vanguard STAR Funds - Vanguard Total International Stock ETF | 0,00 | 18,27 | 0,36 | 25,80 | 0,1792 | 0,0209 | |||
| NEE / NextEra Energy, Inc. | 0,00 | -4,14 | 0,34 | 4,29 | 0,1714 | -0,0113 | |||
| CRH / CRH plc | 0,00 | 0,00 | 0,33 | 30,59 | 0,1677 | 0,0251 | |||
| PANW / Palo Alto Networks, Inc. | 0,00 | 22,97 | 0,33 | 22,06 | 0,1674 | 0,0153 | |||
| UNH / UnitedHealth Group Incorporated | 0,00 | -89,55 | 0,32 | -88,43 | 0,1598 | -1,3721 | |||
| HRB / H&R Block, Inc. | 0,01 | 0,66 | 0,32 | -7,35 | 0,1587 | -0,0314 | |||
| DY / Dycom Industries, Inc. | 0,00 | 17,69 | 0,30 | 40,19 | 0,1513 | 0,0315 | |||
| CVX / Chevron Corporation | 0,00 | 1,05 | 0,30 | 9,56 | 0,1501 | -0,0020 | |||
| META / Meta Platforms, Inc. | 0,00 | 3,43 | 0,29 | 3,21 | 0,1456 | -0,0113 | |||
| LOW / Lowe's Companies, Inc. | 0,00 | 0,46 | 0,28 | 14,05 | 0,1391 | 0,0033 | |||
| ACLS / Axcelis Technologies, Inc. | 0,00 | 0,26 | 0,1293 | 0,1293 | |||||
| BA / The Boeing Company | 0,00 | 0,00 | 0,25 | 2,89 | 0,1256 | -0,0099 | |||
| FLEX / Flex Ltd. | 0,00 | 3,47 | 0,24 | 19,90 | 0,1216 | 0,0092 | |||
| JBL / Jabil Inc. | 0,00 | 8,96 | 0,24 | 8,22 | 0,1197 | -0,0030 | |||
| MPWR / Monolithic Power Systems, Inc. | 0,00 | 0,23 | 0,1154 | 0,1154 | |||||
| CNC / Centene Corporation | 0,01 | 0,23 | 0,1149 | 0,1149 | |||||
| CAT / Caterpillar Inc. | 0,00 | 0,22 | 0,1131 | 0,1131 | |||||
| CHTR / Charter Communications, Inc. | 0,00 | 0,22 | 0,1105 | 0,1105 | |||||
| NBIX / Neurocrine Biosciences, Inc. | 0,00 | 0,22 | 0,1105 | 0,1105 | |||||
| WSM / Williams-Sonoma, Inc. | 0,00 | 0,22 | 0,1094 | 0,1094 | |||||
| HIMS / Hims & Hers Health, Inc. | 0,00 | 0,22 | 0,1094 | 0,1094 | |||||
| DHI / D.R. Horton, Inc. | 0,00 | 0,22 | 0,1089 | 0,1089 | |||||
| AVT / Avnet, Inc. | 0,00 | 0,22 | 0,1087 | 0,1087 | |||||
| TOL / Toll Brothers, Inc. | 0,00 | 0,22 | 0,1084 | 0,1084 | |||||
| ABG / Asbury Automotive Group, Inc. | 0,00 | 0,21 | 0,1048 | 0,1048 | |||||
| ZM / Zoom Communications, Inc. | 0,00 | 0,21 | 0,1041 | 0,1041 | |||||
| EXEL / Exelixis, Inc. | 0,00 | 0,21 | 0,1034 | 0,1034 | |||||
| PM / Philip Morris International Inc. | 0,00 | 1,21 | 0,20 | -9,78 | 0,1023 | -0,0235 | |||
| PODD / Insulet Corporation | 0,00 | 0,20 | 0,1016 | 0,1016 | |||||
| CSCO / Cisco Systems, Inc. | 0,00 | -100,00 | 0,00 | -100,00 | -0,4350 | ||||
| MA / Mastercard Incorporated | 0,00 | -100,00 | 0,00 | -100,00 | -0,7918 | ||||
| PPG / PPG Industries, Inc. | 0,00 | -100,00 | 0,00 | 0,0000 | |||||
| LMT / Lockheed Martin Corporation | 0,00 | -100,00 | 0,00 | 0,0000 |