Basisstatistiken
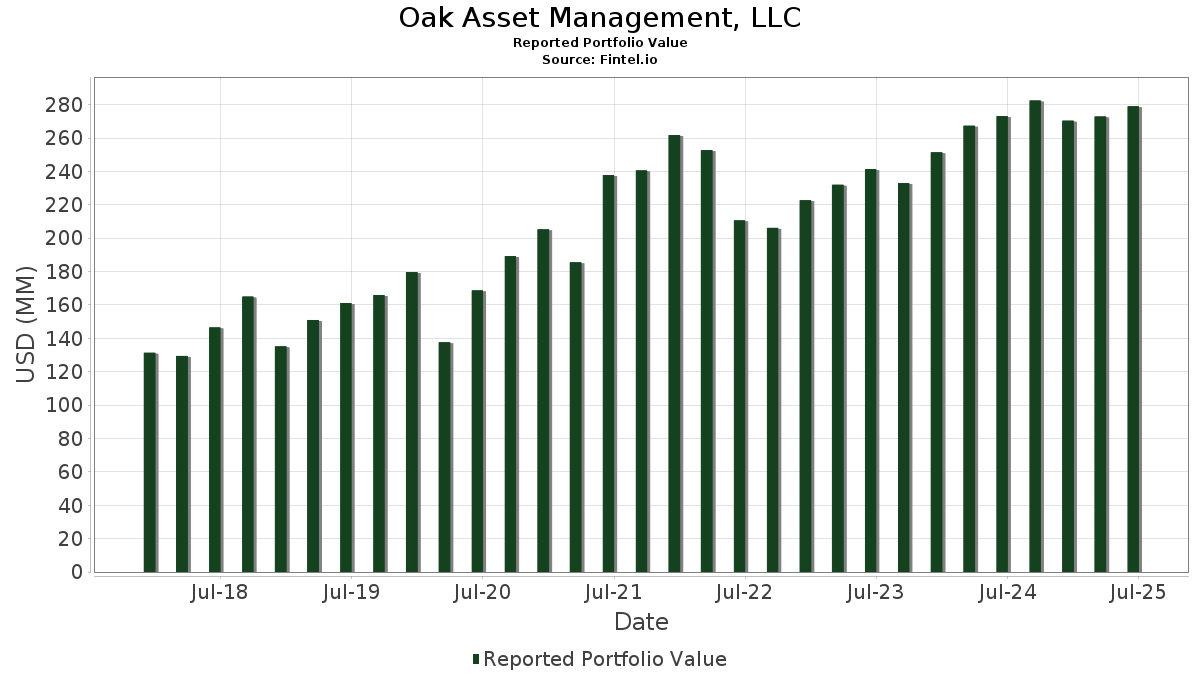
| Portfolio-Wert | $ 293.199.043 |
| Aktuelle Positionen | 104 |
Neueste Bestände, Performance, AUM (aus 13F, 13D)
Oak Asset Management, LLC hat 104 Gesamtbeteiligungen in seinen letzten SEC-Einreichungen offengelegt. Der jüngste Portfoliowert wird auf $ 293.199.043 USD berechnet. Das tatsächliche verwaltete Vermögen (AUM) ist dieser Wert plus Barmittel (die nicht offengelegt werden). Oak Asset Management, LLCs Top-Bestände sind Apple Inc. (US:AAPL) , Amgen Inc. (US:AMGN) , NVIDIA Corporation (US:NVDA) , Chevron Corporation (US:CVX) , and RTX Corporation (US:RTX) . Oak Asset Management, LLCs neue Positionen sind Markel Group Inc. (US:MKL) , .
Top-Zuwächse in diesem Quartal
Wir verwenden die Veränderung der Portfolioallokation, weil dies die aussagekräftigste Kennzahl ist. Die Änderungen können auf Trades oder Änderungen der Aktienkurse zurückzuführen sein.
| Wertpapier | Aktien (MM) |
Wert (MM$) |
Portfolio % | ΔPortfolio % |
|---|---|---|---|---|
| AMGN / Amgen Inc. | 0,06 | 18,80 | 6,4133 | 0,7992 |
| AAPL / Apple Inc. | 0,13 | 35,31 | 12,0424 | 0,5477 |
| COST / Costco Wholesale Corporation | 0,01 | 4,92 | 1,6767 | 0,3831 |
| FDX / FedEx Corporation | 0,02 | 5,95 | 2,0280 | 0,3561 |
| GOOGL / Alphabet Inc. | 0,01 | 4,56 | 1,5565 | 0,3329 |
| GOOG / Alphabet Inc. | 0,01 | 4,13 | 1,4085 | 0,3122 |
| RTX / RTX Corporation | 0,06 | 10,92 | 3,7242 | 0,2855 |
| ISRG / Intuitive Surgical, Inc. | 0,01 | 3,22 | 1,0981 | 0,2285 |
| JNJ / Johnson & Johnson | 0,03 | 5,43 | 1,8508 | 0,1827 |
| CAT / Caterpillar Inc. | 0,00 | 2,63 | 0,8976 | 0,1387 |
Top-Rückgänge in diesem Quartal
Wir verwenden die Veränderung der Portfolioallokation, weil dies die aussagekräftigste Kennzahl ist. Änderungen können auf Handelsgeschäfte oder Änderungen der Aktienkurse zurückzuführen sein.
| Wertpapier | Aktien (MM) |
Wert (MM$) |
Portfolio % | ΔPortfolio % |
|---|---|---|---|---|
| ORCL / Oracle Corporation | 0,04 | 7,01 | 2,3895 | -1,0330 |
| FAST / Fastenal Company | 0,18 | 7,29 | 2,4853 | -0,5529 |
| STZ / Constellation Brands, Inc. | 0,01 | 0,92 | 0,3127 | -0,4769 |
| CMCSA / Comcast Corporation | 0,05 | 1,44 | 0,4918 | -0,3064 |
| AMT / American Tower Corporation | 0,01 | 2,08 | 0,7078 | -0,2297 |
| HD / The Home Depot, Inc. | 0,01 | 3,34 | 1,1389 | -0,2051 |
| MSFT / Microsoft Corporation | 0,02 | 7,51 | 2,5598 | -0,1958 |
| PEP / PepsiCo, Inc. | 0,02 | 2,34 | 0,7965 | -0,1484 |
| NVDA / NVIDIA Corporation | 0,10 | 17,75 | 6,0533 | -0,1402 |
| ABBV / AbbVie Inc. | 0,04 | 8,03 | 2,7380 | -0,1379 |
13F und Fondseinreichungen
Dieses Formular wurde am 2026-01-14 für den Berichtszeitraum eingereicht 2025-12-31. Klicken Sie auf das Link-Symbol , um den gesamten Transaktionsverlauf zu sehen.
Upgrade um die Prämiendaten zu entsperren und nach Excel zu exportieren ![]() .
.
| Wertpapier | Typ | Durchschnittlicher Aktienkurs | Aktien (MM) |
ΔAktien (%) |
Wert ($MM) |
ΔAktien (%) |
Portfolio (%) |
ΔPortfolio (%) |
|
|---|---|---|---|---|---|---|---|---|---|
| AAPL / Apple Inc. | 0,13 | -1,59 | 35,31 | 5,07 | 12,0424 | 0,5477 | |||
| AMGN / Amgen Inc. | 0,06 | -1,22 | 18,80 | 14,56 | 6,4133 | 0,7992 | |||
| NVDA / NVIDIA Corporation | 0,10 | -1,94 | 17,75 | -1,98 | 6,0533 | -0,1402 | |||
| CVX / Chevron Corporation | 0,08 | 1,07 | 12,10 | -0,80 | 4,1272 | -0,0455 | |||
| RTX / RTX Corporation | 0,06 | -0,90 | 10,92 | 8,61 | 3,7242 | 0,2855 | |||
| QCOM / QUALCOMM Incorporated | 0,06 | -0,13 | 10,23 | 2,69 | 3,4902 | 0,0814 | |||
| ABBV / AbbVie Inc. | 0,04 | -3,25 | 8,03 | -4,52 | 2,7380 | -0,1379 | |||
| MSFT / Microsoft Corporation | 0,02 | -0,23 | 7,51 | -6,84 | 2,5598 | -0,1958 | |||
| FAST / Fastenal Company | 0,18 | 0,25 | 7,29 | -17,97 | 2,4853 | -0,5529 | |||
| ORCL / Oracle Corporation | 0,04 | 1,03 | 7,01 | -29,99 | 2,3895 | -1,0330 | |||
| SYK / Stryker Corporation | 0,02 | 0,28 | 6,18 | -4,66 | 2,1077 | -0,1094 | |||
| FDX / FedEx Corporation | 0,02 | -0,69 | 5,95 | 21,67 | 2,0280 | 0,3561 | |||
| JPM / JPMorgan Chase & Co. | 0,02 | -0,72 | 5,76 | 1,41 | 1,9644 | 0,0218 | |||
| JNJ / Johnson & Johnson | 0,03 | -0,30 | 5,43 | 11,28 | 1,8508 | 0,1827 | |||
| V / Visa Inc. | 0,02 | 0,00 | 5,41 | 2,74 | 1,8440 | 0,0439 | |||
| MCD / McDonald's Corporation | 0,02 | 0,07 | 5,41 | 0,63 | 1,8436 | 0,0065 | |||
| LOW / Lowe's Companies, Inc. | 0,02 | 0,14 | 5,01 | -3,89 | 1,7086 | -0,0745 | |||
| COST / Costco Wholesale Corporation | 0,01 | 39,53 | 4,92 | 29,98 | 1,6767 | 0,3831 | |||
| GOOGL / Alphabet Inc. | 0,01 | -0,92 | 4,56 | 27,56 | 1,5565 | 0,3329 | |||
| GOOG / Alphabet Inc. | 0,01 | 0,00 | 4,13 | 28,83 | 1,4085 | 0,3122 | |||
| ICE / Intercontinental Exchange, Inc. | 0,02 | 1,86 | 3,93 | -2,07 | 1,3418 | -0,0325 | |||
| CVS / CVS Health Corporation | 0,05 | -2,76 | 3,88 | 2,35 | 1,3220 | 0,0268 | |||
| MDT / Medtronic plc | 0,04 | 0,10 | 3,80 | 0,96 | 1,2949 | 0,0087 | |||
| HD / The Home Depot, Inc. | 0,01 | 0,07 | 3,34 | -15,02 | 1,1389 | -0,2051 | |||
| NSC / Norfolk Southern Corporation | 0,01 | -0,40 | 3,23 | -4,30 | 1,1009 | -0,0525 | |||
| ISRG / Intuitive Surgical, Inc. | 0,01 | 0,00 | 3,22 | 26,63 | 1,0981 | 0,2285 | |||
| PG / The Procter & Gamble Company | 0,02 | 13,27 | 3,21 | 5,62 | 1,0958 | 0,0556 | |||
| CSCO / Cisco Systems, Inc. | 0,04 | -4,38 | 3,19 | 7,66 | 1,0889 | 0,0745 | |||
| DGRO / iShares Trust - iShares Core Dividend Growth ETF | 0,05 | 0,77 | 3,19 | 2,74 | 1,0879 | 0,0261 | |||
| MS / Morgan Stanley | 0,02 | -0,97 | 2,98 | 10,59 | 1,0150 | 0,0946 | |||
| AMZN / Amazon.com, Inc. | 0,01 | 0,12 | 2,88 | 5,23 | 0,9808 | 0,0462 | |||
| CAT / Caterpillar Inc. | 0,00 | -1,20 | 2,63 | 18,62 | 0,8976 | 0,1387 | |||
| PEP / PepsiCo, Inc. | 0,02 | -17,28 | 2,34 | -15,46 | 0,7965 | -0,1484 | |||
| EXPD / Expeditors International of Washington, Inc. | 0,02 | -8,43 | 2,28 | 11,31 | 0,7787 | 0,0771 | |||
| TGT / Target Corporation | 0,02 | -11,11 | 2,28 | -3,14 | 0,7784 | -0,0275 | |||
| WM / Waste Management, Inc. | 0,01 | 0,89 | 2,23 | 0,36 | 0,7619 | 0,0007 | |||
| AMT / American Tower Corporation | 0,01 | -17,06 | 2,08 | -24,30 | 0,7078 | -0,2297 | |||
| XOM / Exxon Mobil Corporation | 0,02 | 0,00 | 1,90 | 6,73 | 0,6497 | 0,0392 | |||
| MCHP / Microchip Technology Incorporated | 0,03 | 6,85 | 1,89 | 5,99 | 0,6458 | 0,0349 | |||
| INTC / Intel Corporation | 0,05 | -4,21 | 1,79 | 5,37 | 0,6090 | 0,0293 | |||
| CTAS / Cintas Corporation | 0,01 | 0,70 | 1,76 | -7,72 | 0,5997 | -0,0521 | |||
| META / Meta Platforms, Inc. | 0,00 | 4,68 | 1,70 | -5,93 | 0,5793 | -0,0382 | |||
| VZ / Verizon Communications Inc. | 0,04 | -1,85 | 1,68 | -9,04 | 0,5732 | -0,0588 | |||
| TROW / T. Rowe Price Group, Inc. | 0,02 | -10,76 | 1,65 | -10,98 | 0,5611 | -0,0711 | |||
| CHD / Church & Dwight Co., Inc. | 0,02 | 0,00 | 1,63 | -4,29 | 0,5553 | -0,0267 | |||
| GPC / Genuine Parts Company | 0,01 | -9,30 | 1,50 | -19,55 | 0,5111 | -0,1259 | |||
| ADP / Automatic Data Processing, Inc. | 0,01 | 19,65 | 1,49 | 4,86 | 0,5075 | 0,0221 | |||
| CMCSA / Comcast Corporation | 0,05 | -35,05 | 1,44 | -38,23 | 0,4918 | -0,3064 | |||
| AFL / Aflac Incorporated | 0,01 | -3,64 | 1,43 | -4,85 | 0,4882 | -0,0265 | |||
| GS / The Goldman Sachs Group, Inc. | 0,00 | 0,00 | 1,42 | 10,31 | 0,4857 | 0,0444 | |||
| ITW / Illinois Tool Works Inc. | 0,01 | -4,33 | 1,42 | -9,64 | 0,4829 | -0,0530 | |||
| BKNG / Booking Holdings Inc. | 0,00 | 0,00 | 1,31 | -0,76 | 0,4475 | -0,0050 | |||
| NKE / NIKE, Inc. | 0,02 | -9,10 | 1,29 | -16,94 | 0,4383 | -0,0910 | |||
| AXP / American Express Company | 0,00 | -3,85 | 1,27 | 7,06 | 0,4343 | 0,0276 | |||
| UNH / UnitedHealth Group Incorporated | 0,00 | -0,29 | 1,26 | -4,70 | 0,4293 | -0,0223 | |||
| WMT / Walmart Inc. | 0,01 | 0,00 | 1,25 | 8,12 | 0,4272 | 0,0309 | |||
| B / Barrick Mining Corporation | 0,03 | 0,00 | 1,24 | 33,01 | 0,4233 | 0,1039 | |||
| LMT / Lockheed Martin Corporation | 0,00 | 0,60 | 1,21 | -2,50 | 0,4127 | -0,0119 | |||
| IBM / International Business Machines Corporation | 0,00 | -0,29 | 1,20 | 4,70 | 0,4103 | 0,0172 | |||
| ABT / Abbott Laboratories | 0,01 | 0,00 | 1,17 | -6,50 | 0,3980 | -0,0287 | |||
| NEE / NextEra Energy, Inc. | 0,01 | 0,00 | 0,94 | 6,25 | 0,3192 | 0,0182 | |||
| STZ / Constellation Brands, Inc. | 0,01 | -61,23 | 0,92 | -60,31 | 0,3127 | -0,4769 | |||
| COR / Cencora, Inc. | 0,00 | 0,00 | 0,91 | 8,10 | 0,3099 | 0,0223 | |||
| TSLA / Tesla, Inc. | 0,00 | 0,00 | 0,88 | 1,14 | 0,3017 | 0,0025 | |||
| DIS / The Walt Disney Company | 0,01 | -1,30 | 0,86 | -1,94 | 0,2935 | -0,0067 | |||
| PNC / The PNC Financial Services Group, Inc. | 0,00 | 0,00 | 0,86 | 3,88 | 0,2923 | 0,0101 | |||
| REGN / Regeneron Pharmaceuticals, Inc. | 0,00 | 0,00 | 0,85 | 37,38 | 0,2896 | 0,0780 | |||
| BRK.B / Berkshire Hathaway Inc. | 0,00 | -3,00 | 0,81 | -3,11 | 0,2769 | -0,0094 | |||
| NFLX / Netflix, Inc. | 0,01 | 900,00 | 0,77 | -21,78 | 0,2609 | -0,0737 | |||
| SBUX / Starbucks Corporation | 0,01 | 0,00 | 0,76 | -0,39 | 0,2590 | -0,0019 | |||
| IJH / iShares Trust - iShares Core S&P Mid-Cap ETF | 0,01 | 1,39 | 0,69 | 2,53 | 0,2352 | 0,0052 | |||
| BAC / Bank of America Corporation | 0,01 | 0,00 | 0,62 | 6,69 | 0,2123 | 0,0126 | |||
| TOL / Toll Brothers, Inc. | 0,00 | 0,00 | 0,62 | -2,05 | 0,2121 | -0,0052 | |||
| DPZ / Domino's Pizza, Inc. | 0,00 | -1,71 | 0,60 | -5,23 | 0,2043 | -0,0116 | |||
| SAIC / Science Applications International Corporation | 0,01 | 0,00 | 0,59 | 1,20 | 0,2008 | 0,0020 | |||
| VIG / Vanguard Specialized Funds - Vanguard Dividend Appreciation ETF | 0,00 | 0,04 | 0,54 | 1,88 | 0,1854 | 0,0029 | |||
| SPY / SPDR S&P 500 ETF | 0,00 | 0,00 | 0,53 | 2,31 | 0,1814 | 0,0037 | |||
| VV / Vanguard Index Funds - Vanguard Large-Cap ETF | 0,00 | 0,00 | 0,43 | 2,39 | 0,1461 | 0,0028 | |||
| DLR / Digital Realty Trust, Inc. | 0,00 | -20,28 | 0,43 | -28,69 | 0,1452 | -0,0589 | |||
| ATO / Atmos Energy Corporation | 0,00 | 15,63 | 0,42 | 13,48 | 0,1438 | 0,0168 | |||
| MRK / Merck & Co., Inc. | 0,00 | 0,00 | 0,41 | 25,53 | 0,1409 | 0,0282 | |||
| KO / The Coca-Cola Company | 0,01 | -0,44 | 0,39 | 5,08 | 0,1342 | 0,0060 | |||
| CMI / Cummins Inc. | 0,00 | 0,00 | 0,38 | 20,63 | 0,1299 | 0,0221 | |||
| PH / Parker-Hannifin Corporation | 0,00 | 0,00 | 0,37 | 15,94 | 0,1268 | 0,0171 | |||
| CEG / Constellation Energy Corporation | 0,00 | 0,00 | 0,34 | 7,50 | 0,1175 | 0,0077 | |||
| SDY / SPDR Series Trust - State Street SPDR S&P Dividend ETF | 0,00 | 0,00 | 0,34 | -0,59 | 0,1151 | -0,0011 | |||
| T / AT&T Inc. | 0,01 | 0,00 | 0,33 | -12,16 | 0,1111 | -0,0156 | |||
| IUSG / iShares Trust - iShares Core S&P U.S. Growth ETF | 0,00 | 0,26 | 0,33 | 2,20 | 0,1110 | 0,0022 | |||
| URI / United Rentals, Inc. | 0,00 | 0,00 | 0,30 | -15,21 | 0,1027 | -0,0188 | |||
| SRE / Sempra | 0,00 | 0,00 | 0,30 | -1,64 | 0,1024 | -0,0023 | |||
| EQR / Equity Residential | 0,00 | 0,00 | 0,27 | -2,84 | 0,0937 | -0,0028 | |||
| EW / Edwards Lifesciences Corporation | 0,00 | -0,94 | 0,27 | 8,87 | 0,0921 | 0,0070 | |||
| VLO / Valero Energy Corporation | 0,00 | 0,00 | 0,27 | -4,27 | 0,0918 | -0,0045 | |||
| VUG / Vanguard Index Funds - Vanguard Growth ETF | 0,00 | 0,00 | 0,27 | 1,52 | 0,0917 | 0,0013 | |||
| UNP / Union Pacific Corporation | 0,00 | -2,98 | 0,26 | -5,05 | 0,0899 | -0,0051 | |||
| IUSV / iShares Trust - iShares Core S&P U.S. Value ETF | 0,00 | 0,56 | 0,26 | 3,20 | 0,0883 | 0,0025 | |||
| VST / Vistra Corp. | 0,00 | 0,00 | 0,26 | -17,83 | 0,0883 | -0,0192 | |||
| TSM / Taiwan Semiconductor Manufacturing Company Limited - Depositary Receipt (Common Stock) | 0,00 | 0,00 | 0,26 | 8,86 | 0,0881 | 0,0069 | |||
| FBIN / Fortune Brands Innovations, Inc. | 0,00 | 0,00 | 0,22 | -6,28 | 0,0766 | -0,0054 | |||
| VTV / Vanguard Index Funds - Vanguard Value ETF | 0,00 | 7,06 | 0,22 | 9,36 | 0,0760 | 0,0065 | |||
| IYW / iShares Trust - iShares U.S. Technology ETF | 0,00 | 4,78 | 0,22 | 6,86 | 0,0746 | 0,0046 | |||
| MKL / Markel Group Inc. | 0,00 | 0,21 | 0,0733 | 0,0733 | |||||
| VGT / Vanguard World Fund - Vanguard Information Technology ETF | 0,00 | 0,00 | 0,21 | 0,96 | 0,0720 | 0,0005 | |||
| VNQ / Vanguard Specialized Funds - Vanguard Real Estate ETF | 0,00 | -5,84 | 0,21 | -8,85 | 0,0706 | -0,0071 | |||
| UBER / Uber Technologies, Inc. | 0,00 | -100,00 | 0,00 | 0,0000 | |||||
| MDLZ / Mondelez International, Inc. | 0,00 | -100,00 | 0,00 | 0,0000 | |||||
| PKG / Packaging Corporation of America | 0,00 | -100,00 | 0,00 | 0,0000 |