Basisstatistiken
| Insider-Profil | PUNCH & ASSOCIATES INVESTMENT MANAGEMENT, INC. |
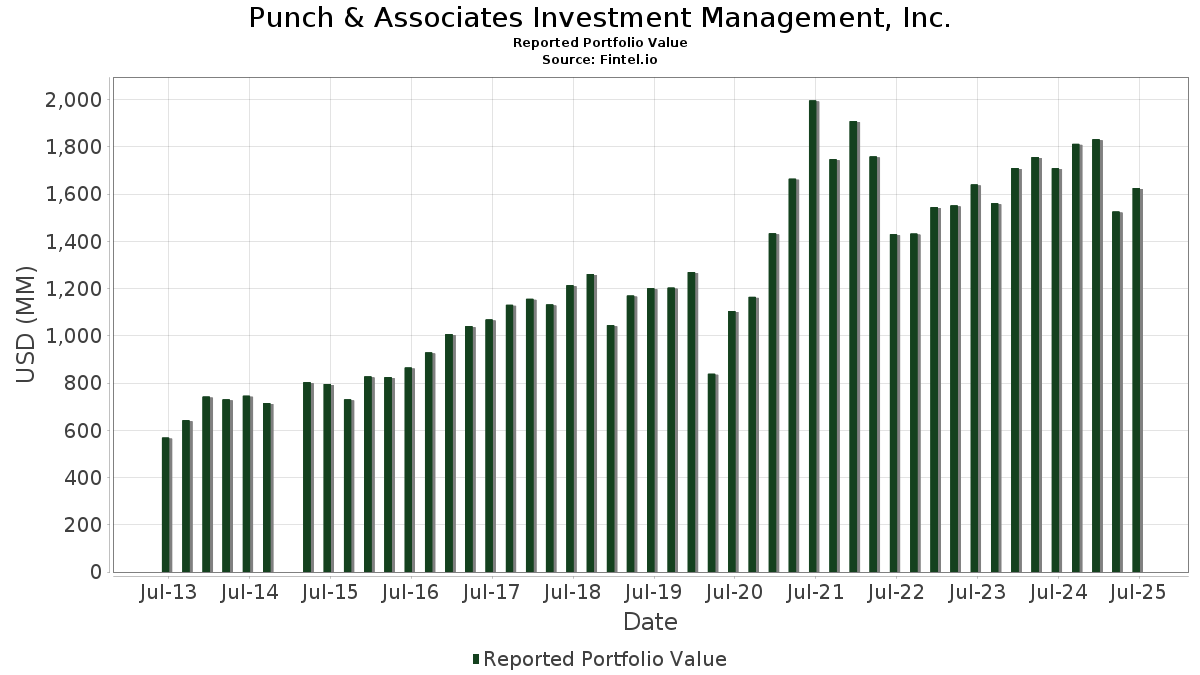
| Portfolio-Wert | $ 1.712.771.929 |
| Aktuelle Positionen | 156 |
Neueste Bestände, Performance, AUM (aus 13F, 13D)
Punch & Associates Investment Management, Inc. hat 156 Gesamtbeteiligungen in seinen letzten SEC-Einreichungen offengelegt. Der jüngste Portfoliowert wird auf $ 1.712.771.929 USD berechnet. Das tatsächliche verwaltete Vermögen (AUM) ist dieser Wert plus Barmittel (die nicht offengelegt werden). Punch & Associates Investment Management, Inc.s Top-Bestände sind StoneX Group Inc. (US:SNEX) , RadNet, Inc. (US:RDNT) , Laureate Education, Inc. (US:LAUR) , Alphabet Inc. (US:GOOGL) , and Arcosa, Inc. (US:ACA) . Punch & Associates Investment Management, Inc.s neue Positionen sind Marvell Technology, Inc. (US:MRVL) , CONV. NOTE (US:US87918AAF21) , SmartRent, Inc. (US:SMRT) , Miller Industries, Inc. (US:MLR) , and Avanos Medical, Inc. (US:AVNS) . Punch & Associates Investment Management, Inc.s wichtigste Branchen sind "Tobacco Products" (sic 21) , "Restaurants, Dining, Eating And Drinking Places" (sic 58) , and "Wholesale Trade-durable Goods" (sic 50) .
Top-Zuwächse in diesem Quartal
Wir verwenden die Veränderung der Portfolioallokation, weil dies die aussagekräftigste Kennzahl ist. Die Änderungen können auf Trades oder Änderungen der Aktienkurse zurückzuführen sein.
| Wertpapier | Aktien (MM) |
Wert (MM$) |
Portfolio % | ΔPortfolio % |
|---|---|---|---|---|
| SPNT / SiriusPoint Ltd. | 1,39 | 30,43 | 1,7766 | 0,7894 |
| ENVA / Enova International, Inc. | 0,15 | 23,67 | 1,3820 | 0,7385 |
| GOOGL / Alphabet Inc. | 0,13 | 41,21 | 2,4058 | 0,5163 |
| ISSC / Innovative Aerosystems, Inc. | 0,60 | 11,27 | 0,6581 | 0,4361 |
| MRVL / Marvell Technology, Inc. | 0,08 | 6,59 | 0,3850 | 0,3850 |
| TCMD / Tactile Systems Technology, Inc. | 0,37 | 10,85 | 0,6332 | 0,3555 |
| ACA / Arcosa, Inc. | 0,36 | 38,43 | 2,2440 | 0,2688 |
| LZ / LegalZoom.com, Inc. | 2,63 | 26,09 | 1,5231 | 0,2436 |
| PAYS / Paysign, Inc. | 1,46 | 7,53 | 0,4398 | 0,2382 |
| SMRT / SmartRent, Inc. | 1,91 | 3,85 | 0,2249 | 0,2249 |
Top-Rückgänge in diesem Quartal
Wir verwenden die Veränderung der Portfolioallokation, weil dies die aussagekräftigste Kennzahl ist. Änderungen können auf Handelsgeschäfte oder Änderungen der Aktienkurse zurückzuführen sein.
| Wertpapier | Aktien (MM) |
Wert (MM$) |
Portfolio % | ΔPortfolio % |
|---|---|---|---|---|
| FISV / Fiserv, Inc. | 0,03 | 2,03 | 0,1182 | -0,5433 |
| CIVI / Civitas Resources, Inc. | 0,00 | 0,00 | -0,4884 | |
| UTI / Universal Technical Institute, Inc. | 1,17 | 30,57 | 1,7847 | -0,4084 |
| PDX / PIMCO Dynamic Income Strategy Fund | 1,06 | 19,82 | 1,1574 | -0,3765 |
| FC / Franklin Covey Co. | 0,31 | 5,25 | 0,3065 | -0,3588 |
| IIIV / i3 Verticals, Inc. | 0,78 | 19,59 | 1,1435 | -0,3195 |
| SFM / Sprouts Farmers Market, Inc. | 0,17 | 13,75 | 0,8029 | -0,2875 |
| ORCL / Oracle Corporation | 0,06 | 11,60 | 0,6771 | -0,2842 |
| PARR / Par Pacific Holdings, Inc. | 0,58 | 20,43 | 1,1927 | -0,2721 |
| ACN / Accenture plc | 0,01 | 3,90 | 0,2278 | -0,2481 |
13D/G Einreichungen
Dies ist eine Liste der 13D- und 13G-Einreichungen des letzten Jahres (falls vorhanden). Klicken Sie auf das Link-Symbol, um die vollständige Transaktionshistorie anzuzeigen. Grüne Zeilen zeigen neue Positionen an. Rote Zeilen zeigen geschlossene Positionen an.
| Datei Datum | Formular | Wertpapier | Vorherige Aktien |
Aktuelle Aktien |
ΔAktien % | % Eigentümerschaft |
% ΔEigentümerschaft | |
|---|---|---|---|---|---|---|---|---|
| 2025-08-14 | RFIL / RF Industries, Ltd. | 678.797 | 810.859 | 19,46 | 7,60 | 18,75 | ||
| 2025-08-14 | OPXS / Optex Systems Holdings, Inc | 372.500 | 331.495 | -11,01 | 4,80 | -11,11 | ||
| 2025-08-14 | DSP / Viant Technology Inc. | 989.771 | 1.155.133 | 16,71 | 7,30 | 19,67 | ||
| 2025-05-15 | SYZLF / Sylogist Ltd. | 1.319.500 | 968.000 | -26,64 | 4,10 | -26,79 | ||
| 2025-05-15 | ALOT / AstroNova, Inc. | 495.951 | 301.429 | -39,22 | 4,00 | -40,30 | ||
| 2025-05-15 | FC / Franklin Covey Co. | 679.100 | 586.071 | -13,70 | 4,40 | -15,38 | ||
| 2025-05-15 | PHX / PHX Minerals Inc. | 2.745.884 | 1.582.234 | -42,38 | 4,20 | -43,24 | ||
| 2025-04-07 | HBIO / Harvard Bioscience, Inc. | 2.918.034 | 25.586 | -99,12 | 0,10 | -98,53 |
13F und Fondseinreichungen
Dieses Formular wurde am 2026-02-17 für den Berichtszeitraum eingereicht 2025-12-31. Klicken Sie auf das Link-Symbol , um den gesamten Transaktionsverlauf zu sehen.
Upgrade um die Prämiendaten zu entsperren und nach Excel zu exportieren ![]() .
.
| Wertpapier | Typ | Durchschnittlicher Aktienkurs | Aktien (MM) |
ΔAktien (%) |
Wert ($MM) |
ΔWert (%) |
Portfolio (%) |
ΔPortfolio (%) |
|
|---|---|---|---|---|---|---|---|---|---|
| SNEX / StoneX Group Inc. | 0,71 | -0,42 | 67,34 | -6,14 | 3,9314 | -0,2273 | |||
| RDNT / RadNet, Inc. | 0,65 | 0,28 | 46,46 | -6,12 | 2,7126 | -0,1563 | |||
| LAUR / Laureate Education, Inc. | 1,27 | -1,04 | 42,84 | 5,64 | 2,5014 | 0,1505 | |||
| GOOGL / Alphabet Inc. | 0,13 | -1,81 | 41,21 | 26,42 | 2,4058 | 0,5163 | |||
| ACA / Arcosa, Inc. | 0,36 | -0,58 | 38,43 | 12,80 | 2,2440 | 0,2688 | |||
| GSL / Global Ship Lease, Inc. | 0,97 | -11,45 | 34,05 | 1,07 | 1,9881 | 0,0350 | |||
| UTI / Universal Technical Institute, Inc. | 1,17 | 0,65 | 30,57 | -19,20 | 1,7847 | -0,4084 | |||
| SPNT / SiriusPoint Ltd. | 1,39 | 47,67 | 30,43 | 78,69 | 1,7766 | 0,7894 | |||
| SILA / Sila Realty Trust, Inc. | 1,26 | 10,57 | 29,26 | 2,68 | 1,7085 | 0,0565 | |||
| VTS / Vitesse Energy, Inc. | 1,44 | 13,00 | 27,71 | -6,31 | 1,6176 | -0,0967 | |||
| LQDT / Liquidity Services, Inc. | 0,91 | 0,06 | 27,59 | 10,56 | 1,6108 | 0,1642 | |||
| LZ / LegalZoom.com, Inc. | 2,63 | 23,55 | 26,09 | 18,20 | 1,5231 | 0,2436 | |||
| ATEN / A10 Networks, Inc. | 1,44 | 0,30 | 25,40 | -2,24 | 1,4828 | -0,0233 | |||
| VRRM / Verra Mobility Corporation | 1,13 | -0,10 | 25,27 | -9,36 | 1,4753 | -0,1408 | |||
| FIBK / First Interstate BancSystem, Inc. | 0,72 | -0,05 | 25,04 | 8,52 | 1,4622 | 0,1243 | |||
| TREE / LendingTree, Inc. | 0,47 | 35,09 | 24,93 | 10,80 | 1,4557 | 0,1512 | |||
| CVCO / Cavco Industries, Inc. | 0,04 | -1,49 | 24,84 | 0,21 | 1,4503 | 0,0133 | |||
| ENVA / Enova International, Inc. | 0,15 | 56,12 | 23,67 | 113,24 | 1,3820 | 0,7385 | |||
| RPRX / Royalty Pharma plc | 0,60 | 0,72 | 23,19 | 10,31 | 1,3540 | 0,1353 | |||
| NPKI / NPK International Inc. | 1,85 | -2,21 | 22,09 | 3,06 | 1,2895 | 0,0472 | |||
| GRBK / Green Brick Partners, Inc. | 0,35 | -0,75 | 22,07 | -15,80 | 1,2887 | -0,2309 | |||
| KKR / KKR & Co. Inc. | 0,16 | 1,13 | 20,59 | -0,80 | 1,2021 | -0,0010 | |||
| PARR / Par Pacific Holdings, Inc. | 0,58 | -18,51 | 20,43 | -19,16 | 1,1927 | -0,2721 | |||
| PLOW / Douglas Dynamics, Inc. | 0,61 | -0,02 | 20,07 | 4,43 | 1,1718 | 0,0577 | |||
| IQV / IQVIA Holdings Inc. | 0,09 | 1,11 | 19,92 | 20,00 | 1,1633 | 0,2007 | |||
| PDX / PIMCO Dynamic Income Strategy Fund | 1,06 | -0,55 | 19,82 | -25,08 | 1,1574 | -0,3765 | |||
| ADUS / Addus HomeCare Corporation | 0,18 | 27,36 | 19,65 | 15,92 | 1,1471 | 0,1645 | |||
| IIIV / i3 Verticals, Inc. | 0,78 | 0,01 | 19,59 | -22,39 | 1,1435 | -0,3195 | |||
| PSMT / PriceSmart, Inc. | 0,16 | -0,04 | 19,58 | 1,19 | 1,1432 | 0,0214 | |||
| BXC / BlueLinx Holdings Inc. | 0,32 | -1,84 | 19,37 | -17,48 | 1,1310 | -0,2299 | |||
| ULTA / Ulta Beauty, Inc. | 0,03 | -5,54 | 18,83 | 4,52 | 1,0994 | 0,0551 | |||
| MSFT / Microsoft Corporation | 0,04 | 0,66 | 17,86 | -6,02 | 1,0425 | -0,0588 | |||
| APAM / Artisan Partners Asset Management Inc. | 0,44 | -0,91 | 17,84 | -6,98 | 1,0415 | -0,0702 | |||
| RTO / Rentokil Initial plc - Depositary Receipt (Common Stock) | 0,60 | 0,92 | 17,75 | 17,75 | 1,0366 | 0,1625 | |||
| MELI / MercadoLibre, Inc. | 0,01 | 9,16 | 17,26 | -5,91 | 1,0078 | -0,0558 | |||
| BG / Bunge Global SA | 0,19 | 1,03 | 16,93 | 10,77 | 0,9884 | 0,1024 | |||
| TDW / Tidewater Inc. | 0,33 | -2,46 | 16,85 | -7,62 | 0,9840 | -0,0736 | |||
| TMO / Thermo Fisher Scientific Inc. | 0,03 | 0,61 | 15,82 | 20,21 | 0,9234 | 0,1607 | |||
| WTTR / Select Water Solutions, Inc. | 1,50 | -15,78 | 15,79 | -17,12 | 0,9220 | -0,1826 | |||
| BRK.B / Berkshire Hathaway Inc. | 0,03 | 0,98 | 15,64 | 0,96 | 0,9131 | 0,0151 | |||
| HLMN / Hillman Solutions Corp. | 1,74 | 0,03 | 15,10 | -5,64 | 0,8817 | -0,0460 | |||
| JPM / JPMorgan Chase & Co. | 0,05 | 1,02 | 14,83 | 3,20 | 0,8661 | 0,0328 | |||
| CSW / CSW Industrials, Inc. | 0,05 | 0,18 | 14,68 | 21,14 | 0,8572 | 0,1546 | |||
| DSP / Viant Technology Inc. | 1,16 | -3,55 | 13,93 | 34,57 | 0,8133 | 0,2132 | |||
| BV / BrightView Holdings, Inc. | 1,09 | -0,42 | 13,87 | -5,85 | 0,8096 | -0,0442 | |||
| CLMB / Climb Global Solutions, Inc. | 0,13 | 4,97 | 13,85 | -19,98 | 0,8085 | -0,1947 | |||
| SHOO / Steven Madden, Ltd. | 0,33 | 0,12 | 13,82 | 24,52 | 0,8070 | 0,1635 | |||
| SFM / Sprouts Farmers Market, Inc. | 0,17 | -0,16 | 13,75 | -26,89 | 0,8029 | -0,2875 | |||
| MDXG / MiMedx Group, Inc. | 2,01 | 0,11 | 13,59 | -2,90 | 0,7934 | -0,0179 | |||
| DIS / The Walt Disney Company | 0,12 | 1,01 | 13,24 | 0,36 | 0,7728 | 0,0083 | |||
| BLDR / Builders FirstSource, Inc. | 0,13 | 0,30 | 13,17 | -14,89 | 0,7692 | -0,1281 | |||
| BRSP / BrightSpire Capital, Inc. | 2,33 | -0,10 | 13,07 | 3,03 | 0,7630 | 0,0277 | |||
| AMP / Ameriprise Financial, Inc. | 0,03 | 0,27 | 12,90 | 0,08 | 0,7534 | 0,0059 | |||
| ARHS / Arhaus, Inc. | 1,09 | 0,18 | 12,25 | 5,65 | 0,7154 | 0,0430 | |||
| APO / Apollo Global Management, Inc. | 0,08 | 25,29 | 12,11 | 36,09 | 0,7069 | 0,1912 | |||
| MTCH / Match Group, Inc. | 0,37 | 13,78 | 11,85 | 4,02 | 0,6919 | 0,0314 | |||
| KMI / Kinder Morgan, Inc. | 0,43 | 0,99 | 11,83 | -1,93 | 0,6908 | -0,0086 | |||
| JNJ / Johnson & Johnson | 0,06 | 1,49 | 11,74 | 13,28 | 0,6854 | 0,0846 | |||
| ALG / Alamo Group Inc. | 0,07 | 0,07 | 11,74 | -12,00 | 0,6853 | -0,0879 | |||
| FTHY / First Trust High Yield Opportunities 2027 Term Fund | 0,83 | 48,56 | 11,64 | 44,24 | 0,6794 | 0,2118 | |||
| ORCL / Oracle Corporation | 0,06 | 0,91 | 11,60 | -30,06 | 0,6771 | -0,2842 | |||
| ISSC / Innovative Aerosystems, Inc. | 0,60 | 94,06 | 11,27 | 194,31 | 0,6581 | 0,4361 | |||
| DE / Deere & Company | 0,02 | 0,86 | 10,91 | 2,68 | 0,6371 | 0,0211 | |||
| TCMD / Tactile Systems Technology, Inc. | 0,37 | 8,05 | 10,85 | 126,41 | 0,6332 | 0,3555 | |||
| SSNC / SS&C Technologies Holdings, Inc. | 0,12 | 1,01 | 10,54 | -0,51 | 0,6152 | 0,0012 | |||
| CSV / Carriage Services, Inc. | 0,25 | 16,68 | 10,44 | 10,82 | 0,6093 | 0,0634 | |||
| HSTM / HealthStream, Inc. | 0,45 | -0,13 | 10,42 | -18,42 | 0,6085 | -0,1320 | |||
| UNH / UnitedHealth Group Incorporated | 0,03 | 15,63 | 10,14 | 10,54 | 0,5922 | 0,0603 | |||
| WM / Waste Management, Inc. | 0,05 | 1,05 | 10,02 | 0,53 | 0,5848 | 0,0072 | |||
| ACIC / American Coastal Insurance Corporation | 0,78 | 7,25 | 9,81 | 18,92 | 0,5725 | 0,0945 | |||
| EOG / EOG Resources, Inc. | 0,09 | 0,23 | 9,44 | -6,13 | 0,5512 | -0,0318 | |||
| BXMT / Blackstone Mortgage Trust, Inc. | 0,48 | 0,18 | 9,19 | 4,10 | 0,5368 | 0,0248 | |||
| RSG / Republic Services, Inc. | 0,04 | 0,72 | 8,90 | -6,98 | 0,5195 | -0,0350 | |||
| LINC / Lincoln Educational Services Corporation | 0,36 | -2,54 | 8,75 | 0,15 | 0,5108 | 0,0044 | |||
| TGT / Target Corporation | 0,09 | -0,57 | 8,38 | 8,36 | 0,4895 | 0,0410 | |||
| HCKT / The Hackett Group, Inc. | 0,43 | -0,37 | 8,38 | 2,88 | 0,4894 | 0,0171 | |||
| LEGH / Legacy Housing Corporation | 0,43 | 0,00 | 8,38 | -29,04 | 0,4890 | -0,1953 | |||
| IDR / Idaho Strategic Resources, Inc. | 0,21 | -1,57 | 8,32 | 17,39 | 0,4856 | 0,0749 | |||
| CLFD / Clearfield, Inc. | 0,28 | 5,90 | 8,11 | -10,21 | 0,4733 | -0,0501 | |||
| NRIM / Northrim BanCorp, Inc. | 0,30 | 22,39 | 8,06 | 50,37 | 0,4706 | 0,1598 | |||
| BWB / Bridgewater Bancshares, Inc. | 0,44 | 1,15 | 7,69 | 0,75 | 0,4493 | 0,0065 | |||
| PAYS / Paysign, Inc. | 1,46 | 164,60 | 7,53 | 116,69 | 0,4398 | 0,2382 | |||
| INFU / InfuSystem Holdings, Inc. | 0,82 | 1,85 | 7,40 | -11,81 | 0,4319 | -0,0544 | |||
| APEI / American Public Education, Inc. | 0,20 | 0,00 | 7,38 | -4,24 | 0,4311 | -0,0158 | |||
| RSSS / Research Solutions, Inc. | 2,50 | 0,00 | 7,35 | -21,19 | 0,4290 | -0,1114 | |||
| NATR / Nature's Sunshine Products, Inc. | 0,34 | 8,97 | 7,34 | 51,53 | 0,4284 | 0,1477 | |||
| AGYS / Agilysys, Inc. | 0,06 | -0,37 | 7,33 | 12,49 | 0,4281 | 0,0502 | |||
| BA.PRA / The Boeing Company - Preferred Security | 0,11 | -0,22 | 7,32 | -0,95 | 0,4274 | -0,0010 | |||
| MYFW / First Western Financial, Inc. | 0,27 | -13,02 | 7,26 | 1,28 | 0,4241 | 0,0083 | |||
| ALEX / Alexander & Baldwin, Inc. | 0,35 | 33,87 | 7,20 | 51,91 | 0,4202 | 0,1455 | |||
| ELV / Elevance Health, Inc. | 0,02 | -15,70 | 6,87 | -8,55 | 0,4011 | -0,0344 | |||
| MRVL / Marvell Technology, Inc. | 0,08 | 6,59 | 0,3850 | 0,3850 | |||||
| RMT / Royce Micro-Cap Trust, Inc. | 0,62 | -0,12 | 6,42 | 0,27 | 0,3751 | 0,0037 | |||
| NVEC / NVE Corporation | 0,10 | 17,40 | 6,04 | 6,72 | 0,3525 | 0,0245 | |||
| DUK / Duke Energy Corporation | 0,05 | 0,37 | 5,58 | -4,94 | 0,3259 | -0,0145 | |||
| ELMD / Electromed, Inc. | 0,19 | 6,55 | 5,45 | 26,39 | 0,3180 | 0,0682 | |||
| FC / Franklin Covey Co. | 0,31 | -47,09 | 5,25 | -54,27 | 0,3065 | -0,3588 | |||
| T / AT&T Inc. | 0,21 | -0,36 | 5,16 | -12,36 | 0,3014 | -0,0401 | |||
| RFIL / RF Industries, Ltd. | 0,88 | 9,23 | 5,07 | -23,30 | 0,2960 | -0,0871 | |||
| UFPT / UFP Technologies, Inc. | 0,02 | 0,00 | 5,04 | 11,26 | 0,2943 | 0,0316 | |||
| VMD / Viemed Healthcare, Inc. | 0,67 | 0,00 | 4,99 | 9,43 | 0,2912 | 0,0270 | |||
| ALNT / Allient Inc. | 0,09 | 0,00 | 4,81 | 20,10 | 0,2809 | 0,0487 | |||
| US87918AAF21 / CONV. NOTE | 4,74 | 1,50 | 0,2766 | 0,0060 | |||||
| GLRE / Greenlight Capital Re, Ltd. | 0,32 | -34,27 | 4,62 | -24,54 | 0,2698 | -0,0852 | |||
| CVEO / Civeo Corporation | 0,20 | -28,65 | 4,50 | -29,06 | 0,2625 | -0,1049 | |||
| OPXS / Optex Systems Holdings, Inc | 0,30 | -7,16 | 4,21 | 2,11 | 0,2459 | 0,0068 | |||
| GHM / Graham Corporation | 0,07 | -3,32 | 4,21 | 13,12 | 0,2456 | 0,0300 | |||
| AMLP / ALPS ETF Trust - Alerian MLP ETF | 0,09 | -0,38 | 4,10 | -0,19 | 0,2392 | 0,0012 | |||
| SJT / San Juan Basin Royalty Trust | 0,70 | 57,76 | 3,93 | 46,85 | 0,2297 | 0,0743 | |||
| ACN / Accenture plc | 0,01 | -56,31 | 3,90 | -52,47 | 0,2278 | -0,2481 | |||
| SMRT / SmartRent, Inc. | 1,91 | 3,85 | 0,2249 | 0,2249 | |||||
| FLXS / Flexsteel Industries, Inc. | 0,09 | 23,78 | 3,59 | 5,46 | 0,2098 | 0,0123 | |||
| BCIC / BCP Investment Corp. | 0,30 | -18,06 | 3,54 | -15,94 | 0,2067 | -0,0374 | |||
| TRNS / Transcat, Inc. | 0,06 | 2,96 | 3,36 | -20,21 | 0,1962 | -0,0479 | |||
| QXO.PRB / QXO, Inc. - Corporate Bond/Note | 0,06 | 0,03 | 3,14 | 0,32 | 0,1836 | 0,0019 | |||
| KKR.PRD / KKR & Co. Inc. - Preferred Stock | 0,06 | 0,26 | 3,13 | -0,73 | 0,1828 | -0,0000 | |||
| PLBC / Plumas Bancorp | 0,07 | 10,78 | 3,10 | 14,76 | 0,1808 | 0,0244 | |||
| KEQU / Kewaunee Scientific Corporation | 0,08 | 16,77 | 3,06 | 2,41 | 0,1787 | 0,0055 | |||
| MLR / Miller Industries, Inc. | 0,08 | 3,03 | 0,1771 | 0,1771 | |||||
| AVNS / Avanos Medical, Inc. | 0,27 | 3,03 | 0,1770 | 0,1770 | |||||
| TAYD / Taylor Devices, Inc. | 0,05 | 0,00 | 3,00 | 19,14 | 0,1752 | 0,0292 | |||
| HGBL / Heritage Global Inc. | 2,38 | -3,66 | 2,96 | -28,04 | 0,1726 | -0,0655 | |||
| MLCI / Mount Logan Capital Inc. | 0,36 | -12,42 | 2,93 | -7,37 | 0,1710 | -0,0123 | |||
| RCMT / RCM Technologies, Inc. | 0,14 | 39,99 | 2,78 | 7,83 | 0,1624 | 0,0128 | |||
| HTLD / Heartland Express, Inc. | 0,29 | 2,62 | 0,1529 | 0,1529 | |||||
| FFWM / First Foundation Inc. | 0,42 | 1.477,18 | 2,56 | 1.654,79 | 0,1496 | 0,1411 | |||
| PDEX / Pro-Dex, Inc. | 0,06 | 23,44 | 2,31 | 40,30 | 0,1348 | 0,0394 | |||
| HCI / HCI Group, Inc. | 0,01 | -2,28 | 2,30 | -2,38 | 0,1343 | -0,0023 | |||
| MAMA / Mama's Creations, Inc. | 0,17 | 0,00 | 2,23 | 28,32 | 0,1300 | 0,0294 | |||
| FISV / Fiserv, Inc. | 0,03 | -65,94 | 2,03 | -82,26 | 0,1182 | -0,5433 | |||
| IWV / iShares Trust - iShares Russell 3000 ETF | 0,01 | 3,37 | 1,97 | 5,57 | 0,1150 | 0,0068 | |||
| LGCY / Legacy Education Inc. | 0,18 | 9,79 | 1,89 | 16,94 | 0,1101 | 0,0166 | |||
| EPSN / Epsilon Energy Ltd. | 0,38 | 20,84 | 1,75 | 11,20 | 0,1021 | 0,0110 | |||
| IRMD / IRADIMED CORPORATION | 0,02 | 0,00 | 1,65 | 36,72 | 0,0966 | 0,0264 | |||
| NBN / Northeast Bank | 0,01 | -0,64 | 1,53 | 3,10 | 0,0894 | 0,0033 | |||
| IJR / iShares Trust - iShares Core S&P Small-Cap ETF | 0,01 | 12.927,37 | 1,49 | 13.418,18 | 0,0868 | 0,0862 | |||
| KRT / Karat Packaging Inc. | 0,06 | 1,79 | 1,41 | -8,84 | 0,0825 | -0,0074 | |||
| ACCS / ACCESS Newswire Inc. | 0,14 | 3,00 | 1,32 | -10,72 | 0,0773 | -0,0087 | |||
| AVNW / Aviat Networks, Inc. | 0,05 | -31,72 | 1,06 | -36,34 | 0,0618 | -0,0346 | |||
| LFT / Lument Finance Trust, Inc. | 0,27 | -62,23 | 0,38 | -73,67 | 0,0220 | -0,0608 | |||
| TLN / Talen Energy Corporation | 0,00 | -11,63 | 0,28 | -22,19 | 0,0166 | -0,0046 | |||
| VBR / Vanguard Index Funds - Vanguard Small-Cap Value ETF | 0,00 | 2,98 | 0,26 | 4,51 | 0,0149 | 0,0007 | |||
| JEF / Jefferies Financial Group Inc. | 0,00 | -32,94 | 0,23 | -36,49 | 0,0133 | -0,0075 | |||
| LAMR / Lamar Advertising Company | 0,00 | 0,21 | 0,0120 | 0,0120 | |||||
| VTI / Vanguard Index Funds - Vanguard Total Stock Market ETF | 0,00 | 1,13 | 0,15 | 3,45 | 0,0088 | 0,0003 | |||
| IWM / iShares Trust - iShares Russell 2000 ETF | 0,00 | 172,97 | 0,12 | 181,82 | 0,0073 | 0,0047 | |||
| CION / CION Investment Corporation | 0,01 | 0,10 | 0,0059 | 0,0059 | |||||
| IWC / iShares Trust - iShares Micro-Cap ETF | 0,00 | 0,00 | 0,06 | 5,56 | 0,0034 | 0,0002 | |||
| VOO / Vanguard Index Funds - Vanguard S&P 500 ETF | 0,00 | 0,00 | 0,04 | 2,70 | 0,0023 | 0,0001 | |||
| AGG / iShares Trust - iShares Core U.S. Aggregate Bond ETF | 0,00 | 0,00 | 0,03 | -3,33 | 0,0017 | 0,0000 | |||
| SUSA / iShares Trust - iShares ESG Optimized MSCI USA ETF | 0,00 | 0,00 | 0,03 | 4,00 | 0,0015 | 0,0001 | |||
| IVV / iShares Trust - iShares Core S&P 500 ETF | 0,00 | 0,00 | 0,02 | 5,56 | 0,0011 | 0,0000 | |||
| HYG / iShares Trust - iShares iBoxx $ High Yield Corporate Bond ETF | 0,00 | 0,00 | 0,01 | 0,00 | 0,0005 | 0,0000 | |||
| IEFA / iShares Trust - iShares Core MSCI EAFE ETF | 0,00 | 0,00 | 0,01 | 20,00 | 0,0004 | 0,0000 | |||
| LQD / iShares Trust - iShares iBoxx $ Investment Grade Corporate Bond ETF | 0,00 | 0,00 | 0,01 | 0,00 | 0,0003 | -0,0000 | |||
| IVE / iShares Trust - iShares S&P 500 Value ETF | 0,00 | 33,33 | 0,00 | 33,33 | 0,0003 | 0,0001 | |||
| SKY / Champion Homes, Inc. | 0,00 | -100,00 | 0,00 | 0,0000 | |||||
| DHIL / Diamond Hill Investment Group, Inc. | 0,00 | -100,00 | 0,00 | 0,0000 | |||||
| LADR / Ladder Capital Corp | 0,00 | -100,00 | 0,00 | 0,0000 | |||||
| KD / Kyndryl Holdings, Inc. | 0,00 | -100,00 | 0,00 | 0,0000 | |||||
| QRHC / Quest Resource Holding Corporation | 0,00 | -100,00 | 0,00 | 0,0000 | |||||
| ARE / Alexandria Real Estate Equities, Inc. | 0,00 | -100,00 | 0,00 | 0,0000 | |||||
| GAMB / Gambling.com Group Limited | 0,00 | -100,00 | 0,00 | 0,0000 | |||||
| CIVI / Civitas Resources, Inc. | 0,00 | -100,00 | 0,00 | -100,00 | -0,4884 | ||||
| PHLT / Performant Healthcare, Inc. | 0,00 | -100,00 | 0,00 | 0,0000 | |||||
| LOPE / Grand Canyon Education, Inc. | 0,00 | -100,00 | 0,00 | 0,0000 | |||||
| PBPB / Potbelly Corporation | 0,00 | -100,00 | 0,00 | 0,0000 |