Basisstatistiken
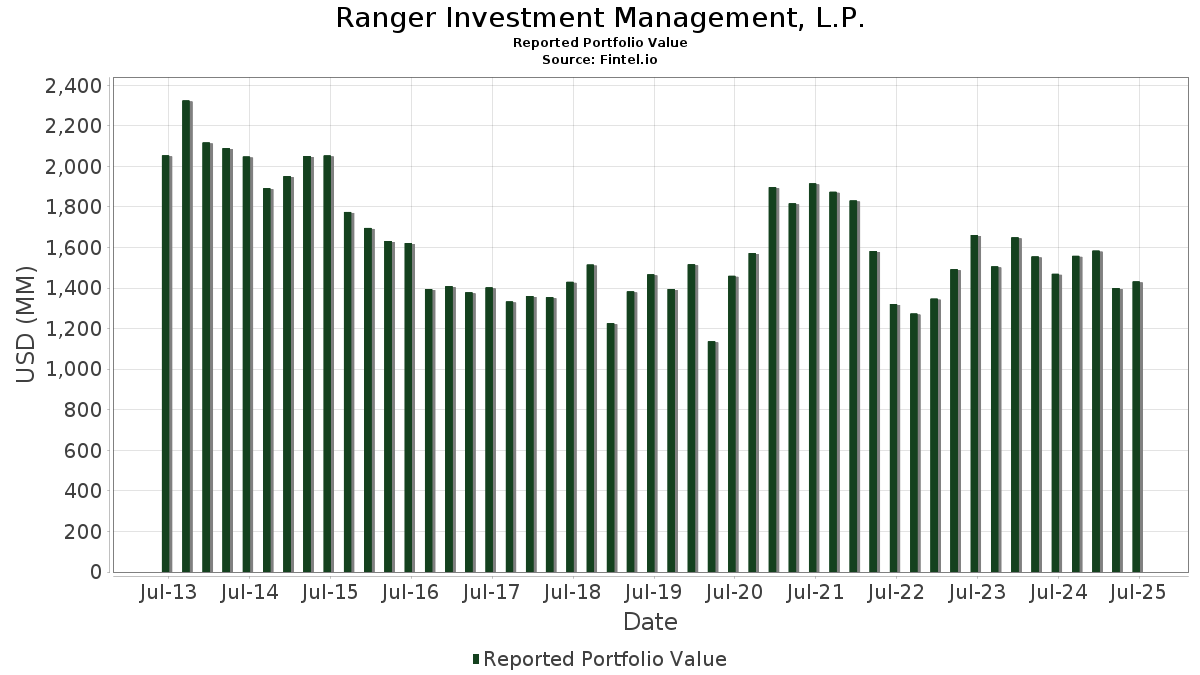
| Portfolio-Wert | $ 1.434.332.976 |
| Aktuelle Positionen | 76 |
Neueste Bestände, Performance, AUM (aus 13F, 13D)
Ranger Investment Management, L.P. hat 76 Gesamtbeteiligungen in seinen letzten SEC-Einreichungen offengelegt. Der jüngste Portfoliowert wird auf $ 1.434.332.976 USD berechnet. Das tatsächliche verwaltete Vermögen (AUM) ist dieser Wert plus Barmittel (die nicht offengelegt werden). Ranger Investment Management, L.P.s Top-Bestände sind Pegasystems Inc. (US:PEGA) , Ligand Pharmaceuticals Incorporated (US:LGND) , Excelerate Energy, Inc. (US:EE) , AAON, Inc. (US:AAON) , and ADMA Biologics, Inc. (US:ADMA) . Ranger Investment Management, L.P.s neue Positionen sind Celsius Holdings, Inc. (US:CELH) , Karman Holdings Inc. (US:KRMN) , Solaris Oilfield Infrastructure, Inc. (US:SOI) , Coastal Financial Corporation (US:CCB) , and MACOM Technology Solutions Holdings, Inc. (US:MTSI) . Ranger Investment Management, L.P.s wichtigste Branchen sind "Paper And Allied Products" (sic 26) , "Transportation Services" (sic 47) , and "Wholesale Trade-non-durable Goods" (sic 51) .
Top-Zuwächse in diesem Quartal
Wir verwenden die Veränderung der Portfolioallokation, weil dies die aussagekräftigste Kennzahl ist. Die Änderungen können auf Trades oder Änderungen der Aktienkurse zurückzuführen sein.
| Wertpapier | Aktien (MM) |
Wert (MM$) |
Portfolio % | ΔPortfolio % |
|---|---|---|---|---|
| AGX / Argan, Inc. | 0,10 | 28,10 | 1,9591 | 1,7532 |
| CELH / Celsius Holdings, Inc. | 0,36 | 20,78 | 1,4487 | 1,4487 |
| KRMN / Karman Holdings Inc. | 0,27 | 19,14 | 1,3347 | 1,3347 |
| SOI / Solaris Oilfield Infrastructure, Inc. | 0,43 | 17,03 | 1,1875 | 1,1875 |
| CCB / Coastal Financial Corporation | 0,16 | 16,89 | 1,1779 | 1,1779 |
| BLD / TopBuild Corp. | 0,06 | 25,03 | 1,7448 | 1,0478 |
| MTSI / MACOM Technology Solutions Holdings, Inc. | 0,12 | 14,67 | 1,0228 | 1,0228 |
| LGND / Ligand Pharmaceuticals Incorporated | 0,28 | 48,77 | 3,4004 | 1,0186 |
| LTH / Life Time Group Holdings, Inc. | 0,43 | 11,93 | 0,8314 | 0,8314 |
| WK / Workiva Inc. | 0,31 | 26,86 | 1,8727 | 0,8038 |
Top-Rückgänge in diesem Quartal
Wir verwenden die Veränderung der Portfolioallokation, weil dies die aussagekräftigste Kennzahl ist. Änderungen können auf Handelsgeschäfte oder Änderungen der Aktienkurse zurückzuführen sein.
| Wertpapier | Aktien (MM) |
Wert (MM$) |
Portfolio % | ΔPortfolio % |
|---|---|---|---|---|
| ARIS / Aris Water Solutions, Inc. | 0,17 | 4,17 | 0,2904 | -1,8881 |
| TXRH / Texas Roadhouse, Inc. | 0,17 | 28,63 | 1,9961 | -1,7380 |
| SFM / Sprouts Farmers Market, Inc. | 0,05 | 5,59 | 0,3895 | -1,3389 |
| FSS / Federal Signal Corporation | 0,19 | 23,11 | 1,6114 | -1,2504 |
| CHE / Chemed Corporation | 0,04 | 17,91 | 1,2488 | -0,7746 |
| ANIP / ANI Pharmaceuticals, Inc. | 0,27 | 24,86 | 1,7329 | -0,7015 |
| ADMA / ADMA Biologics, Inc. | 2,34 | 34,32 | 2,3924 | -0,6474 |
| LMAT / LeMaitre Vascular, Inc. | 0,39 | 33,76 | 2,3538 | -0,6277 |
| EE / Excelerate Energy, Inc. | 1,61 | 40,66 | 2,8347 | -0,5557 |
| MNDY / monday.com Ltd. | 0,06 | 10,92 | 0,7610 | -0,5144 |
13D/G Einreichungen
Dies ist eine Liste der 13D- und 13G-Einreichungen des letzten Jahres (falls vorhanden). Klicken Sie auf das Link-Symbol, um die vollständige Transaktionshistorie anzuzeigen. Grüne Zeilen zeigen neue Positionen an. Rote Zeilen zeigen geschlossene Positionen an.
| Datei Datum | Formular | Wertpapier | Vorherige Aktien |
Aktuelle Aktien |
ΔAktien % | % Eigentümerschaft |
% ΔEigentümerschaft | |
|---|---|---|---|---|---|---|---|---|
| 2025-12-29 | EE / Excelerate Energy, Inc. | 1.315.299 | 3 | -100,00 | 3,90 | -22,16 | ||
| 2025-05-06 | ARIS / Aris Water Solutions, Inc. | 1.325.785 | 1.340.838 | 1,14 | 4,37 | -12,60 |
13F und Fondseinreichungen
Dieses Formular wurde am 2025-11-05 für den Berichtszeitraum eingereicht 2025-09-30. Klicken Sie auf das Link-Symbol , um den gesamten Transaktionsverlauf zu sehen.
Upgrade um die Prämiendaten zu entsperren und nach Excel zu exportieren ![]() .
.
| Wertpapier | Typ | Durchschnittlicher Aktienkurs | Aktien (MM) |
ΔAktien (%) |
Wert ($MM) |
ΔAktien (%) |
Portfolio (%) |
ΔPortfolio (%) |
|
|---|---|---|---|---|---|---|---|---|---|
| PEGA / Pegasystems Inc. | 0,98 | -13,01 | 56,09 | -7,59 | 3,9106 | -0,3283 | |||
| LGND / Ligand Pharmaceuticals Incorporated | 0,28 | -8,23 | 48,77 | 43,00 | 3,4004 | 1,0186 | |||
| EE / Excelerate Energy, Inc. | 1,61 | -2,52 | 40,66 | -16,25 | 2,8347 | -0,5557 | |||
| AAON / AAON, Inc. | 0,42 | -2,84 | 39,40 | 23,09 | 2,7466 | 0,5116 | |||
| ADMA / ADMA Biologics, Inc. | 2,34 | -2,08 | 34,32 | -21,17 | 2,3924 | -0,6474 | |||
| LMAT / LeMaitre Vascular, Inc. | 0,39 | -24,95 | 33,76 | -20,92 | 2,3538 | -0,6277 | |||
| STVN / Stevanato Group S.p.A. | 1,28 | -2,94 | 33,02 | 2,31 | 2,3018 | 0,0481 | |||
| CWST / Casella Waste Systems, Inc. | 0,35 | 15,51 | 32,83 | -5,02 | 2,2889 | -0,1249 | |||
| APPF / AppFolio, Inc. | 0,11 | -18,54 | 31,59 | -2,49 | 2,2024 | -0,0601 | |||
| NCNO / nCino, Inc. | 1,16 | 48,19 | 31,39 | 43,64 | 2,1882 | 0,6623 | |||
| IIIV / i3 Verticals, Inc. | 0,96 | -16,58 | 31,04 | -1,46 | 2,1639 | -0,0357 | |||
| LAZ / Lazard, Inc. | 0,58 | 15,73 | 30,87 | 27,31 | 2,1523 | 0,4589 | |||
| BOOT / Boot Barn Holdings, Inc. | 0,18 | -2,55 | 30,55 | 6,25 | 2,1299 | 0,1219 | |||
| ULS / UL Solutions Inc. | 0,41 | -2,78 | 29,27 | -5,45 | 2,0407 | -0,1212 | |||
| TXRH / Texas Roadhouse, Inc. | 0,17 | -39,60 | 28,63 | -46,45 | 1,9961 | -1,7380 | |||
| AGX / Argan, Inc. | 0,10 | 678,27 | 28,10 | 853,51 | 1,9591 | 1,7532 | |||
| PCTY / Paylocity Holding Corporation | 0,17 | -3,05 | 27,64 | -14,78 | 1,9271 | -0,3379 | |||
| GWRE / Guidewire Software, Inc. | 0,12 | -3,07 | 27,57 | -5,37 | 1,9223 | -0,1125 | |||
| OSW / OneSpaWorld Holdings Limited | 1,30 | -2,12 | 27,46 | 1,48 | 1,9143 | 0,0249 | |||
| WRBY / Warby Parker Inc. | 0,99 | -2,15 | 27,32 | 23,06 | 1,9045 | 0,3543 | |||
| PDFS / PDF Solutions, Inc. | 1,06 | 1,12 | 27,30 | 22,12 | 1,9031 | 0,3421 | |||
| WK / Workiva Inc. | 0,31 | 39,54 | 26,86 | 75,49 | 1,8727 | 0,8038 | |||
| HQY / HealthEquity, Inc. | 0,27 | -2,96 | 25,98 | -12,21 | 1,8112 | -0,2553 | |||
| MEDP / Medpace Holdings, Inc. | 0,05 | -27,86 | 25,13 | 18,18 | 1,7520 | 0,2671 | |||
| BLD / TopBuild Corp. | 0,06 | 107,67 | 25,03 | 150,74 | 1,7448 | 1,0478 | |||
| ANIP / ANI Pharmaceuticals, Inc. | 0,27 | -49,21 | 24,86 | -28,70 | 1,7329 | -0,7015 | |||
| SAIA / Saia, Inc. | 0,08 | 38,07 | 24,27 | 50,86 | 1,6920 | 0,5686 | |||
| FSS / Federal Signal Corporation | 0,19 | -49,56 | 23,11 | -43,60 | 1,6114 | -1,2504 | |||
| JLL / Jones Lang LaSalle Incorporated | 0,08 | 53,03 | 22,65 | 78,46 | 1,5794 | 0,6929 | |||
| RGEN / Repligen Corporation | 0,16 | -2,95 | 21,78 | 4,30 | 1,5187 | 0,0602 | |||
| WING / Wingstop Inc. | 0,08 | 33,85 | 20,83 | 0,04 | 1,4521 | -0,0018 | |||
| CELH / Celsius Holdings, Inc. | 0,36 | 20,78 | 1,4487 | 1,4487 | |||||
| KRMN / Karman Holdings Inc. | 0,27 | 19,14 | 1,3347 | 1,3347 | |||||
| SSD / Simpson Manufacturing Co., Inc. | 0,11 | -3,06 | 18,88 | 4,52 | 1,3160 | 0,0548 | |||
| PR / Permian Resources Corporation | 1,42 | -2,79 | 18,14 | -8,64 | 1,2645 | -0,1219 | |||
| TFIN / Triumph Financial, Inc. | 0,36 | -2,24 | 18,00 | -11,24 | 1,2549 | -0,1612 | |||
| CHE / Chemed Corporation | 0,04 | -32,77 | 17,91 | -38,18 | 1,2488 | -0,7746 | |||
| SOI / Solaris Oilfield Infrastructure, Inc. | 0,43 | 17,03 | 1,1875 | 1,1875 | |||||
| MMSI / Merit Medical Systems, Inc. | 0,20 | -2,91 | 17,00 | -13,56 | 1,1850 | -0,1882 | |||
| CCB / Coastal Financial Corporation | 0,16 | 16,89 | 1,1779 | 1,1779 | |||||
| WSC / WillScot Holdings Corporation | 0,78 | -3,29 | 16,48 | -25,50 | 1,1489 | -0,3957 | |||
| SKY / Champion Homes, Inc. | 0,20 | -2,73 | 15,32 | 18,65 | 1,0684 | 0,1664 | |||
| OII / Oceaneering International, Inc. | 0,60 | -2,97 | 14,77 | 16,05 | 1,0296 | 0,1409 | |||
| MTSI / MACOM Technology Solutions Holdings, Inc. | 0,12 | 14,67 | 1,0228 | 1,0228 | |||||
| BIRK / Birkenstock Holding plc | 0,32 | 66,41 | 14,50 | 53,11 | 1,0106 | 0,3495 | |||
| MLAB / Mesa Laboratories, Inc. | 0,21 | -2,14 | 14,05 | -30,41 | 0,9797 | -0,4303 | |||
| OZK / Bank OZK | 0,27 | -2,97 | 14,00 | 5,11 | 0,9758 | 0,0459 | |||
| CADE / Cadence Bank | 0,36 | -3,20 | 13,52 | 13,63 | 0,9424 | 0,1117 | |||
| MSA / MSA Safety Incorporated | 0,07 | -3,03 | 12,90 | -0,41 | 0,8992 | -0,0052 | |||
| PAHC / Phibro Animal Health Corporation | 0,30 | -16,22 | 12,13 | 32,73 | 0,8460 | 0,2075 | |||
| LTH / Life Time Group Holdings, Inc. | 0,43 | 11,93 | 0,8314 | 0,8314 | |||||
| MCB / Metropolitan Bank Holding Corp. | 0,15 | 0,64 | 11,33 | 7,57 | 0,7901 | 0,0544 | |||
| MNDY / monday.com Ltd. | 0,06 | -2,96 | 10,92 | -40,23 | 0,7610 | -0,5144 | |||
| VITL / Vital Farms, Inc. | 0,24 | 0,67 | 9,78 | 7,54 | 0,6819 | 0,0468 | |||
| WBI / WaterBridge Infrastructure LLC | 0,38 | 9,53 | 0,6644 | 0,6644 | |||||
| KRUS / Kura Sushi USA, Inc. | 0,16 | 0,22 | 9,22 | -30,83 | 0,6427 | -0,2880 | |||
| PLOW / Douglas Dynamics, Inc. | 0,28 | 0,63 | 8,77 | 6,75 | 0,6113 | 0,0377 | |||
| GRBK / Green Brick Partners, Inc. | 0,12 | 101,03 | 8,64 | 136,15 | 0,6026 | 0,3470 | |||
| IRMD / IRADIMED CORPORATION | 0,12 | -44,32 | 8,51 | -33,73 | 0,5935 | -0,3036 | |||
| NVEC / NVE Corporation | 0,13 | 16,00 | 8,44 | 2,86 | 0,5886 | 0,0154 | |||
| PWP / Perella Weinberg Partners | 0,40 | 59,93 | 8,44 | 75,61 | 0,5883 | 0,2527 | |||
| BFST / Business First Bancshares, Inc. | 0,35 | 0,63 | 8,17 | -3,62 | 0,5693 | -0,0224 | |||
| KRT / Karat Packaging Inc. | 0,32 | 0,62 | 8,13 | -9,92 | 0,5669 | -0,0635 | |||
| PNTG / The Pennant Group, Inc. | 0,31 | 0,71 | 7,74 | -14,92 | 0,5400 | -0,0957 | |||
| UFPT / UFP Technologies, Inc. | 0,04 | 0,52 | 7,72 | -17,82 | 0,5381 | -0,1178 | |||
| BLFS / BioLife Solutions, Inc. | 0,29 | 0,38 | 7,40 | 18,87 | 0,5156 | 0,0812 | |||
| COCO / The Vita Coco Company, Inc. | 0,15 | -31,95 | 6,51 | -19,94 | 0,4537 | -0,1140 | |||
| QNST / QuinStreet, Inc. | 0,36 | 0,65 | 5,61 | -3,29 | 0,3910 | -0,0140 | |||
| SFM / Sprouts Farmers Market, Inc. | 0,05 | -65,84 | 5,59 | -77,43 | 0,3895 | -1,3389 | |||
| WTTR / Select Water Solutions, Inc. | 0,45 | 20,97 | 4,86 | 49,69 | 0,3386 | 0,1120 | |||
| EPM / Evolution Petroleum Corporation | 0,94 | -17,67 | 4,55 | -15,56 | 0,3172 | -0,0591 | |||
| LMB / Limbach Holdings, Inc. | 0,05 | -14,33 | 4,55 | -40,61 | 0,3169 | -0,2176 | |||
| ARIS / Aris Water Solutions, Inc. | 0,17 | -87,20 | 4,17 | -86,65 | 0,2904 | -1,8881 | |||
| CVLG / Covenant Logistics Group, Inc. | 0,19 | 0,72 | 4,03 | -9,53 | 0,2807 | -0,0300 | |||
| MGRC / McGrath RentCorp | 0,03 | 2,97 | 0,2071 | 0,2071 | |||||
| PL / Planet Labs PBC | 0,21 | 2,69 | 0,1874 | 0,1874 | |||||
| SLP / Simulations Plus, Inc. | 0,00 | -100,00 | 0,00 | 0,0000 | |||||
| HOMB / Home Bancshares, Inc. (Conway, AR) | 0,00 | -100,00 | 0,00 | 0,0000 | |||||
| JJSF / J&J Snack Foods Corp. | 0,00 | -100,00 | 0,00 | 0,0000 | |||||
| MGY / Magnolia Oil & Gas Corporation | 0,00 | -100,00 | 0,00 | 0,0000 | |||||
| NCMI / National CineMedia, Inc. | 0,00 | -100,00 | 0,00 | 0,0000 |