Basisstatistiken
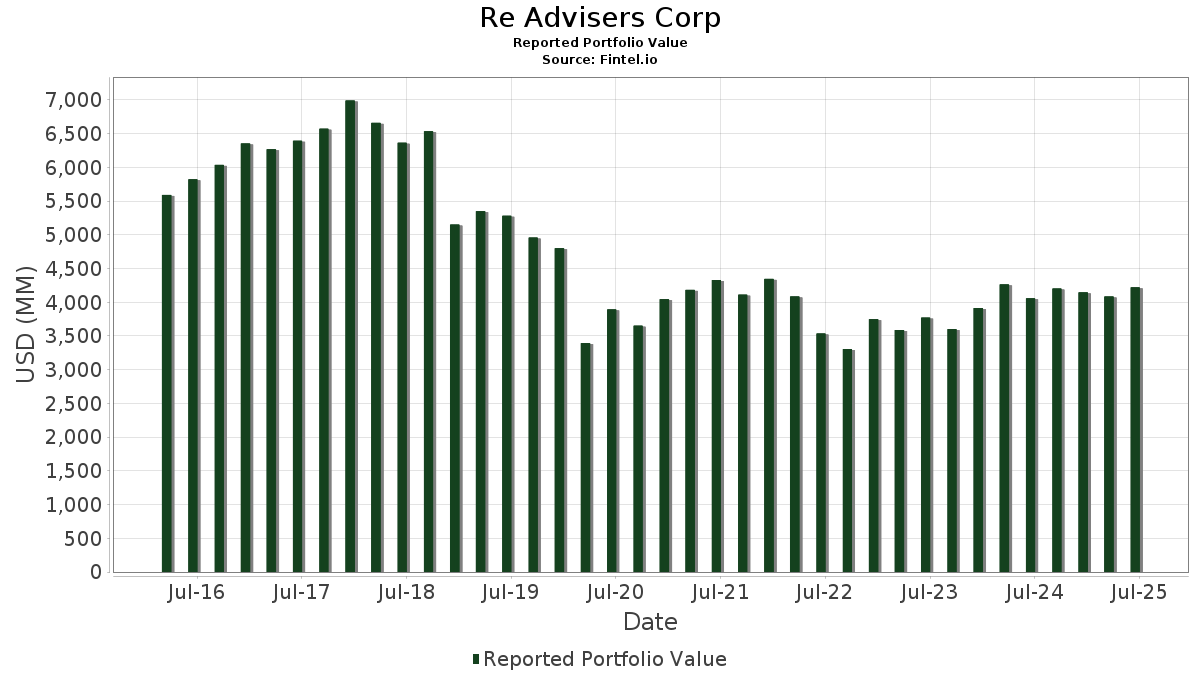
| Portfolio-Wert | $ 4.198.455.169 |
| Aktuelle Positionen | 104 |
Neueste Bestände, Performance, AUM (aus 13F, 13D)
Re Advisers Corp hat 104 Gesamtbeteiligungen in seinen letzten SEC-Einreichungen offengelegt. Der jüngste Portfoliowert wird auf $ 4.198.455.169 USD berechnet. Das tatsächliche verwaltete Vermögen (AUM) ist dieser Wert plus Barmittel (die nicht offengelegt werden). Re Advisers Corps Top-Bestände sind JPMorgan Chase & Co. (US:JPM) , AbbVie Inc. (US:ABBV) , GS Connect S&P GSCI Enhanced Commodity Total Return ETN (US:GSCE) , Lam Research Corporation (US:LRCX) , and Meta Platforms, Inc. (US:META) . Re Advisers Corps neue Positionen sind Ameren Corporation (US:AEE) , Adobe Inc. (US:ADBE) , National Vision Holdings, Inc. (US:EYE) , Sterling Infrastructure, Inc. (US:STRL) , and Magnite, Inc. (US:MGNI) .
Top-Zuwächse in diesem Quartal
Wir verwenden die Veränderung der Portfolioallokation, weil dies die aussagekräftigste Kennzahl ist. Die Änderungen können auf Trades oder Änderungen der Aktienkurse zurückzuführen sein.
| Wertpapier | Aktien (MM) |
Wert (MM$) |
Portfolio % | ΔPortfolio % |
|---|---|---|---|---|
| AEE / Ameren Corporation | 0,73 | 76,61 | 1,8248 | 1,8248 |
| GOOGL / Alphabet Inc. | 0,29 | 71,45 | 1,7018 | 1,2047 |
| LRCX / Lam Research Corporation | 1,07 | 143,78 | 3,4246 | 0,8051 |
| ADBE / Adobe Inc. | 0,09 | 30,94 | 0,7368 | 0,7368 |
| ABBV / AbbVie Inc. | 0,66 | 151,95 | 3,6192 | 0,4794 |
| NOC / Northrop Grumman Corporation | 0,18 | 110,64 | 2,6351 | 0,4426 |
| UNH / UnitedHealth Group Incorporated | 0,22 | 76,14 | 1,8135 | 0,3920 |
| PHM / PulteGroup, Inc. | 0,48 | 63,22 | 1,5059 | 0,3609 |
| C / Citigroup Inc. | 0,99 | 100,60 | 2,3960 | 0,3535 |
| TJX / The TJX Companies, Inc. | 0,56 | 80,36 | 1,9141 | 0,2553 |
Top-Rückgänge in diesem Quartal
Wir verwenden die Veränderung der Portfolioallokation, weil dies die aussagekräftigste Kennzahl ist. Änderungen können auf Handelsgeschäfte oder Änderungen der Aktienkurse zurückzuführen sein.
| Wertpapier | Aktien (MM) |
Wert (MM$) |
Portfolio % | ΔPortfolio % |
|---|---|---|---|---|
| ORCL / Oracle Corporation | 0,00 | 0,00 | -1,5272 | |
| XPRO / Expro Group Holdings N.V. | 0,41 | 53,04 | 1,2634 | -1,4317 |
| MRKCL / Merck & Co., Inc. | 0,24 | 20,07 | 0,4780 | -0,7195 |
| CNC / Centene Corporation | 0,00 | 0,00 | -0,6150 | |
| BMY / Bristol-Myers Squibb Company | 0,42 | 19,14 | 0,4559 | -0,6017 |
| KHC / The Kraft Heinz Company | 0,00 | 0,00 | -0,5557 | |
| BSX / Boston Scientific Corporation | 0,67 | 65,26 | 1,5543 | -0,3785 |
| DE / Deere & Company | 0,22 | 98,59 | 2,3481 | -0,2978 |
| HON / Honeywell International Inc. | 0,42 | 87,55 | 2,0852 | -0,2550 |
| CI / The Cigna Group | 0,21 | 60,55 | 1,4422 | -0,2346 |
13F und Fondseinreichungen
Dieses Formular wurde am 2025-11-05 für den Berichtszeitraum eingereicht 2025-09-30. Klicken Sie auf das Link-Symbol , um den gesamten Transaktionsverlauf zu sehen.
Upgrade um die Prämiendaten zu entsperren und nach Excel zu exportieren ![]() .
.
| Wertpapier | Typ | Durchschnittlicher Aktienkurs | Aktien (MM) |
ΔAktien (%) |
Wert ($MM) |
ΔAktien (%) |
Portfolio (%) |
ΔPortfolio (%) |
|
|---|---|---|---|---|---|---|---|---|---|
| JPM / JPMorgan Chase & Co. | 0,68 | -6,16 | 213,68 | 2,10 | 5,0896 | 0,1302 | |||
| ABBV / AbbVie Inc. | 0,66 | -8,07 | 151,95 | 14,67 | 3,6192 | 0,4794 | |||
| GSCE / GS Connect S&P GSCI Enhanced Commodity Total Return ETN | 0,19 | -7,52 | 151,73 | 4,05 | 3,6140 | 0,1587 | |||
| LRCX / Lam Research Corporation | 1,07 | -5,45 | 143,78 | 30,06 | 3,4246 | 0,8051 | |||
| META / Meta Platforms, Inc. | 0,18 | -1,79 | 133,29 | -2,28 | 3,1747 | -0,0573 | |||
| PH / Parker-Hannifin Corporation | 0,16 | -12,90 | 123,87 | -5,46 | 2,9503 | -0,1543 | |||
| MSFT / Microsoft Corporation | 0,23 | -1,85 | 120,68 | 2,20 | 2,8743 | 0,0764 | |||
| ABT / Abbott Laboratories | 0,89 | -1,72 | 119,63 | -3,21 | 2,8493 | -0,0794 | |||
| NOC / Northrop Grumman Corporation | 0,18 | -1,89 | 110,64 | 19,56 | 2,6351 | 0,4426 | |||
| XOM / Exxon Mobil Corporation | 0,93 | -1,93 | 104,44 | 2,58 | 2,4876 | 0,0750 | |||
| V / Visa Inc. | 0,30 | -1,99 | 101,01 | -5,76 | 2,4058 | -0,1339 | |||
| C / Citigroup Inc. | 0,99 | -2,13 | 100,60 | 16,70 | 2,3960 | 0,3535 | |||
| DE / Deere & Company | 0,22 | -1,82 | 98,59 | -11,71 | 2,3481 | -0,2978 | |||
| ETN / Eaton Corporation plc | 0,26 | -1,84 | 97,94 | 2,91 | 2,3328 | 0,0776 | |||
| DIS / The Walt Disney Company | 0,85 | -1,95 | 97,08 | -9,47 | 2,3124 | -0,2288 | |||
| BAC / Bank of America Corporation | 1,74 | -2,19 | 89,88 | 6,64 | 2,1407 | 0,1436 | |||
| HON / Honeywell International Inc. | 0,42 | -1,93 | 87,55 | -11,36 | 2,0852 | -0,2550 | |||
| MCD / McDonald's Corporation | 0,29 | -1,86 | 86,72 | 2,08 | 2,0656 | 0,0525 | |||
| CB / Chubb Limited | 0,31 | -1,89 | 86,63 | -4,42 | 2,0633 | -0,0842 | |||
| TJX / The TJX Companies, Inc. | 0,56 | -1,92 | 80,36 | 14,80 | 1,9141 | 0,2553 | |||
| WMT / Walmart Inc. | 0,78 | -1,94 | 80,21 | 3,36 | 1,9105 | 0,0715 | |||
| BA / The Boeing Company | 0,37 | 3,13 | 78,93 | 6,23 | 1,8800 | 0,1194 | |||
| GEHC / GE HealthCare Technologies Inc. | 1,03 | 3,42 | 77,03 | 4,86 | 1,8347 | 0,0940 | |||
| AEE / Ameren Corporation | 0,73 | 76,61 | 1,8248 | 1,8248 | |||||
| UNH / UnitedHealth Group Incorporated | 0,22 | 14,66 | 76,14 | 26,92 | 1,8135 | 0,3920 | |||
| ALL / The Allstate Corporation | 0,35 | -1,88 | 74,10 | 4,63 | 1,7649 | 0,0867 | |||
| NXPI / NXP Semiconductors N.V. | 0,32 | -1,87 | 72,87 | 2,28 | 1,7357 | 0,0474 | |||
| GOOGL / Alphabet Inc. | 0,29 | 148,06 | 71,45 | 240,58 | 1,7018 | 1,2047 | |||
| RPRX / Royalty Pharma plc | 1,90 | -1,91 | 67,12 | -3,95 | 1,5986 | -0,0572 | |||
| BSX / Boston Scientific Corporation | 0,67 | -11,98 | 65,26 | -20,00 | 1,5543 | -0,3785 | |||
| DD / DuPont de Nemours, Inc. | 0,83 | -1,96 | 64,76 | 11,35 | 1,5426 | 0,1644 | |||
| PHM / PulteGroup, Inc. | 0,48 | 4,43 | 63,22 | 30,84 | 1,5059 | 0,3609 | |||
| COP / ConocoPhillips | 0,66 | -2,00 | 62,57 | 3,30 | 1,4903 | 0,0550 | |||
| CI / The Cigna Group | 0,21 | -1,87 | 60,55 | -14,43 | 1,4422 | -0,2346 | |||
| FCX / Freeport-McMoRan Inc. | 1,50 | -1,94 | 58,73 | -11,29 | 1,3989 | -0,1698 | |||
| HD / The Home Depot, Inc. | 0,14 | -1,86 | 57,77 | 8,46 | 1,3760 | 0,1139 | |||
| AVY / Avery Dennison Corporation | 0,35 | -1,95 | 57,19 | -9,38 | 1,3622 | -0,1332 | |||
| CACI / CACI International Inc | 0,11 | -1,72 | 56,85 | 2,83 | 1,3540 | 0,0440 | |||
| CCI / Crown Castle Inc. | 0,59 | -1,96 | 56,52 | -7,91 | 1,3463 | -0,1082 | |||
| XPRO / Expro Group Holdings N.V. | 0,41 | -37,64 | 53,04 | -53,37 | 1,2634 | -1,4317 | |||
| CSX / CSX Corporation | 1,49 | -20,96 | 52,98 | -13,98 | 1,2619 | -0,1975 | |||
| DLR / Digital Realty Trust, Inc. | 0,26 | -1,99 | 45,06 | -2,81 | 1,0733 | -0,0253 | |||
| GJR / Strats Trust For Procter & Gambel Security - Preferred Security | 0,29 | -1,95 | 44,02 | -5,44 | 1,0485 | -0,0546 | |||
| TFC / Truist Financial Corporation | 0,83 | -21,43 | 37,95 | -16,44 | 0,9040 | -0,1723 | |||
| TRU / TransUnion | 0,40 | -2,01 | 33,83 | -6,71 | 0,8058 | -0,0535 | |||
| TMUS / T-Mobile US, Inc. | 0,14 | -2,02 | 32,44 | -1,57 | 0,7726 | -0,0082 | |||
| ADBE / Adobe Inc. | 0,09 | 30,94 | 0,7368 | 0,7368 | |||||
| FANG / Diamondback Energy, Inc. | 0,20 | -1,88 | 29,06 | 2,19 | 0,6922 | 0,0183 | |||
| LKQ / LKQ Corporation | 0,67 | -1,98 | 20,38 | -19,12 | 0,4854 | -0,1116 | |||
| MRKCL / Merck & Co., Inc. | 0,24 | -62,55 | 20,07 | -60,29 | 0,4780 | -0,7195 | |||
| BMY / Bristol-Myers Squibb Company | 0,42 | -55,98 | 19,14 | -57,12 | 0,4559 | -0,6017 | |||
| AIT / Applied Industrial Technologies, Inc. | 0,03 | -6,46 | 7,94 | 5,05 | 0,1892 | 0,0100 | |||
| FSS / Federal Signal Corporation | 0,07 | -20,86 | 7,90 | -11,50 | 0,1882 | -0,0234 | |||
| AEIS / Advanced Energy Industries, Inc. | 0,04 | -26,82 | 7,43 | -6,03 | 0,1769 | -0,0104 | |||
| KNSL / Kinsale Capital Group, Inc. | 0,02 | 0,00 | 6,94 | -12,13 | 0,1654 | -0,0218 | |||
| FBK / FB Financial Corporation | 0,12 | 0,00 | 6,93 | 23,04 | 0,1651 | 0,0316 | |||
| GIL / Gildan Activewear Inc. | 0,12 | 0,00 | 6,84 | 17,37 | 0,1629 | 0,0248 | |||
| DSGX / The Descartes Systems Group Inc. | 0,07 | 0,00 | 6,54 | -7,30 | 0,1557 | -0,0114 | |||
| FIX / Comfort Systems USA, Inc. | 0,01 | -6,42 | 6,01 | 43,99 | 0,1432 | 0,0443 | |||
| ESAB / ESAB Corporation | 0,05 | -11,54 | 5,91 | -18,00 | 0,1407 | -0,0300 | |||
| PLXS / Plexus Corp. | 0,04 | 0,00 | 5,90 | 6,94 | 0,1406 | 0,0098 | |||
| HAYW / Hayward Holdings, Inc. | 0,37 | -16,39 | 5,62 | -8,38 | 0,1338 | -0,0115 | |||
| CADE / Cadence Bank | 0,15 | 0,00 | 5,52 | 17,41 | 0,1316 | 0,0201 | |||
| GBCI / Glacier Bancorp, Inc. | 0,11 | 0,00 | 5,47 | 12,99 | 0,1303 | 0,0156 | |||
| IRTC / iRhythm Holdings, Inc. | 0,03 | -7,10 | 5,18 | 3,77 | 0,1233 | 0,0051 | |||
| CWK / Cushman & Wakefield Limited | 0,32 | 0,00 | 5,09 | 43,81 | 0,1213 | 0,0374 | |||
| KAR / OPENLANE, Inc. | 0,18 | 0,00 | 5,05 | 17,70 | 0,1204 | 0,0186 | |||
| AUB / Atlantic Union Bankshares Corporation | 0,14 | 0,00 | 4,92 | 12,81 | 0,1172 | 0,0139 | |||
| NVST / Envista Holdings Corporation | 0,22 | -24,25 | 4,54 | -21,04 | 0,1082 | -0,0281 | |||
| QTWO / Q2 Holdings, Inc. | 0,06 | 0,00 | 4,51 | -22,66 | 0,1074 | -0,0307 | |||
| GMED / Globus Medical, Inc. | 0,08 | 0,00 | 4,37 | -2,95 | 0,1041 | -0,0026 | |||
| JBTM / JBT Marel Corporation | 0,03 | -22,42 | 4,33 | -9,41 | 0,1030 | -0,0101 | |||
| ITGR / Integer Holdings Corporation | 0,04 | 0,00 | 4,20 | -15,98 | 0,1001 | -0,0184 | |||
| ESI / Element Solutions Inc | 0,16 | 0,00 | 3,94 | 11,14 | 0,0939 | 0,0098 | |||
| ONB / Old National Bancorp | 0,17 | 13,79 | 3,66 | 17,05 | 0,0872 | 0,0131 | |||
| DBRG / DigitalBridge Group, Inc. | 0,30 | 0,00 | 3,48 | 13,05 | 0,0830 | 0,0100 | |||
| CCCS / CCC Intelligent Solutions Holdings Inc. | 0,37 | 0,00 | 3,41 | -3,18 | 0,0812 | -0,0022 | |||
| ACLS / Axcelis Technologies, Inc. | 0,03 | 0,00 | 3,34 | 40,12 | 0,0795 | 0,0231 | |||
| ECPG / Encore Capital Group, Inc. | 0,08 | -20,99 | 3,22 | -14,81 | 0,0767 | -0,0129 | |||
| AVNT / Avient Corporation | 0,10 | -47,58 | 3,19 | -46,55 | 0,0760 | -0,0654 | |||
| HQY / HealthEquity, Inc. | 0,03 | 21,93 | 3,11 | 10,29 | 0,0740 | 0,0073 | |||
| KEX / Kirby Corporation | 0,04 | 0,00 | 3,00 | -26,41 | 0,0716 | -0,0252 | |||
| MEDP / Medpace Holdings, Inc. | 0,01 | 0,00 | 2,96 | 63,86 | 0,0704 | 0,0277 | |||
| EYE / National Vision Holdings, Inc. | 0,10 | 2,93 | 0,0698 | 0,0698 | |||||
| ADMA / ADMA Biologics, Inc. | 0,20 | 83,12 | 2,91 | 47,49 | 0,0693 | 0,0225 | |||
| DIOD / Diodes Incorporated | 0,05 | -23,59 | 2,79 | -23,13 | 0,0665 | -0,0196 | |||
| KBH / KB Home | 0,04 | 0,00 | 2,75 | 20,15 | 0,0655 | 0,0113 | |||
| VRRM / Verra Mobility Corporation | 0,11 | 0,00 | 2,70 | -2,71 | 0,0642 | -0,0015 | |||
| ENOV / Enovis Corporation | 0,08 | 8,65 | 2,55 | 5,10 | 0,0608 | 0,0033 | |||
| SVV / Savers Value Village, Inc. | 0,19 | 0,00 | 2,48 | 29,93 | 0,0590 | 0,0138 | |||
| YETI / YETI Holdings, Inc. | 0,07 | -26,86 | 2,31 | -23,01 | 0,0551 | -0,0161 | |||
| NOG / Northern Oil and Gas, Inc. | 0,09 | -11,32 | 2,19 | -22,45 | 0,0523 | -0,0148 | |||
| KTB / Kontoor Brands, Inc. | 0,03 | 0,00 | 2,11 | 20,91 | 0,0502 | 0,0089 | |||
| CWST / Casella Waste Systems, Inc. | 0,02 | 1,95 | 0,0463 | 0,0463 | |||||
| PR / Permian Resources Corporation | 0,14 | -13,90 | 1,81 | -19,08 | 0,0430 | -0,0099 | |||
| MTDR / Matador Resources Company | 0,04 | -15,14 | 1,66 | -20,10 | 0,0396 | -0,0097 | |||
| MBUU / Malibu Boats, Inc. | 0,05 | 0,00 | 1,56 | 3,58 | 0,0373 | 0,0015 | |||
| LNTH / Lantheus Holdings, Inc. | 0,03 | -49,66 | 1,50 | -68,47 | 0,0358 | -0,0771 | |||
| STRL / Sterling Infrastructure, Inc. | 0,00 | 1,26 | 0,0299 | 0,0299 | |||||
| HGV / Hilton Grand Vacations Inc. | 0,03 | 0,00 | 1,25 | 0,72 | 0,0299 | 0,0004 | |||
| VVV / Valvoline Inc. | 0,03 | 0,00 | 1,20 | -5,21 | 0,0287 | -0,0014 | |||
| LOB / Live Oak Bancshares, Inc. | 0,03 | 0,00 | 1,20 | 18,21 | 0,0286 | 0,0045 | |||
| ITRI / Itron, Inc. | 0,01 | 1,07 | 0,0255 | 0,0255 | |||||
| MGNI / Magnite, Inc. | 0,04 | 0,96 | 0,0228 | 0,0228 | |||||
| TGI / Triumph Group, Inc. | 0,00 | -100,00 | 0,00 | -100,00 | -0,0660 | ||||
| KHC / The Kraft Heinz Company | 0,00 | -100,00 | 0,00 | -100,00 | -0,5557 | ||||
| ORCL / Oracle Corporation | 0,00 | -100,00 | 0,00 | -100,00 | -1,5272 | ||||
| CNC / Centene Corporation | 0,00 | -100,00 | 0,00 | -100,00 | -0,6150 |