Basisstatistiken
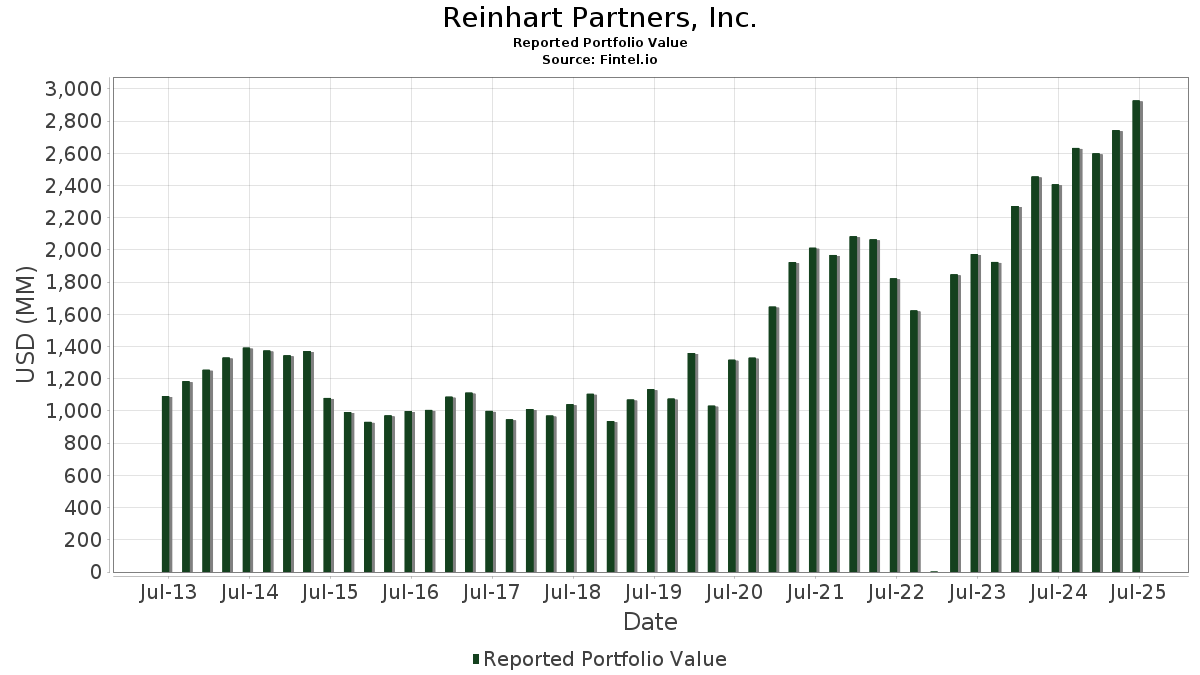
| Portfolio-Wert | $ 3.075.431.264 |
| Aktuelle Positionen | 74 |
Neueste Bestände, Performance, AUM (aus 13F, 13D)
Reinhart Partners, Inc. hat 74 Gesamtbeteiligungen in seinen letzten SEC-Einreichungen offengelegt. Der jüngste Portfoliowert wird auf $ 3.075.431.264 USD berechnet. Das tatsächliche verwaltete Vermögen (AUM) ist dieser Wert plus Barmittel (die nicht offengelegt werden). Reinhart Partners, Inc.s Top-Bestände sind Axcelis Technologies, Inc. (US:ACLS) , InterDigital, Inc. (US:IDCC) , Silicon Motion Technology Corporation - Depositary Receipt (Common Stock) (US:SIMO) , Modine Manufacturing Company (US:MOD) , and First Citizens BancShares, Inc. (US:FCNCA) . Reinhart Partners, Inc.s neue Positionen sind Cadre Holdings, Inc. (US:CDRE) , Coca-Cola Consolidated, Inc. (US:COKE) , . Reinhart Partners, Inc.s wichtigste Branchen sind "Rubber And Miscellaneous Plastics Products" (sic 30) , "Railroad Transportation" (sic 40) , and "Apparel And Accessory Stores" (sic 56) .
Top-Zuwächse in diesem Quartal
Wir verwenden die Veränderung der Portfolioallokation, weil dies die aussagekräftigste Kennzahl ist. Die Änderungen können auf Trades oder Änderungen der Aktienkurse zurückzuführen sein.
| Wertpapier | Aktien (MM) |
Wert (MM$) |
Portfolio % | ΔPortfolio % |
|---|---|---|---|---|
| CDRE / Cadre Holdings, Inc. | 1,92 | 70,21 | 2,2828 | 2,2828 |
| ACLS / Axcelis Technologies, Inc. | 1,61 | 157,23 | 5,1126 | 1,4977 |
| IDCC / InterDigital, Inc. | 0,41 | 142,36 | 4,6289 | 1,4938 |
| VVX / V2X, Inc. | 0,89 | 51,70 | 1,6811 | 1,2000 |
| SIMO / Silicon Motion Technology Corporation - Depositary Receipt (Common Stock) | 1,50 | 142,30 | 4,6272 | 0,8486 |
| FAF / First American Financial Corporation | 1,60 | 102,66 | 3,3380 | 0,7854 |
| HLMN / Hillman Solutions Corp. | 10,47 | 96,13 | 3,1257 | 0,6738 |
| FORM / FormFactor, Inc. | 2,40 | 87,59 | 2,8479 | 0,6091 |
| SKWD / Skyward Specialty Insurance Group, Inc. | 1,61 | 76,74 | 2,4953 | 0,6021 |
| YETI / YETI Holdings, Inc. | 2,66 | 88,32 | 2,8719 | 0,5648 |
Top-Rückgänge in diesem Quartal
Wir verwenden die Veränderung der Portfolioallokation, weil dies die aussagekräftigste Kennzahl ist. Änderungen können auf Handelsgeschäfte oder Änderungen der Aktienkurse zurückzuführen sein.
| Wertpapier | Aktien (MM) |
Wert (MM$) |
Portfolio % | ΔPortfolio % |
|---|---|---|---|---|
| GMS / GMS Inc. | 0,00 | 0,00 | -2,3896 | |
| LNTH / Lantheus Holdings, Inc. | 1,35 | 69,13 | 2,2477 | -1,6772 |
| PAR / PAR Technology Corporation | 0,90 | 35,61 | 1,1579 | -0,9363 |
| FTDR / Frontdoor, Inc. | 1,30 | 87,25 | 2,8370 | -0,9353 |
| AL / Air Lease Corporation | 0,68 | 43,23 | 1,4057 | -0,7578 |
| WTFC / Wintrust Financial Corporation | 0,61 | 80,97 | 2,6327 | -0,5499 |
| FCNCA / First Citizens BancShares, Inc. | 0,07 | 125,72 | 4,0877 | -0,5433 |
| EHC / Encompass Health Corporation | 0,36 | 46,05 | 1,4975 | -0,4006 |
| UHALB / U-Haul Holding Company - Series N | 1,75 | 88,95 | 2,8922 | -0,3621 |
| IBOC / International Bancshares Corporation | 0,67 | 45,88 | 1,4918 | -0,3008 |
13D/G Einreichungen
Dies ist eine Liste der 13D- und 13G-Einreichungen des letzten Jahres (falls vorhanden). Klicken Sie auf das Link-Symbol, um die vollständige Transaktionshistorie anzuzeigen. Grüne Zeilen zeigen neue Positionen an. Rote Zeilen zeigen geschlossene Positionen an.
| Datei Datum | Formular | Wertpapier | Vorherige Aktien |
Aktuelle Aktien |
ΔAktien % | % Eigentümerschaft |
% ΔEigentümerschaft | |
|---|---|---|---|---|---|---|---|---|
| 2025-11-04 | NSP / Insperity, Inc. | 2.202.326 | 5,90 | |||||
| 2025-08-05 | HLMN / Hillman Solutions Corp. | 10.053.219 | 5,10 | |||||
| 2025-05-15 | AHCO / AdaptHealth Corp. | 7.236.262 | 5,40 | |||||
| 2025-05-15 | MMI / Marcus & Millichap, Inc. | 2.162.935 | 5,60 |
13F und Fondseinreichungen
Dieses Formular wurde am 2025-10-28 für den Berichtszeitraum eingereicht 2025-09-30. Klicken Sie auf das Link-Symbol , um den gesamten Transaktionsverlauf zu sehen.
Upgrade um die Prämiendaten zu entsperren und nach Excel zu exportieren ![]() .
.
| Wertpapier | Typ | Durchschnittlicher Aktienkurs | Aktien (MM) |
ΔAktien (%) |
Wert ($MM) |
ΔAktien (%) |
Portfolio (%) |
ΔPortfolio (%) |
|
|---|---|---|---|---|---|---|---|---|---|
| ACLS / Axcelis Technologies, Inc. | 1,61 | 6,04 | 157,23 | 48,58 | 5,1126 | 1,4977 | |||
| IDCC / InterDigital, Inc. | 0,41 | 0,74 | 142,36 | 55,10 | 4,6289 | 1,4938 | |||
| SIMO / Silicon Motion Technology Corporation - Depositary Receipt (Common Stock) | 1,50 | 1,99 | 142,30 | 28,64 | 4,6272 | 0,8486 | |||
| MOD / Modine Manufacturing Company | 0,89 | -18,40 | 126,62 | 17,77 | 4,1173 | 0,4446 | |||
| FCNCA / First Citizens BancShares, Inc. | 0,07 | 1,40 | 125,72 | -7,27 | 4,0877 | -0,5433 | |||
| NSP / Insperity, Inc. | 2,20 | 23,24 | 108,36 | 0,86 | 3,5232 | -0,1464 | |||
| FAF / First American Financial Corporation | 1,60 | 31,28 | 102,66 | 37,37 | 3,3380 | 0,7854 | |||
| HLMN / Hillman Solutions Corp. | 10,47 | 4,16 | 96,13 | 33,92 | 3,1257 | 0,6738 | |||
| AGO / Assured Guaranty Ltd. | 1,13 | -0,71 | 95,69 | -3,50 | 3,1113 | -0,2757 | |||
| EEFT / Euronet Worldwide, Inc. | 1,08 | 20,26 | 94,82 | 4,16 | 3,0831 | -0,0264 | |||
| UHALB / U-Haul Holding Company - Series N | 1,75 | -0,27 | 88,95 | -6,64 | 2,8922 | -0,3621 | |||
| YETI / YETI Holdings, Inc. | 2,66 | 24,23 | 88,32 | 30,77 | 2,8719 | 0,5648 | |||
| FORM / FormFactor, Inc. | 2,40 | 26,26 | 87,59 | 33,63 | 2,8479 | 0,6091 | |||
| FTDR / Frontdoor, Inc. | 1,30 | -30,80 | 87,25 | -21,00 | 2,8370 | -0,9353 | |||
| MMS / Maximus, Inc. | 0,92 | 0,84 | 84,21 | 31,26 | 2,7380 | 0,5466 | |||
| WTFC / Wintrust Financial Corporation | 0,61 | -18,65 | 80,97 | -13,10 | 2,6327 | -0,5499 | |||
| SKWD / Skyward Specialty Insurance Group, Inc. | 1,61 | 68,25 | 76,74 | 38,46 | 2,4953 | 0,6021 | |||
| LSTR / Landstar System, Inc. | 0,58 | 36,44 | 71,25 | 20,29 | 2,3166 | 0,2934 | |||
| CDRE / Cadre Holdings, Inc. | 1,92 | 70,21 | 2,2828 | 2,2828 | |||||
| WTM / White Mountains Insurance Group, Ltd. | 0,04 | -0,20 | 69,58 | -7,10 | 2,2624 | -0,2960 | |||
| LNTH / Lantheus Holdings, Inc. | 1,35 | -3,98 | 69,13 | -39,84 | 2,2477 | -1,6772 | |||
| AHCO / AdaptHealth Corp. | 7,33 | 0,20 | 65,58 | -4,90 | 2,1323 | -0,2232 | |||
| MMI / Marcus & Millichap, Inc. | 2,21 | -0,29 | 64,82 | -4,70 | 2,1076 | -0,2157 | |||
| FHB / First Hawaiian, Inc. | 2,36 | 0,74 | 58,61 | 0,21 | 1,9058 | -0,0920 | |||
| RHP / Ryman Hospitality Properties, Inc. | 0,60 | 1,39 | 54,07 | -7,94 | 1,7582 | -0,2482 | |||
| ACIW / ACI Worldwide, Inc. | 1,02 | 3,74 | 54,03 | 19,24 | 1,7570 | 0,2091 | |||
| VVX / V2X, Inc. | 0,89 | 206,81 | 51,70 | 267,12 | 1,6811 | 1,2000 | |||
| ASGN / ASGN Incorporated | 1,07 | 5,20 | 50,78 | -0,23 | 1,6512 | -0,0875 | |||
| LOPE / Grand Canyon Education, Inc. | 0,22 | -21,88 | 48,41 | -9,27 | 1,5741 | -0,2484 | |||
| EHC / Encompass Health Corporation | 0,36 | -19,99 | 46,05 | -17,12 | 1,4975 | -0,4006 | |||
| IBOC / International Bancshares Corporation | 0,67 | -15,36 | 45,88 | -12,58 | 1,4918 | -0,3008 | |||
| AL / Air Lease Corporation | 0,68 | -37,28 | 43,23 | -31,74 | 1,4057 | -0,7578 | |||
| ESI / Element Solutions Inc | 1,65 | 0,21 | 41,63 | 11,36 | 1,3538 | 0,0767 | |||
| GXO / GXO Logistics, Inc. | 0,73 | 1,28 | 38,67 | 9,99 | 1,2575 | 0,0565 | |||
| INDB / Independent Bank Corp. | 0,54 | 6,64 | 37,45 | 17,30 | 1,2177 | 0,1272 | |||
| PAR / PAR Technology Corporation | 0,90 | 1,80 | 35,61 | -41,92 | 1,1579 | -0,9363 | |||
| PAYC / Paycom Software, Inc. | 0,06 | -5,20 | 12,61 | -14,73 | 0,4101 | -0,0951 | |||
| AMG / Affiliated Managers Group, Inc. | 0,05 | -24,59 | 11,58 | -8,63 | 0,3766 | -0,0564 | |||
| SSNC / SS&C Technologies Holdings, Inc. | 0,13 | -4,85 | 11,44 | 2,00 | 0,3718 | -0,0111 | |||
| TRU / TransUnion | 0,12 | -4,51 | 10,15 | -9,09 | 0,3299 | -0,0513 | |||
| LYV / Live Nation Entertainment, Inc. | 0,06 | -4,89 | 10,01 | 2,72 | 0,3254 | -0,0074 | |||
| REXR / Rexford Industrial Realty, Inc. | 0,24 | -4,92 | 9,81 | 9,90 | 0,3189 | 0,0140 | |||
| MTB / M&T Bank Corporation | 0,05 | -5,41 | 9,65 | -3,65 | 0,3137 | -0,0283 | |||
| TPR / Tapestry, Inc. | 0,08 | -42,56 | 9,55 | -25,93 | 0,3106 | -0,1300 | |||
| XEL / Xcel Energy Inc. | 0,12 | -5,02 | 9,50 | 12,49 | 0,3090 | 0,0204 | |||
| LPLA / LPL Financial Holdings Inc. | 0,03 | -5,22 | 9,37 | -15,90 | 0,3047 | -0,0759 | |||
| KEYS / Keysight Technologies, Inc. | 0,05 | -4,63 | 8,75 | 1,81 | 0,2846 | -0,0091 | |||
| AVTR / Avantor, Inc. | 0,69 | 21,02 | 8,54 | 11,62 | 0,2776 | 0,0163 | |||
| FNF / Fidelity National Financial, Inc. | 0,14 | -5,41 | 8,38 | 2,06 | 0,2725 | -0,0080 | |||
| EXP / Eagle Materials Inc. | 0,04 | -5,83 | 8,16 | 8,58 | 0,2654 | 0,0086 | |||
| ST / Sensata Technologies Holding plc | 0,26 | -5,92 | 7,86 | -4,54 | 0,2555 | -0,0257 | |||
| CPT / Camden Property Trust | 0,07 | -4,97 | 7,84 | -9,95 | 0,2551 | -0,0425 | |||
| MCHP / Microchip Technology Incorporated | 0,12 | -4,95 | 7,84 | -13,26 | 0,2548 | -0,0538 | |||
| AOS / A. O. Smith Corporation | 0,10 | -3,93 | 7,71 | 7,55 | 0,2506 | 0,0058 | |||
| AFG / American Financial Group, Inc. | 0,05 | -4,05 | 7,52 | 10,78 | 0,2446 | 0,0127 | |||
| COKE / Coca-Cola Consolidated, Inc. | 0,06 | 7,25 | 0,2357 | 0,2357 | |||||
| BOKF / BOK Financial Corporation | 0,06 | -5,62 | 7,15 | 7,73 | 0,2326 | 0,0058 | |||
| ALSN / Allison Transmission Holdings, Inc. | 0,08 | -5,33 | 7,09 | -15,40 | 0,2306 | -0,0558 | |||
| LKQ / LKQ Corporation | 0,23 | -5,26 | 7,00 | -21,82 | 0,2276 | -0,0783 | |||
| ZBH / Zimmer Biomet Holdings, Inc. | 0,07 | -4,21 | 6,96 | 3,45 | 0,2264 | -0,0035 | |||
| ICE / Intercontinental Exchange, Inc. | 0,04 | -4,77 | 6,94 | -12,55 | 0,2256 | -0,0454 | |||
| FIS / Fidelity National Information Services, Inc. | 0,10 | -5,17 | 6,72 | -23,19 | 0,2185 | -0,0803 | |||
| DG / Dollar General Corporation | 0,06 | -8,17 | 6,14 | -17,03 | 0,1995 | -0,0531 | |||
| GPN / Global Payments Inc. | 0,07 | -4,16 | 5,86 | -0,53 | 0,1906 | -0,0107 | |||
| CTSH / Cognizant Technology Solutions Corporation | 0,09 | -5,13 | 5,77 | -18,45 | 0,1875 | -0,0540 | |||
| BKR / Baker Hughes Company | 0,11 | -48,83 | 5,32 | -34,97 | 0,1730 | -0,1065 | |||
| COLD / Americold Realty Trust, Inc. | 0,39 | -5,82 | 4,72 | -30,69 | 0,1536 | -0,0792 | |||
| PGR / The Progressive Corporation | 0,02 | -3,85 | 4,41 | -11,03 | 0,1432 | -0,0259 | |||
| SNA / Snap-on Incorporated | 0,01 | -6,15 | 4,04 | 4,50 | 0,1315 | -0,0007 | |||
| BJ / BJ's Wholesale Club Holdings, Inc. | 0,04 | -3,13 | 3,89 | -16,24 | 0,1263 | -0,0321 | |||
| MAR / Marriott International, Inc. | 0,01 | -6,24 | 3,49 | -10,62 | 0,1136 | -0,0199 | |||
| WSC / WillScot Holdings Corporation | 0,10 | -4,51 | 2,03 | -26,47 | 0,0661 | -0,0283 | |||
| IVV / iShares Trust - iShares Core S&P 500 ETF | 0,00 | 0,00 | 1,50 | 7,82 | 0,0489 | 0,0012 | |||
| SPSB / SPDR Series Trust - State Street SPDR Portfolio Short Term Corporate Bond ETF | 0,01 | 0,00 | 0,29 | 0,35 | 0,0094 | -0,0004 | |||
| GMS / GMS Inc. | 0,00 | -100,00 | 0,00 | -100,00 | -2,3896 | ||||
| IWM / iShares Trust - iShares Russell 2000 ETF | 0,00 | -100,00 | 0,00 | 0,0000 |