Basisstatistiken
| Portfolio-Wert | $ 3.506.500.126 |
| Aktuelle Positionen | 204 |
Neueste Bestände, Performance, AUM (aus 13F, 13D)
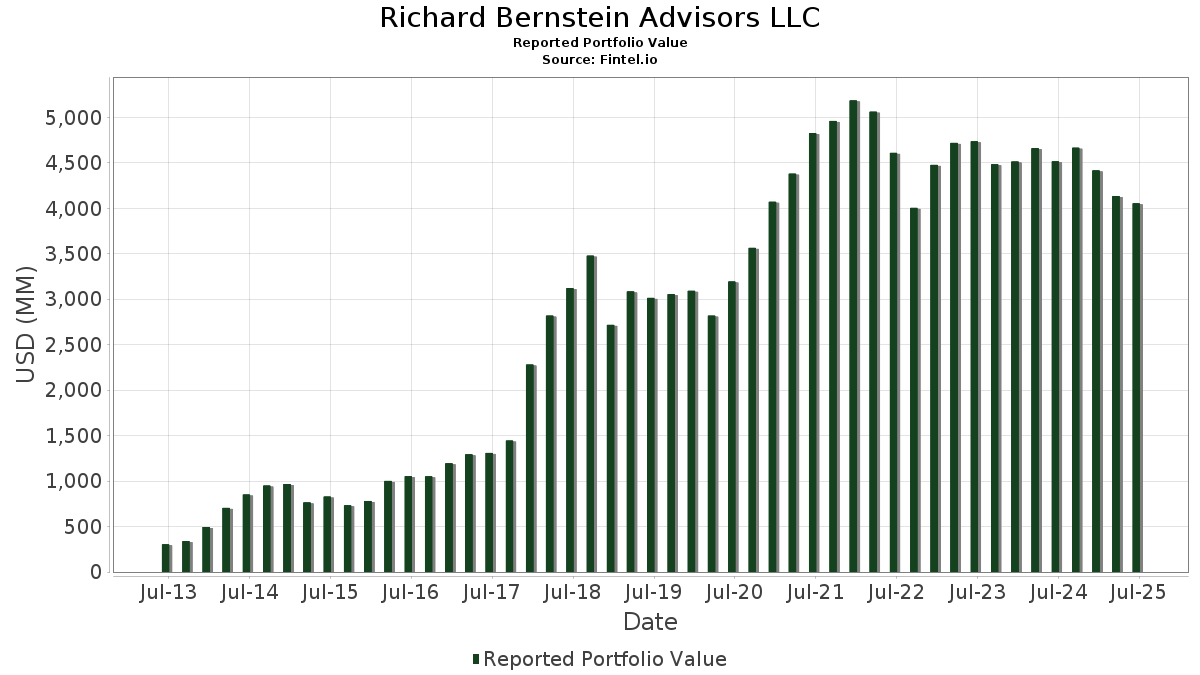
Richard Bernstein Advisors LLC hat 204 Gesamtbeteiligungen in seinen letzten SEC-Einreichungen offengelegt. Der jüngste Portfoliowert wird auf $ 3.506.500.126 USD berechnet. Das tatsächliche verwaltete Vermögen (AUM) ist dieser Wert plus Barmittel (die nicht offengelegt werden). Richard Bernstein Advisors LLCs Top-Bestände sind iShares Trust - iShares MSCI Intl Quality Factor ETF (US:IQLT) , Janus Detroit Street Trust - Janus Henderson Mortgage-Backed Securities ETF (US:JMBS) , Vanguard Index Funds - Vanguard Value ETF (US:VTV) , Fidelity Covington Trust - Fidelity MSCI Information Technology Index ETF (US:FTEC) , and SPDR Series Trust - State Street SPDR Portfolio Intermediate Term Treasury ETF (US:SPTI) .
Top-Zuwächse in diesem Quartal
Wir verwenden die Veränderung der Portfolioallokation, weil dies die aussagekräftigste Kennzahl ist. Die Änderungen können auf Trades oder Änderungen der Aktienkurse zurückzuführen sein.
Top-Rückgänge in diesem Quartal
Wir verwenden die Veränderung der Portfolioallokation, weil dies die aussagekräftigste Kennzahl ist. Änderungen können auf Handelsgeschäfte oder Änderungen der Aktienkurse zurückzuführen sein.
| Wertpapier | Aktien (MM) |
Wert (MM$) |
Portfolio % | ΔPortfolio % |
|---|---|---|---|---|
| TLH / iShares Trust - iShares 10-20 Year Treasury Bond ETF | 1,07 | 111,03 | 3,1665 | -1,1144 |
| XLF / The Select Sector SPDR Trust - State Street Financial Select Sector SPDR ETF | 1,23 | 66,02 | 1,8829 | -0,8208 |
| MSFT / Microsoft Corporation | 0,06 | 29,30 | 0,8355 | -0,6605 |
| EXI / iShares Trust - iShares Global Industrials ETF | 0,24 | 41,53 | 1,1842 | -0,6111 |
| NVDA / NVIDIA Corporation | 0,19 | 36,31 | 1,0356 | -0,6049 |
| AAPL / Apple Inc. | 0,12 | 30,10 | 0,8583 | -0,4459 |
| AMZN / Amazon.com, Inc. | 0,07 | 16,24 | 0,4630 | -0,4078 |
| META / Meta Platforms, Inc. | 0,02 | 12,72 | 0,3629 | -0,3104 |
| AVGO / Broadcom Inc. | 0,04 | 11,74 | 0,3347 | -0,1788 |
| LLY / Eli Lilly and Company | 0,01 | 5,07 | 0,1447 | -0,1447 |
13F und Fondseinreichungen
Dieses Formular wurde am 2025-11-13 für den Berichtszeitraum eingereicht 2025-09-30. Klicken Sie auf das Link-Symbol , um den gesamten Transaktionsverlauf zu sehen.
Upgrade um die Prämiendaten zu entsperren und nach Excel zu exportieren ![]() .
.
| Wertpapier | Typ | Durchschnittlicher Aktienkurs | Aktien (MM) |
ΔAktien (%) |
Wert ($MM) |
ΔAktien (%) |
Portfolio (%) |
ΔPortfolio (%) |
|
|---|---|---|---|---|---|---|---|---|---|
| IQLT / iShares Trust - iShares MSCI Intl Quality Factor ETF | 10,53 | 15,32 | 467,37 | 18,39 | 13,3288 | 3,5871 | |||
| JMBS / Janus Detroit Street Trust - Janus Henderson Mortgage-Backed Securities ETF | 8,95 | -12,88 | 409,73 | -11,48 | 11,6849 | 0,2625 | |||
| VTV / Vanguard Index Funds - Vanguard Value ETF | 1,69 | -3,16 | 315,08 | 2,00 | 8,9856 | 1,3629 | |||
| FTEC / Fidelity Covington Trust - Fidelity MSCI Information Technology Index ETF | 1,36 | -3,15 | 311,23 | 12,20 | 8,8759 | 2,0309 | |||
| SPTI / SPDR Series Trust - State Street SPDR Portfolio Intermediate Term Treasury ETF | 8,02 | -2,72 | 232,14 | -2,17 | 6,6204 | 0,7647 | |||
| SPTS / SPDR Series Trust - State Street SPDR Portfolio Short Term Treasury ETF | 7,10 | -2,46 | 208,31 | -2,34 | 5,9408 | 0,6770 | |||
| EMXC / iShares, Inc. - iShares MSCI Emerging Markets ex China ETF | 2,83 | -2,22 | 195,31 | 6,83 | 5,5699 | 1,0585 | |||
| SDY / SPDR Series Trust - State Street SPDR S&P Dividend ETF | 1,04 | -3,34 | 144,35 | -1,10 | 4,1166 | 0,5149 | |||
| IXJ / iShares Trust - iShares Global Healthcare ETF | 1,31 | -3,02 | 117,35 | 1,03 | 3,3467 | 0,4805 | |||
| TLH / iShares Trust - iShares 10-20 Year Treasury Bond ETF | 1,07 | -37,10 | 111,03 | -36,00 | 3,1665 | -1,1144 | |||
| BAR / GraniteShares Gold Trust | 2,23 | -17,51 | 86,38 | -2,11 | 2,4634 | 0,2860 | |||
| XLC / The Select Sector SPDR Trust - State Street Communication Services Select Sector SPDR ETF | 0,68 | -3,83 | 79,89 | 3,52 | 2,2782 | 0,3739 | |||
| PZA / Invesco Exchange-Traded Fund Trust II - Invesco National AMT-Free Municipal Bond ETF | 3,07 | 71,31 | 2,0335 | 2,0335 | |||||
| XLF / The Select Sector SPDR Trust - State Street Financial Select Sector SPDR ETF | 1,23 | -41,40 | 66,02 | -39,74 | 1,8829 | -0,8208 | |||
| XLP / The Select Sector SPDR Trust - State Street Consumer Staples Select Sector SPDR ETF | 0,72 | -2,77 | 56,09 | -6,99 | 1,5997 | 0,1115 | |||
| FDIS / Fidelity Covington Trust - Fidelity MSCI Consumer Discretionary Index ETF | 0,49 | -2,77 | 50,59 | 6,25 | 1,4429 | 0,2678 | |||
| XLU / The Select Sector SPDR Trust - State Street Utilities Select Sector SPDR ETF | 0,54 | -2,78 | 47,70 | 4,77 | 1,3603 | 0,2368 | |||
| EXI / iShares Trust - iShares Global Industrials ETF | 0,24 | -45,37 | 41,53 | -42,92 | 1,1842 | -0,6111 | |||
| NVDA / NVIDIA Corporation | 0,19 | -53,75 | 36,31 | -45,38 | 1,0356 | -0,6049 | |||
| AAPL / Apple Inc. | 0,12 | -54,12 | 30,10 | -43,06 | 0,8583 | -0,4459 | |||
| MSFT / Microsoft Corporation | 0,06 | -53,59 | 29,30 | -51,68 | 0,8355 | -0,6605 | |||
| AMZN / Amazon.com, Inc. | 0,07 | -54,03 | 16,24 | -53,99 | 0,4630 | -0,4078 | |||
| QUAL / iShares Trust - iShares MSCI USA Quality Factor ETF | 0,07 | 0,31 | 13,24 | 6,72 | 0,3777 | 0,0715 | |||
| META / Meta Platforms, Inc. | 0,02 | -53,13 | 12,72 | -53,37 | 0,3629 | -0,3104 | |||
| AVGO / Broadcom Inc. | 0,04 | -52,87 | 11,74 | -43,60 | 0,3347 | -0,1788 | |||
| GOOGL / Alphabet Inc. | 0,05 | -52,03 | 11,37 | -33,82 | 0,3244 | -0,0997 | |||
| TSLA / Tesla, Inc. | 0,02 | -54,08 | 9,84 | -35,71 | 0,2807 | -0,0971 | |||
| GOOGL / Alphabet Inc. | 0,04 | -51,24 | 9,81 | -33,05 | 0,2798 | -0,0818 | |||
| JPM / JPMorgan Chase & Co. | 0,02 | -52,37 | 7,08 | -48,19 | 0,2018 | -0,1352 | |||
| BRK.A / Berkshire Hathaway Inc. | 0,01 | -51,27 | 5,79 | -49,57 | 0,1651 | -0,1182 | |||
| ITA / iShares Trust - iShares U.S. Aerospace & Defense ETF | 0,03 | -4,19 | 5,25 | 6,38 | 0,1499 | 0,0280 | |||
| WMT / Walmart Inc. | 0,05 | -55,69 | 5,25 | -53,29 | 0,1496 | -0,1276 | |||
| LLY / Eli Lilly and Company | 0,01 | -55,81 | 5,07 | -56,75 | 0,1447 | -0,1447 | |||
| GE / General Electric Company | 0,02 | -52,00 | 4,80 | -43,91 | 0,1370 | -0,0743 | |||
| JNJ / Johnson & Johnson | 0,02 | -53,46 | 4,32 | -43,51 | 0,1232 | -0,0655 | |||
| BSX / Boston Scientific Corporation | 0,04 | -54,52 | 4,17 | -58,66 | 0,1189 | -0,1300 | |||
| KO / The Coca-Cola Company | 0,05 | -49,81 | 3,62 | -52,95 | 0,1031 | -0,0865 | |||
| SPGI / S&P Global Inc. | 0,01 | -54,06 | 3,55 | -57,59 | 0,1013 | -0,1054 | |||
| PM / Philip Morris International Inc. | 0,02 | -53,81 | 3,47 | -58,87 | 0,0990 | -0,1092 | |||
| ABT / Abbott Laboratories | 0,02 | -55,80 | 3,35 | -56,47 | 0,0955 | -0,0943 | |||
| MKL / Markel Group Inc. | 0,00 | -50,18 | 3,35 | -52,34 | 0,0954 | -0,0778 | |||
| AIG / American International Group, Inc. | 0,04 | -42,52 | 3,32 | -47,25 | 0,0947 | -0,0607 | |||
| HWM / Howmet Aerospace Inc. | 0,02 | -46,08 | 3,31 | -43,17 | 0,0944 | -0,0493 | |||
| MO / Altria Group, Inc. | 0,05 | -54,41 | 3,28 | -48,64 | 0,0935 | -0,0640 | |||
| BAC / Bank of America Corporation | 0,06 | -47,41 | 3,24 | -42,67 | 0,0925 | -0,0471 | |||
| ETN / Eaton Corporation plc | 0,01 | -56,93 | 3,13 | -54,85 | 0,0891 | -0,0817 | |||
| ABBV / AbbVie Inc. | 0,01 | -59,10 | 3,09 | -48,99 | 0,0882 | -0,0614 | |||
| MCK / McKesson Corporation | 0,00 | -49,52 | 3,04 | -46,78 | 0,0866 | -0,0542 | |||
| COR / Cencora, Inc. | 0,01 | -56,86 | 2,92 | -55,04 | 0,0832 | -0,0769 | |||
| GD / General Dynamics Corporation | 0,01 | -55,01 | 2,90 | -47,41 | 0,0828 | -0,0534 | |||
| CEG / Constellation Energy Corporation | 0,01 | -60,81 | 2,88 | -60,05 | 0,0822 | -0,0958 | |||
| PEP / PepsiCo, Inc. | 0,02 | -52,41 | 2,85 | -49,38 | 0,0812 | -0,0576 | |||
| VICI / VICI Properties Inc. | 0,09 | -55,75 | 2,83 | -55,75 | 0,0806 | -0,0770 | |||
| CVX / Chevron Corporation | 0,02 | -33,18 | 2,80 | -27,55 | 0,0798 | -0,0155 | |||
| UNH / UnitedHealth Group Incorporated | 0,01 | -60,02 | 2,78 | -55,75 | 0,0794 | -0,0758 | |||
| XOM / Exxon Mobil Corporation | 0,02 | -27,46 | 2,68 | -24,12 | 0,0766 | -0,0107 | |||
| NOC / Northrop Grumman Corporation | 0,00 | -49,92 | 2,64 | -38,96 | 0,0753 | -0,0315 | |||
| WFC / Wells Fargo & Company | 0,03 | -54,85 | 2,62 | -52,77 | 0,0747 | -0,0621 | |||
| CAT / Caterpillar Inc. | 0,01 | -58,98 | 2,62 | -49,59 | 0,0746 | -0,0534 | |||
| GILD / Gilead Sciences, Inc. | 0,02 | -53,47 | 2,60 | -53,42 | 0,0742 | -0,0636 | |||
| EXC / Exelon Corporation | 0,06 | -53,66 | 2,54 | -51,97 | 0,0724 | -0,0580 | |||
| FE / FirstEnergy Corp. | 0,06 | -53,71 | 2,52 | -47,31 | 0,0719 | -0,0462 | |||
| PPL / PPL Corporation | 0,07 | -52,06 | 2,51 | -47,44 | 0,0717 | -0,0463 | |||
| CCEP / Coca-Cola Europacific Partners PLC | 0,03 | -52,17 | 2,50 | -53,37 | 0,0713 | -0,0610 | |||
| GEV / GE Vernova Inc. | 0,00 | -50,95 | 2,50 | -43,01 | 0,0713 | -0,0369 | |||
| IBM / International Business Machines Corporation | 0,01 | -49,77 | 2,49 | -51,92 | 0,0711 | -0,0568 | |||
| CL / Colgate-Palmolive Company | 0,03 | -54,33 | 2,48 | -59,85 | 0,0706 | -0,0815 | |||
| AM / Antero Midstream Corporation | 0,13 | -44,40 | 2,45 | -42,96 | 0,0700 | -0,0362 | |||
| KMB / Kimberly-Clark Corporation | 0,02 | -54,25 | 2,42 | -55,88 | 0,0689 | -0,0662 | |||
| GJR / Strats Trust For Procter & Gambel Security - Preferred Security | 0,02 | -53,72 | 2,40 | -55,36 | 0,0685 | -0,0643 | |||
| UBER / Uber Technologies, Inc. | 0,02 | -58,01 | 2,38 | -55,91 | 0,0680 | -0,0654 | |||
| BKNG / Booking Holdings Inc. | 0,00 | -50,00 | 2,37 | -53,36 | 0,0676 | -0,0578 | |||
| AMD / Advanced Micro Devices, Inc. | 0,01 | -44,25 | 2,27 | -36,45 | 0,0648 | -0,0234 | |||
| MA / Mastercard Incorporated | 0,00 | -58,10 | 2,25 | -57,59 | 0,0642 | -0,0668 | |||
| TRGP / Targa Resources Corp. | 0,01 | -14,78 | 2,21 | -17,97 | 0,0631 | -0,0035 | |||
| AXP / American Express Company | 0,01 | -43,84 | 2,21 | -41,51 | 0,0631 | -0,0303 | |||
| ANET / Arista Networks, Inc. | 0,02 | -54,38 | 2,20 | -35,04 | 0,0628 | -0,0208 | |||
| ETR / Entergy Corporation | 0,02 | -52,12 | 2,20 | -46,34 | 0,0627 | -0,0384 | |||
| GLW / Corning Incorporated | 0,03 | -51,36 | 2,19 | -24,13 | 0,0625 | -0,0088 | |||
| WDC / Western Digital Corporation | 0,02 | -53,78 | 2,18 | -13,29 | 0,0622 | 0,0001 | |||
| GEHC / GE HealthCare Technologies Inc. | 0,03 | -54,31 | 2,17 | -53,67 | 0,0617 | -0,0536 | |||
| PCG / PG&E Corporation | 0,14 | -55,09 | 2,12 | -51,42 | 0,0605 | -0,0473 | |||
| CAH / Cardinal Health, Inc. | 0,01 | -45,01 | 2,11 | -48,63 | 0,0601 | -0,0411 | |||
| RTX / RTX Corporation | 0,01 | -50,78 | 2,08 | -43,61 | 0,0594 | -0,0317 | |||
| MDLZ / Mondelez International, Inc. | 0,03 | -51,65 | 2,08 | -55,21 | 0,0594 | -0,0553 | |||
| FOX / Fox Corporation | 0,04 | -52,72 | 2,06 | -47,54 | 0,0586 | -0,0381 | |||
| ISRG / Intuitive Surgical, Inc. | 0,00 | -46,79 | 2,03 | -56,21 | 0,0578 | -0,0564 | |||
| LIN / Linde plc | 0,00 | -54,08 | 2,02 | -53,53 | 0,0577 | -0,0497 | |||
| APG / APi Group Corporation | 0,06 | -12,25 | 2,00 | -40,93 | 0,0571 | -0,0265 | |||
| V / Visa Inc. | 0,01 | -34,85 | 1,97 | -37,36 | 0,0562 | -0,0214 | |||
| HLI / Houlihan Lokey, Inc. | 0,01 | -59,39 | 1,94 | -53,66 | 0,0554 | -0,0481 | |||
| JCI / Johnson Controls International plc | 0,02 | -54,83 | 1,93 | -52,98 | 0,0550 | -0,0462 | |||
| MDT / Medtronic plc | 0,02 | -61,68 | 1,92 | -58,15 | 0,0549 | -0,0586 | |||
| VST / Vistra Corp. | 0,01 | -49,96 | 1,92 | -49,42 | 0,0549 | -0,0390 | |||
| PCAR / PACCAR Inc | 0,02 | -54,81 | 1,92 | -53,27 | 0,0548 | -0,0467 | |||
| HD / The Home Depot, Inc. | 0,00 | -52,24 | 1,87 | -47,21 | 0,0534 | -0,0342 | |||
| CSCO / Cisco Systems, Inc. | 0,03 | -51,36 | 1,86 | -52,02 | 0,0531 | -0,0426 | |||
| HIG / The Hartford Insurance Group, Inc. | 0,01 | -53,04 | 1,85 | -50,64 | 0,0527 | -0,0397 | |||
| T / AT&T Inc. | 0,07 | -53,58 | 1,85 | -54,69 | 0,0527 | -0,0480 | |||
| ACT / Enact Holdings, Inc. | 0,05 | -46,89 | 1,83 | -45,18 | 0,0522 | -0,0302 | |||
| HCA / HCA Healthcare, Inc. | 0,00 | -62,16 | 1,83 | -57,91 | 0,0522 | -0,0550 | |||
| EQH / Equitable Holdings, Inc. | 0,04 | -59,26 | 1,81 | -63,14 | 0,0515 | -0,0694 | |||
| CARR / Carrier Global Corporation | 0,03 | -51,52 | 1,81 | -60,46 | 0,0515 | -0,0612 | |||
| MU / Micron Technology, Inc. | 0,01 | -55,18 | 1,78 | -39,16 | 0,0507 | -0,0214 | |||
| SO / The Southern Company | 0,02 | -50,54 | 1,78 | -48,97 | 0,0507 | -0,0352 | |||
| KVUE / Kenvue Inc. | 0,11 | -55,08 | 1,78 | -65,16 | 0,0506 | -0,0751 | |||
| C / Citigroup Inc. | 0,02 | -61,24 | 1,76 | -53,78 | 0,0502 | -0,0438 | |||
| MRK / Merck & Co., Inc. | 0,02 | -46,78 | 1,74 | -43,57 | 0,0497 | -0,0265 | |||
| DUK / Duke Energy Corporation | 0,01 | -51,20 | 1,71 | -48,84 | 0,0489 | -0,0338 | |||
| NVT / nVent Electric plc | 0,02 | -61,31 | 1,69 | -47,90 | 0,0482 | -0,0319 | |||
| URI / United Rentals, Inc. | 0,00 | -54,99 | 1,68 | -42,99 | 0,0481 | -0,0248 | |||
| GS / The Goldman Sachs Group, Inc. | 0,00 | -54,58 | 1,66 | -48,89 | 0,0474 | -0,0328 | |||
| STZ / Constellation Brands, Inc. | 0,01 | -55,15 | 1,65 | -62,87 | 0,0471 | -0,0627 | |||
| PGR / The Progressive Corporation | 0,01 | -27,97 | 1,61 | -33,35 | 0,0458 | -0,0137 | |||
| CRBG / Corebridge Financial, Inc. | 0,05 | -59,74 | 1,61 | -63,66 | 0,0458 | -0,0633 | |||
| FIS / Fidelity National Information Services, Inc. | 0,02 | -45,32 | 1,60 | -55,73 | 0,0456 | -0,0435 | |||
| D / Dominion Energy, Inc. | 0,03 | -50,45 | 1,60 | -46,39 | 0,0455 | -0,0279 | |||
| TT / Trane Technologies plc | 0,00 | -55,08 | 1,58 | -56,67 | 0,0450 | -0,0449 | |||
| TPG / TPG Inc. | 0,03 | -55,62 | 1,57 | -51,38 | 0,0447 | -0,0349 | |||
| ARES / Ares Management Corporation | 0,01 | -42,13 | 1,56 | -46,58 | 0,0445 | -0,0276 | |||
| DAL / Delta Air Lines, Inc. | 0,03 | -57,83 | 1,56 | -51,34 | 0,0444 | -0,0346 | |||
| GLDM / World Gold Trust - SPDR Gold MiniShares Trust | 0,02 | -4,08 | 1,55 | 11,91 | 0,0442 | 0,0100 | |||
| NWSA / News Corporation | 0,04 | -54,24 | 1,55 | -53,93 | 0,0442 | -0,0388 | |||
| KKR / KKR & Co. Inc. | 0,01 | -57,92 | 1,53 | -58,89 | 0,0437 | -0,0483 | |||
| ALL / The Allstate Corporation | 0,01 | -56,16 | 1,52 | -53,27 | 0,0433 | -0,0368 | |||
| SYK / Stryker Corporation | 0,00 | -61,88 | 1,51 | -64,40 | 0,0431 | -0,0616 | |||
| ZBH / Zimmer Biomet Holdings, Inc. | 0,02 | -54,96 | 1,50 | -51,37 | 0,0427 | -0,0332 | |||
| APO / Apollo Global Management, Inc. | 0,01 | -54,46 | 1,49 | -57,22 | 0,0424 | -0,0433 | |||
| HLNE / Hamilton Lane Incorporated | 0,01 | -59,76 | 1,48 | -61,83 | 0,0421 | -0,0534 | |||
| WM / Waste Management, Inc. | 0,01 | -59,36 | 1,48 | -60,79 | 0,0421 | -0,0508 | |||
| LMT / Lockheed Martin Corporation | 0,00 | -55,93 | 1,47 | -52,51 | 0,0419 | -0,0344 | |||
| SRE / Sempra | 0,02 | -51,26 | 1,47 | -42,11 | 0,0419 | -0,0207 | |||
| FTV / Fortive Corporation | 0,03 | -48,18 | 1,46 | -51,32 | 0,0415 | -0,0323 | |||
| MRVL / Marvell Technology, Inc. | 0,02 | -44,31 | 1,45 | -39,51 | 0,0415 | -0,0178 | |||
| SYY / Sysco Corporation | 0,02 | -51,16 | 1,45 | -46,89 | 0,0414 | -0,0260 | |||
| DE / Deere & Company | 0,00 | -59,13 | 1,45 | -63,26 | 0,0413 | -0,0559 | |||
| VRTX / Vertex Pharmaceuticals Incorporated | 0,00 | -52,37 | 1,45 | -58,12 | 0,0412 | -0,0439 | |||
| CRM / Salesforce, Inc. | 0,01 | -54,21 | 1,43 | -60,22 | 0,0409 | -0,0480 | |||
| ADP / Automatic Data Processing, Inc. | 0,00 | -51,26 | 1,42 | -53,62 | 0,0404 | -0,0350 | |||
| CVS / CVS Health Corporation | 0,02 | -51,07 | 1,40 | -46,52 | 0,0399 | -0,0247 | |||
| TW / Tradeweb Markets Inc. | 0,01 | -44,85 | 1,40 | -58,19 | 0,0398 | -0,0426 | |||
| NEE / NextEra Energy, Inc. | 0,02 | -51,21 | 1,38 | -46,95 | 0,0394 | -0,0249 | |||
| COF / Capital One Financial Corporation | 0,01 | -57,23 | 1,38 | -57,27 | 0,0393 | -0,0403 | |||
| EIX / Edison International | 0,02 | -53,45 | 1,38 | -50,14 | 0,0393 | -0,0289 | |||
| XYZ / Block, Inc. | 0,02 | -57,18 | 1,37 | -54,45 | 0,0391 | -0,0352 | |||
| CME / CME Group Inc. | 0,00 | -63,44 | 1,33 | -64,16 | 0,0380 | -0,0538 | |||
| PFE / Pfizer Inc. | 0,05 | -55,72 | 1,33 | -53,45 | 0,0379 | -0,0326 | |||
| AMGN / Amgen Inc. | 0,00 | -64,93 | 1,32 | -64,55 | 0,0376 | -0,0542 | |||
| CSX / CSX Corporation | 0,04 | -52,57 | 1,31 | -48,37 | 0,0375 | -0,0253 | |||
| CTVA / Corteva, Inc. | 0,02 | -62,87 | 1,31 | -66,32 | 0,0374 | -0,0587 | |||
| PEG / Public Service Enterprise Group Incorporated | 0,02 | -51,11 | 1,29 | -51,56 | 0,0368 | -0,0289 | |||
| ITW / Illinois Tool Works Inc. | 0,00 | -62,74 | 1,26 | -60,70 | 0,0360 | -0,0432 | |||
| OTIS / Otis Worldwide Corporation | 0,01 | -61,25 | 1,25 | -64,23 | 0,0357 | -0,0507 | |||
| LHX / L3Harris Technologies, Inc. | 0,00 | -66,30 | 1,24 | -58,98 | 0,0353 | -0,0391 | |||
| UNP / Union Pacific Corporation | 0,01 | -55,30 | 1,23 | -54,07 | 0,0351 | -0,0310 | |||
| CNP / CenterPoint Energy, Inc. | 0,03 | -51,16 | 1,23 | -48,44 | 0,0350 | -0,0237 | |||
| HON / Honeywell International Inc. | 0,01 | -54,25 | 1,22 | -58,65 | 0,0348 | -0,0380 | |||
| TSN / Tyson Foods, Inc. | 0,02 | -50,99 | 1,21 | -52,45 | 0,0346 | -0,0283 | |||
| CB / Chubb Limited | 0,00 | -51,11 | 1,20 | -52,37 | 0,0343 | -0,0280 | |||
| ACGL / Arch Capital Group Ltd. | 0,01 | -51,13 | 1,20 | -51,30 | 0,0341 | -0,0265 | |||
| BMY / Bristol-Myers Squibb Company | 0,03 | -60,93 | 1,18 | -61,93 | 0,0336 | -0,0427 | |||
| F / Ford Motor Company | 0,10 | -58,03 | 1,17 | -53,73 | 0,0333 | -0,0289 | |||
| KR / The Kroger Co. | 0,02 | -51,01 | 1,14 | -53,99 | 0,0326 | -0,0287 | |||
| PYPL / PayPal Holdings, Inc. | 0,02 | -60,05 | 1,14 | -63,96 | 0,0326 | -0,0456 | |||
| CI / The Cigna Group | 0,00 | -50,57 | 1,08 | -56,91 | 0,0308 | -0,0310 | |||
| EQIX / Equinix, Inc. | 0,00 | -61,00 | 1,07 | -61,61 | 0,0306 | -0,0383 | |||
| PRU / Prudential Financial, Inc. | 0,01 | -58,27 | 1,05 | -59,72 | 0,0299 | -0,0343 | |||
| IR / Ingersoll Rand Inc. | 0,01 | -58,44 | 1,03 | -58,74 | 0,0294 | -0,0323 | |||
| OWL / Blue Owl Capital Inc. | 0,06 | -57,42 | 0,98 | -62,50 | 0,0279 | -0,0364 | |||
| ABNB / Airbnb, Inc. | 0,01 | -57,90 | 0,98 | -61,38 | 0,0278 | -0,0345 | |||
| UHALB / U-Haul Holding Company - Series N | 0,02 | -62,71 | 0,95 | -65,11 | 0,0270 | -0,0400 | |||
| HPQ / HP Inc. | 0,03 | -51,26 | 0,94 | -45,79 | 0,0268 | -0,0160 | |||
| TEAM / Atlassian Corporation | 0,01 | -58,19 | 0,89 | -67,15 | 0,0254 | -0,0415 | |||
| BDX / Becton, Dickinson and Company | 0,00 | -63,84 | 0,89 | -60,74 | 0,0254 | -0,0305 | |||
| PLD / Prologis, Inc. | 0,01 | -61,45 | 0,89 | -58,01 | 0,0253 | -0,0269 | |||
| O / Realty Income Corporation | 0,01 | -55,68 | 0,87 | -53,24 | 0,0249 | -0,0212 | |||
| FDX / FedEx Corporation | 0,00 | -52,71 | 0,84 | -50,96 | 0,0239 | -0,0183 | |||
| IQV / IQVIA Holdings Inc. | 0,00 | -64,23 | 0,83 | -56,87 | 0,0237 | -0,0239 | |||
| ADBE / Adobe Inc. | 0,00 | -54,82 | 0,79 | -58,81 | 0,0224 | -0,0247 | |||
| SNDR / Schneider National, Inc. | 0,04 | -62,47 | 0,77 | -67,14 | 0,0219 | -0,0358 | |||
| GFS / GLOBALFOUNDRIES Inc. | 0,02 | -47,65 | 0,76 | -50,94 | 0,0217 | -0,0165 | |||
| REGN / Regeneron Pharmaceuticals, Inc. | 0,00 | -64,96 | 0,74 | -62,51 | 0,0212 | -0,0277 | |||
| VT / Vanguard International Equity Index Funds - Vanguard Total World Stock ETF | 0,00 | -9,93 | 0,57 | -1,37 | 0,0164 | 0,0020 | |||
| RSPT / Invesco Exchange-Traded Fund Trust - Invesco S&P 500 Equal Weight Technology ETF | 0,01 | -1,07 | 0,51 | 13,17 | 0,0145 | 0,0034 | |||
| RAL / Ralliant Corporation | 0,01 | -48,18 | 0,43 | -53,29 | 0,0124 | -0,0105 | |||
| SPSM / SPDR Series Trust - State Street SPDR Portfolio S&P 600TM Small Cap ETF | 0,01 | -23,54 | 0,25 | -17,70 | 0,0072 | -0,0004 | |||
| AOR / iShares Trust - iShares Core 60/40 Balanced Allocation ETF | 0,00 | -66,60 | 0,22 | -64,75 | 0,0061 | -0,0089 | |||
| VGK / Vanguard International Equity Index Funds - Vanguard FTSE Europe ETF | 0,00 | -3,45 | 0,18 | 0,00 | 0,0051 | 0,0007 | |||
| EAOR / iShares Trust - iShares ESG Aware 60/40 Balanced Allocation ETF | 0,00 | -6,88 | 0,15 | -1,32 | 0,0043 | 0,0005 | |||
| EZU / iShares, Inc. - iShares MSCI Eurozone ETF | 0,00 | -20,63 | 0,11 | -17,39 | 0,0033 | -0,0001 | |||
| MCHI / iShares Trust - iShares MSCI China ETF | 0,00 | 0,09 | 0,07 | 15,87 | 0,0021 | 0,0005 | |||
| BBCA / J.P. Morgan Exchange-Traded Fund Trust - JPMorgan BetaBuilders Canada ETF | 0,00 | -0,64 | 0,05 | 6,00 | 0,0015 | 0,0003 | |||
| KXI / iShares Trust - iShares Global Consumer Staples ETF | 0,00 | -8,96 | 0,05 | -11,54 | 0,0013 | 0,0000 | |||
| RSPD / Invesco Exchange-Traded Fund Trust - Invesco S&P 500 Equal Weight Consumer Discretionary ETF | 0,00 | -3,15 | 0,04 | 2,33 | 0,0013 | 0,0002 | |||
| ACWI / iShares Trust - iShares MSCI ACWI ETF | 0,00 | -63,47 | 0,03 | -60,00 | 0,0010 | -0,0011 | |||
| XLK / The Select Sector SPDR Trust - State Street Technology Select Sector SPDR ETF | 0,00 | -13,58 | 0,02 | 5,00 | 0,0006 | 0,0001 | |||
| BBJP / J.P. Morgan Exchange-Traded Fund Trust - JPMorgan BetaBuilders Japan ETF | 0,00 | -12,63 | 0,02 | -5,56 | 0,0005 | 0,0001 | |||
| JAAA / Janus Detroit Street Trust - Janus Henderson AAA CLO ETF | 0,00 | -3,46 | 0,01 | 0,00 | 0,0004 | 0,0000 | |||
| XLE / The Select Sector SPDR Trust - State Street Energy Select Sector SPDR ETF | 0,00 | 0,00 | 0,01 | 12,50 | 0,0003 | 0,0000 | |||
| IVOL / KraneShares Trust - Quadratic Interest Rate Volatility and Inflation Hedge ETF | 0,00 | -26,35 | 0,01 | -28,57 | 0,0002 | -0,0000 | |||
| AOM / iShares Trust - iShares Core 40/60 Moderate Allocation ETF | 0,00 | -7,02 | 0,00 | 0,00 | 0,0001 | 0,0000 | |||
| MBB / iShares Trust - iShares MBS ETF | 0,00 | 10,00 | 0,00 | 0,00 | 0,0000 | 0,0000 | |||
| BIL / SPDR Series Trust - State Street SPDR Bloomberg 1-3 Month T-Bill ETF | 0,00 | -73,33 | 0,00 | -100,00 | 0,0000 | -0,0000 | |||
| IXG / iShares Trust - iShares Global Financials ETF | 0,00 | 0,00 | 0,00 | 0,0000 | 0,0000 | ||||
| INDA / iShares Trust - iShares MSCI India ETF | 0,00 | -100,00 | 0,00 | 0,0000 | |||||
| ACWV / iShares, Inc. - iShares MSCI Global Min Vol Factor ETF | 0,00 | -100,00 | 0,00 | 0,0000 | |||||
| CNC / Centene Corporation | 0,00 | -100,00 | 0,00 | 0,0000 | |||||
| EWT / iShares, Inc. - iShares MSCI Taiwan ETF | 0,00 | -100,00 | 0,00 | 0,0000 | |||||
| XLV / The Select Sector SPDR Trust - State Street Health Care Select Sector SPDR ETF | 0,00 | -100,00 | 0,00 | 0,0000 | |||||
| UPS / United Parcel Service, Inc. | 0,00 | -100,00 | 0,00 | 0,0000 | |||||
| EWY / iShares, Inc. - iShares MSCI South Korea ETF | 0,00 | -100,00 | 0,00 | 0,0000 | |||||
| DOW / Dow Inc. | 0,00 | -100,00 | 0,00 | 0,0000 | |||||
| AGG / iShares Trust - iShares Core U.S. Aggregate Bond ETF | 0,00 | -100,00 | 0,00 | -100,00 | -0,0229 |