Basisstatistiken
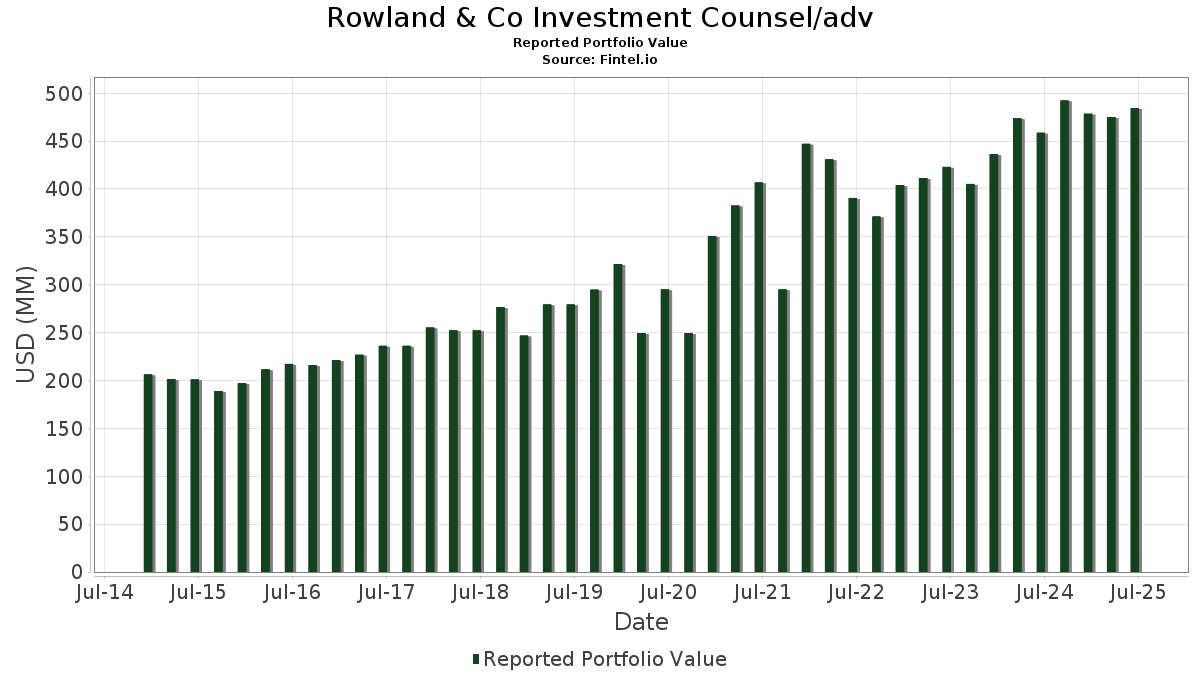
| Portfolio-Wert | $ 509.118.024 |
| Aktuelle Positionen | 187 |
Neueste Bestände, Performance, AUM (aus 13F, 13D)
Rowland & Co Investment Counsel/adv hat 187 Gesamtbeteiligungen in seinen letzten SEC-Einreichungen offengelegt. Der jüngste Portfoliowert wird auf $ 509.118.024 USD berechnet. Das tatsächliche verwaltete Vermögen (AUM) ist dieser Wert plus Barmittel (die nicht offengelegt werden). Rowland & Co Investment Counsel/advs Top-Bestände sind Apple Inc. (US:AAPL) , The Progressive Corporation (US:PGR) , Microsoft Corporation (US:MSFT) , Alphabet Inc. (US:GOOG) , and Walmart Inc. (US:WMT) . Rowland & Co Investment Counsel/advs neue Positionen sind T-Mobile US, Inc. (US:TMUS) , Advanced Micro Devices, Inc. (US:AMD) , Techtronic Industries Company Limited - Depositary Receipt (Common Stock) (US:TTNDY) , BWX Technologies, Inc. (US:BWXT) , and Celestica Inc. (CA:CLS) .
Top-Zuwächse in diesem Quartal
Wir verwenden die Veränderung der Portfolioallokation, weil dies die aussagekräftigste Kennzahl ist. Die Änderungen können auf Trades oder Änderungen der Aktienkurse zurückzuführen sein.
| Wertpapier | Aktien (MM) |
Wert (MM$) |
Portfolio % | ΔPortfolio % |
|---|---|---|---|---|
| GOOG / Alphabet Inc. | 0,09 | 21,48 | 4,2197 | 0,9830 |
| AAPL / Apple Inc. | 0,14 | 34,39 | 6,7544 | 0,9787 |
| CMI / Cummins Inc. | 0,02 | 9,74 | 1,9125 | 0,3264 |
| ABBV / AbbVie Inc. | 0,04 | 10,39 | 2,0404 | 0,2972 |
| INTC / Intel Corporation | 0,18 | 6,07 | 1,1914 | 0,2889 |
| IDCC / InterDigital, Inc. | 0,01 | 4,18 | 0,8214 | 0,2603 |
| JNJ / Johnson & Johnson | 0,07 | 12,29 | 2,4133 | 0,2270 |
| NVDD / Direxion Shares ETF Trust - Direxion Daily NVDA Bear 1X Shares | 0,04 | 8,01 | 1,5737 | 0,1836 |
| UNH / UnitedHealth Group Incorporated | 0,00 | 1,58 | 0,3102 | 0,1580 |
| CVX / Chevron Corporation | 0,05 | 8,15 | 1,6015 | 0,1283 |
Top-Rückgänge in diesem Quartal
Wir verwenden die Veränderung der Portfolioallokation, weil dies die aussagekräftigste Kennzahl ist. Änderungen können auf Handelsgeschäfte oder Änderungen der Aktienkurse zurückzuführen sein.
| Wertpapier | Aktien (MM) |
Wert (MM$) |
Portfolio % | ΔPortfolio % |
|---|---|---|---|---|
| PGR / The Progressive Corporation | 0,11 | 26,27 | 5,1592 | -1,0324 |
| LLY / Eli Lilly and Company | 0,02 | 13,27 | 2,6073 | -0,4611 |
| ADP / Automatic Data Processing, Inc. | 0,06 | 17,42 | 3,4222 | -0,4420 |
| KO / The Coca-Cola Company | 0,21 | 13,92 | 2,7333 | -0,3433 |
| MSFT / Microsoft Corporation | 0,05 | 24,89 | 4,8879 | -0,3432 |
| UPS / United Parcel Service, Inc. | 0,05 | 3,90 | 0,7668 | -0,2203 |
| CPRT / Copart, Inc. | 0,10 | 4,56 | 0,8963 | -0,2055 |
| CTAS / Cintas Corporation | 0,02 | 4,39 | 0,8632 | -0,1917 |
| CB / Chubb Limited | 0,04 | 9,93 | 1,9506 | -0,1840 |
| PAYX / Paychex, Inc. | 0,03 | 3,77 | 0,7412 | -0,1659 |
13F und Fondseinreichungen
Dieses Formular wurde am 2025-10-01 für den Berichtszeitraum eingereicht 2025-09-30. Klicken Sie auf das Link-Symbol , um den gesamten Transaktionsverlauf zu sehen.
Upgrade um die Prämiendaten zu entsperren und nach Excel zu exportieren ![]() .
.
| Wertpapier | Typ | Durchschnittlicher Aktienkurs | Aktien (MM) |
ΔAktien (%) |
Wert ($MM) |
ΔAktien (%) |
Portfolio (%) |
ΔPortfolio (%) |
|
|---|---|---|---|---|---|---|---|---|---|
| AAPL / Apple Inc. | 0,14 | -0,99 | 34,39 | 22,88 | 6,7544 | 0,9787 | |||
| PGR / The Progressive Corporation | 0,11 | -5,38 | 26,27 | -12,44 | 5,1592 | -1,0324 | |||
| MSFT / Microsoft Corporation | 0,05 | -5,71 | 24,89 | -1,81 | 4,8879 | -0,3432 | |||
| GOOG / Alphabet Inc. | 0,09 | -0,22 | 21,48 | 36,99 | 4,2197 | 0,9830 | |||
| WMT / Walmart Inc. | 0,18 | -3,49 | 18,58 | 1,72 | 3,6500 | -0,1202 | |||
| ADP / Automatic Data Processing, Inc. | 0,06 | -2,22 | 17,42 | -6,94 | 3,4222 | -0,4420 | |||
| KO / The Coca-Cola Company | 0,21 | -0,41 | 13,92 | -6,65 | 2,7333 | -0,3433 | |||
| LLY / Eli Lilly and Company | 0,02 | -8,78 | 13,27 | -10,72 | 2,6073 | -0,4611 | |||
| HD / The Home Depot, Inc. | 0,03 | -1,13 | 12,59 | 9,26 | 2,4722 | 0,0948 | |||
| JNJ / Johnson & Johnson | 0,07 | -4,45 | 12,29 | 15,98 | 2,4133 | 0,2270 | |||
| MCD / McDonald's Corporation | 0,04 | -0,67 | 11,66 | 3,32 | 2,2893 | -0,0390 | |||
| QCOM / QUALCOMM Incorporated | 0,07 | 0,02 | 11,38 | 4,49 | 2,2354 | -0,0127 | |||
| ABBV / AbbVie Inc. | 0,04 | -1,40 | 10,39 | 23,00 | 2,0404 | 0,2972 | |||
| CB / Chubb Limited | 0,04 | -1,44 | 9,93 | -3,98 | 1,9506 | -0,1840 | |||
| CMI / Cummins Inc. | 0,02 | -1,76 | 9,74 | 26,70 | 1,9125 | 0,3264 | |||
| XOM / Exxon Mobil Corporation | 0,08 | -0,92 | 9,37 | 3,63 | 1,8401 | -0,0256 | |||
| VZ / Verizon Communications Inc. | 0,21 | 10,09 | 9,34 | 11,81 | 1,8351 | 0,1106 | |||
| TFC / Truist Financial Corporation | 0,19 | -1,07 | 8,71 | 5,22 | 1,7104 | 0,0022 | |||
| CVX / Chevron Corporation | 0,05 | 5,32 | 8,15 | 14,22 | 1,6015 | 0,1283 | |||
| JPM / JPMorgan Chase & Co. | 0,03 | 1,21 | 8,02 | 10,12 | 1,5750 | 0,0721 | |||
| NVDD / Direxion Shares ETF Trust - Direxion Daily NVDA Bear 1X Shares | 0,04 | 0,73 | 8,01 | 18,95 | 1,5737 | 0,1836 | |||
| GPC / Genuine Parts Company | 0,05 | -1,63 | 7,41 | 12,39 | 1,4562 | 0,0947 | |||
| CFR / Cullen/Frost Bankers, Inc. | 0,05 | 1,86 | 6,81 | 0,46 | 1,3372 | -0,0615 | |||
| INTC / Intel Corporation | 0,18 | -7,39 | 6,07 | 38,72 | 1,1914 | 0,2889 | |||
| COST / Costco Wholesale Corporation | 0,01 | 15,59 | 5,40 | 8,08 | 1,0611 | 0,0295 | |||
| VRT / Vertiv Holdings Co | 0,04 | -1,56 | 5,32 | 15,65 | 1,0450 | 0,0955 | |||
| SYY / Sysco Corporation | 0,06 | -1,47 | 4,87 | 7,11 | 0,9565 | 0,0182 | |||
| ZBRA / Zebra Technologies Corporation | 0,02 | -3,46 | 4,64 | -6,98 | 0,9115 | -0,1180 | |||
| CPRT / Copart, Inc. | 0,10 | -6,73 | 4,56 | -14,52 | 0,8963 | -0,2055 | |||
| SMCI / Super Micro Computer, Inc. | 0,10 | 4,29 | 4,56 | 2,01 | 0,8957 | -0,0269 | |||
| AMGN / Amgen Inc. | 0,02 | -9,61 | 4,46 | -8,65 | 0,8754 | -0,1315 | |||
| CTAS / Cintas Corporation | 0,02 | -6,65 | 4,39 | -14,03 | 0,8632 | -0,1917 | |||
| IDCC / InterDigital, Inc. | 0,01 | -0,10 | 4,18 | 53,83 | 0,8214 | 0,2603 | |||
| UPS / United Parcel Service, Inc. | 0,05 | -1,36 | 3,90 | -18,38 | 0,7668 | -0,2203 | |||
| PAYX / Paychex, Inc. | 0,03 | -1,48 | 3,77 | -14,15 | 0,7412 | -0,1659 | |||
| COP / ConocoPhillips | 0,04 | -3,14 | 3,77 | 2,11 | 0,7407 | -0,0217 | |||
| TROW / T. Rowe Price Group, Inc. | 0,04 | -7,47 | 3,70 | -1,59 | 0,7274 | -0,0492 | |||
| GILD / Gilead Sciences, Inc. | 0,03 | -2,87 | 3,65 | -2,75 | 0,7167 | -0,0577 | |||
| WY / Weyerhaeuser Company | 0,15 | 5,29 | 3,65 | 1,62 | 0,7163 | -0,0245 | |||
| EMR / Emerson Electric Co. | 0,03 | 3,34 | 3,47 | 1,67 | 0,6814 | -0,0228 | |||
| MRK / Merck & Co., Inc. | 0,04 | -1,38 | 3,39 | 4,57 | 0,6649 | -0,0033 | |||
| WM / Waste Management, Inc. | 0,01 | 0,00 | 3,28 | -3,50 | 0,6441 | -0,0572 | |||
| DUK / Duke Energy Corporation | 0,03 | -1,44 | 3,24 | 3,38 | 0,6361 | -0,0106 | |||
| CSX / CSX Corporation | 0,09 | -1,23 | 3,11 | 7,47 | 0,6104 | 0,0137 | |||
| PKG / Packaging Corporation of America | 0,01 | 0,09 | 3,11 | 15,77 | 0,6102 | 0,0563 | |||
| SWKS / Skyworks Solutions, Inc. | 0,04 | 24,02 | 3,09 | 28,10 | 0,6063 | 0,1091 | |||
| AFL / Aflac Incorporated | 0,03 | -1,50 | 3,02 | 4,32 | 0,5927 | -0,0042 | |||
| AMZN / Amazon.com, Inc. | 0,01 | 21,45 | 2,83 | 21,54 | 0,5566 | 0,0755 | |||
| SON / Sonoco Products Company | 0,06 | -0,11 | 2,79 | -1,20 | 0,5479 | -0,0348 | |||
| KMB / Kimberly-Clark Corporation | 0,02 | -6,49 | 2,49 | -9,82 | 0,4891 | -0,0808 | |||
| WERN / Werner Enterprises, Inc. | 0,09 | -11,62 | 2,42 | -15,00 | 0,4753 | -0,1121 | |||
| TXN / Texas Instruments Incorporated | 0,01 | 0,16 | 2,37 | -11,39 | 0,4647 | -0,0862 | |||
| NEE / NextEra Energy, Inc. | 0,03 | 21,58 | 2,30 | 32,24 | 0,4512 | 0,0926 | |||
| ENVA / Enova International, Inc. | 0,02 | -10,84 | 2,26 | -7,99 | 0,4435 | -0,0630 | |||
| MDT / Medtronic plc | 0,02 | 32,19 | 2,16 | 44,44 | 0,4234 | 0,1154 | |||
| BA / The Boeing Company | 0,01 | -3,58 | 2,15 | -0,69 | 0,4223 | -0,0245 | |||
| PFE / Pfizer Inc. | 0,08 | 2,37 | 2,09 | 7,61 | 0,4110 | 0,0097 | |||
| TECH / Bio-Techne Corporation | 0,04 | -7,66 | 2,08 | -0,14 | 0,4084 | -0,0214 | |||
| ISRG / Intuitive Surgical, Inc. | 0,00 | 65,67 | 2,05 | 36,35 | 0,4031 | 0,0924 | |||
| META / Meta Platforms, Inc. | 0,00 | -13,74 | 2,02 | -14,16 | 0,3976 | -0,0892 | |||
| PSA / Public Storage | 0,01 | 1,95 | 1,95 | 0,36 | 0,3823 | -0,0180 | |||
| SNA / Snap-on Incorporated | 0,01 | 0,07 | 1,86 | 11,48 | 0,3661 | 0,0209 | |||
| BLK / BlackRock, Inc. | 0,00 | 24,33 | 1,83 | 38,76 | 0,3601 | 0,0873 | |||
| DIS / The Walt Disney Company | 0,02 | -13,08 | 1,78 | -19,74 | 0,3490 | -0,1079 | |||
| COF / Capital One Financial Corporation | 0,01 | -1,56 | 1,77 | -1,67 | 0,3468 | -0,0237 | |||
| PSX / Phillips 66 | 0,01 | 0,55 | 1,74 | 14,66 | 0,3411 | 0,0285 | |||
| ORCL / Oracle Corporation | 0,01 | -4,56 | 1,67 | 22,77 | 0,3274 | 0,0472 | |||
| UNH / UnitedHealth Group Incorporated | 0,00 | 93,53 | 1,58 | 114,25 | 0,3102 | 0,1580 | |||
| EXPD / Expeditors International of Washington, Inc. | 0,01 | -0,79 | 1,54 | 6,44 | 0,3022 | 0,0039 | |||
| GJR / Strats Trust For Procter & Gambel Security - Preferred Security | 0,01 | 0,02 | 1,44 | -3,54 | 0,2837 | -0,0253 | |||
| DLR / Digital Realty Trust, Inc. | 0,01 | 10,57 | 1,43 | 9,59 | 0,2809 | 0,0117 | |||
| GE / General Electric Company | 0,00 | 0,04 | 1,41 | 16,89 | 0,2761 | 0,0279 | |||
| PNR / Pentair plc | 0,01 | -2,06 | 1,40 | 5,66 | 0,2753 | 0,0015 | |||
| BRK.B / Berkshire Hathaway Inc. | 0,00 | 0,00 | 1,36 | 3,51 | 0,2666 | -0,0041 | |||
| SBUX / Starbucks Corporation | 0,01 | -0,93 | 1,26 | -8,51 | 0,2472 | -0,0368 | |||
| DVN / Devon Energy Corporation | 0,03 | 0,00 | 1,22 | 10,20 | 0,2399 | 0,0112 | |||
| WEC / WEC Energy Group, Inc. | 0,01 | -0,44 | 1,21 | 9,52 | 0,2373 | 0,0096 | |||
| SO / The Southern Company | 0,01 | 1,43 | 1,21 | 4,69 | 0,2370 | -0,0009 | |||
| ITW / Illinois Tool Works Inc. | 0,00 | 0,16 | 1,15 | 5,62 | 0,2255 | 0,0012 | |||
| RNR / RenaissanceRe Holdings Ltd. | 0,00 | 0,00 | 1,13 | 4,63 | 0,2218 | -0,0011 | |||
| ROST / Ross Stores, Inc. | 0,01 | -1,86 | 1,13 | 17,26 | 0,2217 | 0,0230 | |||
| VTI / Vanguard Index Funds - Vanguard Total Stock Market ETF | 0,00 | 2,67 | 1,08 | 10,84 | 0,2131 | 0,0111 | |||
| GNTX / Gentex Corporation | 0,04 | -1,51 | 1,01 | 26,66 | 0,1989 | 0,0340 | |||
| BFB / Brown-Forman Corp. - Class B | 0,04 | 12,66 | 0,97 | 13,38 | 0,1898 | 0,0139 | |||
| NFLX / Netflix, Inc. | 0,00 | -0,13 | 0,94 | -10,55 | 0,1849 | -0,0324 | |||
| TFX / Teleflex Incorporated | 0,01 | -3,76 | 0,88 | -0,45 | 0,1723 | -0,0097 | |||
| HON / Honeywell International Inc. | 0,00 | -1,34 | 0,87 | -10,78 | 0,1707 | -0,0304 | |||
| ULTA / Ulta Beauty, Inc. | 0,00 | 9,20 | 0,86 | 27,57 | 0,1683 | 0,0297 | |||
| LULU / lululemon athletica inc. | 0,00 | -7,01 | 0,85 | -30,35 | 0,1669 | -0,0849 | |||
| IBM / International Business Machines Corporation | 0,00 | -5,13 | 0,79 | -9,23 | 0,1547 | -0,0243 | |||
| FAST / Fastenal Company | 0,01 | 1,73 | 0,72 | 18,78 | 0,1416 | 0,0163 | |||
| GEV / GE Vernova Inc. | 0,00 | 0,00 | 0,72 | 16,16 | 0,1413 | 0,0135 | |||
| VUG / Vanguard Index Funds - Vanguard Growth ETF | 0,00 | 0,00 | 0,70 | 9,39 | 0,1374 | 0,0054 | |||
| VTSAX / Vanguard Index Funds - Vanguard Total Stock Market Index Fund Admiral | 0,00 | 0,05 | 0,70 | 8,06 | 0,1369 | 0,0037 | |||
| TGT / Target Corporation | 0,01 | -7,19 | 0,69 | -15,67 | 0,1365 | -0,0335 | |||
| SPY / SPDR S&P 500 ETF | 0,00 | 0,10 | 0,66 | 7,89 | 0,1289 | 0,0033 | |||
| MLI / Mueller Industries, Inc. | 0,01 | 7,73 | 0,61 | 37,19 | 0,1190 | 0,0278 | |||
| GDXD / MicroSectors Gold Miners -3X Inverse Leveraged ETNs due June 29, 2040 | 0,00 | 0,00 | 0,58 | 17,58 | 0,1145 | 0,0123 | |||
| WU / The Western Union Company | 0,07 | -10,77 | 0,57 | -15,34 | 0,1129 | -0,0272 | |||
| CHD / Church & Dwight Co., Inc. | 0,01 | 0,00 | 0,57 | -8,83 | 0,1117 | -0,0170 | |||
| D / Dominion Energy, Inc. | 0,01 | 4,86 | 0,56 | 13,36 | 0,1101 | 0,0082 | |||
| AYI / Acuity Inc. | 0,00 | 0,00 | 0,53 | 15,33 | 0,1051 | 0,0094 | |||
| GOOGL / Alphabet Inc. | 0,00 | 0,00 | 0,52 | 37,99 | 0,1029 | 0,0245 | |||
| ZTS / Zoetis Inc. | 0,00 | 4,96 | 0,51 | -1,54 | 0,1004 | -0,0067 | |||
| MAS / Masco Corporation | 0,01 | 0,10 | 0,49 | 9,42 | 0,0959 | 0,0039 | |||
| RTX / RTX Corporation | 0,00 | 36,55 | 0,47 | 56,62 | 0,0930 | 0,0305 | |||
| EG / Everest Group, Ltd. | 0,00 | 0,00 | 0,46 | 3,14 | 0,0905 | -0,0018 | |||
| HODGES SMALL CAP GROWTH RETAIL / (664925203) | 0,02 | 0,46 | 0,0000 | ||||||
| SCHWAB TARGET 2050 INDEX / (80850L783) | 0,02 | 0,45 | 0,0000 | ||||||
| TMUS / T-Mobile US, Inc. | 0,00 | 0,45 | 0,0891 | 0,0891 | |||||
| SHW / The Sherwin-Williams Company | 0,00 | 0,00 | 0,44 | 0,93 | 0,0856 | -0,0036 | |||
| SJM / The J. M. Smucker Company | 0,00 | -14,72 | 0,43 | -5,70 | 0,0846 | -0,0097 | |||
| MPC / Marathon Petroleum Corporation | 0,00 | 0,00 | 0,43 | 15,99 | 0,0841 | 0,0079 | |||
| APD / Air Products and Chemicals, Inc. | 0,00 | 0,00 | 0,42 | -3,24 | 0,0821 | -0,0071 | |||
| HRL / Hormel Foods Corporation | 0,02 | -0,41 | 0,40 | -18,53 | 0,0787 | -0,0228 | |||
| DFAT / Dimensional ETF Trust - Dimensional U.S. Targeted Value ETF | 0,01 | 0,00 | 0,39 | 7,69 | 0,0772 | 0,0020 | |||
| CMG / Chipotle Mexican Grill, Inc. | 0,01 | 8,08 | 0,39 | -24,62 | 0,0771 | -0,0303 | |||
| EOG / EOG Resources, Inc. | 0,00 | 198,71 | 0,39 | 180,58 | 0,0766 | 0,0479 | |||
| T / AT&T Inc. | 0,01 | 0,00 | 0,39 | -2,51 | 0,0764 | -0,0059 | |||
| ED / Consolidated Edison, Inc. | 0,00 | -30,38 | 0,38 | -30,22 | 0,0749 | -0,0379 | |||
| IEFA / iShares Trust - iShares Core MSCI EAFE ETF | 0,00 | 0,00 | 0,38 | 4,68 | 0,0747 | -0,0003 | |||
| CMPO / CompoSecure, Inc. | 0,02 | 0,00 | 0,38 | 48,22 | 0,0737 | 0,0213 | |||
| FICO / Fair Isaac Corporation | 0,00 | 0,00 | 0,37 | -17,98 | 0,0735 | -0,0208 | |||
| FSPSX / Fidelity Concord Street Trust - Fidelity International Index Fund | 0,01 | 0,00 | 0,37 | 4,83 | 0,0725 | -0,0003 | |||
| MKC / McCormick & Company, Incorporated | 0,01 | -3,91 | 0,37 | -15,21 | 0,0723 | -0,0173 | |||
| USMV / iShares Trust - iShares MSCI USA Min Vol Factor ETF | 0,00 | 0,00 | 0,35 | 1,47 | 0,0679 | -0,0025 | |||
| CF / CF Industries Holdings, Inc. | 0,00 | 15,19 | 0,34 | 12,46 | 0,0675 | 0,0043 | |||
| VTV / Vanguard Index Funds - Vanguard Value ETF | 0,00 | 0,00 | 0,34 | 5,57 | 0,0671 | 0,0003 | |||
| WTRG / Essential Utilities, Inc. | 0,01 | -38,72 | 0,33 | -34,26 | 0,0654 | -0,0390 | |||
| IEMG / iShares, Inc. - iShares Core MSCI Emerging Markets ETF | 0,00 | 0,00 | 0,31 | 9,71 | 0,0601 | 0,0026 | |||
| NUE / Nucor Corporation | 0,00 | 0,00 | 0,30 | 4,84 | 0,0595 | -0,0003 | |||
| CL / Colgate-Palmolive Company | 0,00 | 0,00 | 0,28 | -12,07 | 0,0559 | -0,0109 | |||
| FFIV / F5, Inc. | 0,00 | -1,12 | 0,28 | 8,81 | 0,0559 | 0,0018 | |||
| ABT / Abbott Laboratories | 0,00 | 0,00 | 0,28 | -1,39 | 0,0557 | -0,0037 | |||
| PEP / PepsiCo, Inc. | 0,00 | 0,00 | 0,28 | 6,02 | 0,0556 | 0,0007 | |||
| MET.PRA / MetLife, Inc. - Preferred Stock | 0,01 | 0,00 | 0,26 | 3,60 | 0,0510 | -0,0007 | |||
| AVGO / Broadcom Inc. | 0,00 | 14,60 | 0,26 | 37,23 | 0,0509 | 0,0119 | |||
| SWPPX / Schwab Capital Trust - Schwab S&P 500 Index Fund | 0,01 | 496,51 | 0,25 | 7,36 | 0,0488 | 0,0011 | |||
| DFUV / Dimensional ETF Trust - Dimensional US Marketwide Value ETF | 0,01 | 0,00 | 0,25 | 5,56 | 0,0486 | 0,0003 | |||
| DFUS / Dimensional ETF Trust - Dimensional U.S. Equity Market ETF | 0,00 | 0,00 | 0,24 | 8,44 | 0,0479 | 0,0013 | |||
| TSLA / Tesla, Inc. | 0,00 | 0,00 | 0,24 | 40,35 | 0,0472 | 0,0118 | |||
| GLW / Corning Incorporated | 0,00 | -31,25 | 0,23 | 7,34 | 0,0461 | 0,0009 | |||
| V / Visa Inc. | 0,00 | 0,00 | 0,23 | -3,83 | 0,0446 | -0,0041 | |||
| MPLX / MPLX LP - Limited Partnership | 0,00 | 84,63 | 0,22 | 79,20 | 0,0441 | 0,0182 | |||
| BNL / Broadstone Net Lease, Inc. | 0,01 | 0,00 | 0,21 | 10,99 | 0,0418 | 0,0024 | |||
| CAT / Caterpillar Inc. | 0,00 | 0,00 | 0,21 | 22,75 | 0,0404 | 0,0059 | |||
| CSCO / Cisco Systems, Inc. | 0,00 | -4,00 | 0,21 | -5,09 | 0,0403 | -0,0044 | |||
| NSC / Norfolk Southern Corporation | 0,00 | 0,00 | 0,20 | 17,34 | 0,0399 | 0,0042 | |||
| AMD / Advanced Micro Devices, Inc. | 0,00 | 0,20 | 0,0391 | 0,0391 | |||||
| MO / Altria Group, Inc. | 0,00 | 0,00 | 0,19 | 12,87 | 0,0380 | 0,0026 | |||
| RPM / RPM International Inc. | 0,00 | 0,43 | 0,19 | 7,82 | 0,0380 | 0,0010 | |||
| FDS / FactSet Research Systems Inc. | 0,00 | 0,00 | 0,19 | -36,12 | 0,0377 | -0,0241 | |||
| LMT / Lockheed Martin Corporation | 0,00 | 0,00 | 0,19 | 7,95 | 0,0375 | 0,0009 | |||
| BK / The Bank of New York Mellon Corporation | 0,00 | 0,00 | 0,18 | 19,74 | 0,0359 | 0,0044 | |||
| CBSH / Commerce Bancshares, Inc. | 0,00 | 0,00 | 0,18 | -3,74 | 0,0355 | -0,0033 | |||
| VEA / Vanguard Tax-Managed Funds - Vanguard FTSE Developed Markets ETF | 0,00 | 0,00 | 0,18 | 4,68 | 0,0353 | 0,0000 | |||
| QQQ / Invesco QQQ Trust, Series 1 | 0,00 | 3,60 | 0,17 | 12,42 | 0,0340 | 0,0023 | |||
| IONQ / IonQ, Inc. | 0,00 | 0,23 | 0,16 | 44,25 | 0,0321 | 0,0086 | |||
| BIO / Bio-Rad Laboratories, Inc. | 0,00 | -14,39 | 0,16 | -0,63 | 0,0311 | -0,0018 | |||
| MFC / Manulife Financial Corporation | 0,01 | 0,00 | 0,16 | -2,48 | 0,0310 | -0,0024 | |||
| WHR / Whirlpool Corporation | 0,00 | -9,07 | 0,16 | -29,60 | 0,0310 | -0,0152 | |||
| MA / Mastercard Incorporated | 0,00 | 0,00 | 0,15 | 1,32 | 0,0302 | -0,0011 | |||
| JBL / Jabil Inc. | 0,00 | 0,00 | 0,15 | 0,00 | 0,0299 | -0,0017 | |||
| MU / Micron Technology, Inc. | 0,00 | 3,43 | 0,15 | 41,12 | 0,0297 | 0,0075 | |||
| US9229087104 / VANGUARD 500 INDEX FUND VANGUARD 500 INDEX ADM | 0,00 | 0,41 | 0,15 | 7,91 | 0,0296 | 0,0008 | |||
| DGRO / iShares Trust - iShares Core Dividend Growth ETF | 0,00 | 0,00 | 0,15 | 6,38 | 0,0296 | 0,0004 | |||
| DFAC / Dimensional ETF Trust - Dimensional U.S. Core Equity 2 ETF | 0,00 | 0,00 | 0,15 | 7,19 | 0,0294 | 0,0007 | |||
| VOO / Vanguard Index Funds - Vanguard S&P 500 ETF | 0,00 | 0,00 | 0,15 | 8,15 | 0,0287 | 0,0007 | |||
| AMCR / Amcor plc | 0,02 | 0,00 | 0,14 | -10,76 | 0,0278 | -0,0050 | |||
| TTNDY / Techtronic Industries Company Limited - Depositary Receipt (Common Stock) | 0,00 | 0,14 | 0,0276 | 0,0276 | |||||
| SCHW / The Charles Schwab Corporation | 0,00 | 0,00 | 0,14 | 4,62 | 0,0269 | -0,0001 | |||
| AEP / American Electric Power Company, Inc. | 0,00 | -2,82 | 0,14 | 5,47 | 0,0267 | 0,0001 | |||
| NOBL / ProShares Trust - ProShares S&P 500 Dividend Aristocrats ETF | 0,00 | 3,77 | 0,13 | 6,56 | 0,0256 | 0,0003 | |||
| ROP / Roper Technologies, Inc. | 0,00 | 0,00 | 0,13 | -12,24 | 0,0255 | -0,0049 | |||
| ENFFF / Enbridge Inc. - Preferred Security | 0,00 | 0,00 | 0,13 | 11,30 | 0,0253 | 0,0014 | |||
| TMO / Thermo Fisher Scientific Inc. | 0,00 | 0,00 | 0,13 | 19,63 | 0,0252 | 0,0031 | |||
| NOC / Northrop Grumman Corporation | 0,00 | 0,00 | 0,13 | 22,12 | 0,0251 | 0,0035 | |||
| DTE / DTE Energy Company | 0,00 | 0,00 | 0,13 | 6,78 | 0,0249 | 0,0004 | |||
| MLM / Martin Marietta Materials, Inc. | 0,00 | 0,00 | 0,13 | 15,60 | 0,0248 | 0,0021 | |||
| PH / Parker-Hannifin Corporation | 0,00 | 0,00 | 0,13 | 8,70 | 0,0246 | 0,0008 | |||
| BWXT / BWX Technologies, Inc. | 0,00 | 0,12 | 0,0243 | 0,0243 | |||||
| RY / Royal Bank of Canada | 0,00 | -22,55 | 0,12 | -13,87 | 0,0234 | -0,0049 | |||
| CLS / Celestica Inc. | 0,00 | 0,11 | 0,0218 | 0,0218 | |||||
| SPYG / SPDR Series Trust - State Street SPDR Portfolio S&P 500 Growth ETF | 0,00 | 0,11 | 0,0214 | 0,0214 | |||||
| IWV / iShares Trust - iShares Russell 3000 ETF | 0,00 | 0,00 | 0,11 | 7,00 | 0,0212 | 0,0006 | |||
| RHLD.V / Resolute Holdings Management, Inc. | 0,00 | 0,10 | 0,0201 | 0,0201 | |||||
| DE / Deere & Company | 0,00 | 0,00 | 0,10 | -9,91 | 0,0198 | -0,0033 | |||
| FI / Fiserv, Inc. | 0,00 | -100,00 | 0,00 | 0,0000 | |||||
| RF / Regions Financial Corporation | 0,00 | -100,00 | 0,00 | 0,0000 | |||||
| BAX / Baxter International Inc. | 0,00 | -100,00 | 0,00 | 0,0000 | |||||
| WBA / Walgreens Boots Alliance, Inc. | 0,00 | -100,00 | 0,00 | 0,0000 | |||||
| HUMA / Humacyte, Inc. | 0,00 | -100,00 | 0,00 | 0,0000 | |||||
| TSCO / Tractor Supply Company | 0,00 | -100,00 | 0,00 | -100,00 | -0,0221 | ||||
| PDCO / Patterson Companies, Inc. | 0,00 | -100,00 | 0,00 | 0,0000 |