Basisstatistiken
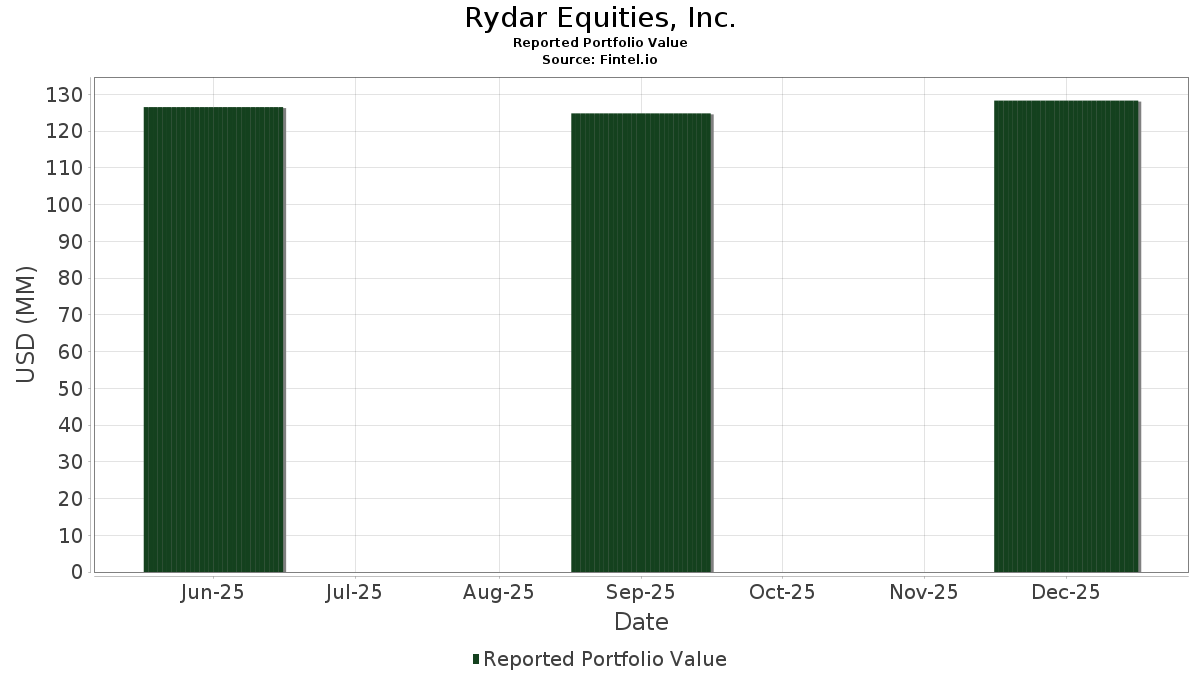
| Portfolio-Wert | $ 124.821.127 |
| Aktuelle Positionen | 93 |
Neueste Bestände, Performance, AUM (aus 13F, 13D)
Rydar Equities, Inc. hat 93 Gesamtbeteiligungen in seinen letzten SEC-Einreichungen offengelegt. Der jüngste Portfoliowert wird auf $ 124.821.127 USD berechnet. Das tatsächliche verwaltete Vermögen (AUM) ist dieser Wert plus Barmittel (die nicht offengelegt werden). Rydar Equities, Inc.s Top-Bestände sind Apple Inc. (US:AAPL) , Amazon.com, Inc. (US:AMZN) , Microsoft Corporation (US:MSFT) , Alphabet Inc. (US:GOOGL) , and NVIDIA Corporation (US:NVDA) . Rydar Equities, Inc.s neue Positionen sind Diamondback Energy, Inc. (US:FANG) , SoFi Technologies, Inc. (US:SOFI) , Oracle Corporation (US:ORCL) , GE Vernova Inc. (US:GEV) , and Broadcom Inc. (US:AVGO) .
Top-Zuwächse in diesem Quartal
Wir verwenden die Veränderung der Portfolioallokation, weil dies die aussagekräftigste Kennzahl ist. Die Änderungen können auf Trades oder Änderungen der Aktienkurse zurückzuführen sein.
| Wertpapier | Aktien (MM) |
Wert (MM$) |
Portfolio % | ΔPortfolio % |
|---|---|---|---|---|
| AAPL / Apple Inc. | 0,04 | 9,88 | 7,9183 | 0,9635 |
| GOOGL / Alphabet Inc. | 0,02 | 5,00 | 4,0034 | 0,7618 |
| UNH / UnitedHealth Group Incorporated | 0,00 | 1,33 | 1,0656 | 0,4893 |
| NVDA / NVIDIA Corporation | 0,03 | 4,89 | 3,9207 | 0,4069 |
| TSLA / Tesla, Inc. | 0,00 | 1,47 | 1,1753 | 0,3744 |
| PLTR / Palantir Technologies Inc. | 0,02 | 2,82 | 2,2561 | 0,3485 |
| FANG / Diamondback Energy, Inc. | 0,00 | 0,39 | 0,3126 | 0,3126 |
| COF / Capital One Financial Corporation | 0,01 | 1,17 | 0,9376 | 0,2622 |
| SOFI / SoFi Technologies, Inc. | 0,01 | 0,30 | 0,2385 | 0,2385 |
| JPM / JPMorgan Chase & Co. | 0,02 | 4,87 | 3,9033 | 0,2181 |
Top-Rückgänge in diesem Quartal
Wir verwenden die Veränderung der Portfolioallokation, weil dies die aussagekräftigste Kennzahl ist. Änderungen können auf Handelsgeschäfte oder Änderungen der Aktienkurse zurückzuführen sein.
| Wertpapier | Aktien (MM) |
Wert (MM$) |
Portfolio % | ΔPortfolio % |
|---|---|---|---|---|
| PAA / Plains All American Pipeline, L.P. - Limited Partnership | 0,11 | 1,86 | 1,4931 | -0,5700 |
| AMZN / Amazon.com, Inc. | 0,03 | 7,37 | 5,9074 | -0,5492 |
| MELI / MercadoLibre, Inc. | 0,00 | 3,62 | 2,8968 | -0,5405 |
| CARR / Carrier Global Corporation | 0,02 | 1,16 | 0,9269 | -0,3454 |
| JNJ / Johnson & Johnson | 0,00 | 0,47 | 0,3749 | -0,3124 |
| SBUX / Starbucks Corporation | 0,01 | 0,95 | 0,7612 | -0,2492 |
| XOM / Exxon Mobil Corporation | 0,01 | 1,24 | 0,9956 | -0,2347 |
| HD / The Home Depot, Inc. | 0,00 | 1,84 | 1,4771 | -0,1952 |
| TPL / Texas Pacific Land Corporation | 0,00 | 0,00 | -0,1596 | |
| WM / Waste Management, Inc. | 0,01 | 2,30 | 1,8415 | -0,1473 |
13F und Fondseinreichungen
Dieses Formular wurde am 2025-10-10 für den Berichtszeitraum eingereicht 2025-09-30. Klicken Sie auf das Link-Symbol , um den gesamten Transaktionsverlauf zu sehen.
Upgrade um die Prämiendaten zu entsperren und nach Excel zu exportieren ![]() .
.
| Wertpapier | Typ | Durchschnittlicher Aktienkurs | Aktien (MM) |
ΔAktien (%) |
Wert ($MM) |
ΔAktien (%) |
Portfolio (%) |
ΔPortfolio (%) |
|
|---|---|---|---|---|---|---|---|---|---|
| AAPL / Apple Inc. | 0,04 | -9,79 | 9,88 | 12,32 | 7,9183 | 0,9635 | |||
| AMZN / Amazon.com, Inc. | 0,03 | -10,25 | 7,37 | -9,74 | 5,9074 | -0,5492 | |||
| MSFT / Microsoft Corporation | 0,01 | -4,67 | 5,58 | -0,39 | 4,4669 | 0,0430 | |||
| GOOGL / Alphabet Inc. | 0,02 | -12,33 | 5,00 | 21,85 | 4,0034 | 0,7618 | |||
| NVDA / NVIDIA Corporation | 0,03 | -7,12 | 4,89 | 10,08 | 3,9207 | 0,4069 | |||
| JPM / JPMorgan Chase & Co. | 0,02 | -2,50 | 4,87 | 4,50 | 3,9033 | 0,2181 | |||
| GS / The Goldman Sachs Group, Inc. | 0,00 | -11,51 | 3,66 | -1,80 | 2,9311 | -0,0134 | |||
| MELI / MercadoLibre, Inc. | 0,00 | -0,24 | 3,62 | -16,88 | 2,8968 | -0,5405 | |||
| T / AT&T Inc. | 0,11 | 2,63 | 2,92 | -2,31 | 2,3376 | -0,0228 | |||
| PLTR / Palantir Technologies Inc. | 0,02 | -14,00 | 2,82 | 16,70 | 2,2561 | 0,3485 | |||
| MS / Morgan Stanley | 0,02 | -7,42 | 2,81 | 3,12 | 2,2524 | 0,0974 | |||
| SPY / SPDR S&P 500 ETF | 0,00 | -13,88 | 2,72 | -6,83 | 2,1762 | -0,1283 | |||
| WM / Waste Management, Inc. | 0,01 | -4,94 | 2,30 | -8,66 | 1,8415 | -0,1473 | |||
| COST / Costco Wholesale Corporation | 0,00 | 1,67 | 2,29 | -5,77 | 1,8317 | -0,0860 | |||
| RTX / RTX Corporation | 0,01 | -4,24 | 2,25 | 9,64 | 1,8046 | 0,1809 | |||
| QQQ / Invesco QQQ Trust, Series 1 | 0,00 | -8,99 | 2,21 | -0,45 | 1,7714 | 0,0159 | |||
| LMT / Lockheed Martin Corporation | 0,00 | -4,50 | 2,10 | 2,90 | 1,6795 | 0,0692 | |||
| PG / The Procter & Gamble Company | 0,01 | -2,20 | 2,09 | -5,99 | 1,6727 | -0,0821 | |||
| AZO / AutoZone, Inc. | 0,00 | -10,48 | 2,00 | 2,46 | 1,5995 | 0,0592 | |||
| MCD / McDonald's Corporation | 0,01 | -8,16 | 1,91 | -4,84 | 1,5292 | -0,0559 | |||
| PAA / Plains All American Pipeline, L.P. - Limited Partnership | 0,11 | -23,24 | 1,86 | -28,62 | 1,4931 | -0,5700 | |||
| HD / The Home Depot, Inc. | 0,00 | -19,53 | 1,84 | -12,86 | 1,4771 | -0,1952 | |||
| KO / The Coca-Cola Company | 0,03 | -1,49 | 1,82 | -7,00 | 1,4590 | -0,0890 | |||
| WMT / Walmart Inc. | 0,02 | -2,28 | 1,82 | 1,91 | 1,4546 | 0,0463 | |||
| AXP / American Express Company | 0,01 | -2,72 | 1,73 | 0,23 | 1,3854 | 0,0215 | |||
| DIA / SPDR Dow Jones Industrial Average ETF Trust | 0,00 | -5,49 | 1,62 | -0,43 | 1,3000 | 0,0120 | |||
| TSLA / Tesla, Inc. | 0,00 | 0,09 | 1,47 | 44,82 | 1,1753 | 0,3744 | |||
| UNP / Union Pacific Corporation | 0,01 | -14,14 | 1,38 | -12,42 | 1,1076 | -0,1399 | |||
| TRV / The Travelers Companies, Inc. | 0,00 | -0,66 | 1,33 | 2,94 | 1,0668 | 0,0444 | |||
| UNH / UnitedHealth Group Incorporated | 0,00 | 63,41 | 1,33 | 82,44 | 1,0656 | 0,4893 | |||
| LLY / Eli Lilly and Company | 0,00 | -2,81 | 1,31 | 4,56 | 1,0467 | 0,0591 | |||
| XOM / Exxon Mobil Corporation | 0,01 | -23,16 | 1,24 | -20,18 | 0,9956 | -0,2347 | |||
| MA / Mastercard Incorporated | 0,00 | 4,40 | 1,20 | 6,59 | 0,9595 | 0,0718 | |||
| CRWD / CrowdStrike Holdings, Inc. | 0,00 | 15,77 | 1,20 | 13,69 | 0,9585 | 0,1265 | |||
| UBER / Uber Technologies, Inc. | 0,01 | -2,35 | 1,17 | 1,12 | 0,9401 | 0,0229 | |||
| COF / Capital One Financial Corporation | 0,01 | 36,50 | 1,17 | 37,00 | 0,9376 | 0,2622 | |||
| VEA / Vanguard Tax-Managed Funds - Vanguard FTSE Developed Markets ETF | 0,02 | -5,49 | 1,16 | 0,61 | 0,9316 | 0,0180 | |||
| CARR / Carrier Global Corporation | 0,02 | -11,53 | 1,16 | -28,15 | 0,9269 | -0,3454 | |||
| PANW / Palo Alto Networks, Inc. | 0,01 | 23,91 | 1,10 | 25,23 | 0,8791 | 0,1865 | |||
| BRK.B / Berkshire Hathaway Inc. | 0,00 | 8,43 | 1,02 | 10,75 | 0,8174 | 0,0887 | |||
| VWO / Vanguard International Equity Index Funds - Vanguard FTSE Emerging Markets ETF | 0,02 | -9,22 | 0,98 | 0,62 | 0,7851 | 0,0152 | |||
| META / Meta Platforms, Inc. | 0,00 | -4,24 | 0,97 | -7,00 | 0,7779 | -0,0470 | |||
| SBUX / Starbucks Corporation | 0,01 | -19,31 | 0,95 | -25,67 | 0,7612 | -0,2492 | |||
| CMI / Cummins Inc. | 0,00 | -3,20 | 0,80 | 25,55 | 0,6380 | 0,1367 | |||
| NFLX / Netflix, Inc. | 0,00 | 2,69 | 0,76 | -10,15 | 0,6097 | -0,0602 | |||
| RSG / Republic Services, Inc. | 0,00 | 26,45 | 0,73 | 16,61 | 0,5851 | 0,0897 | |||
| NOC / Northrop Grumman Corporation | 0,00 | -3,92 | 0,71 | 16,34 | 0,5705 | 0,0867 | |||
| CVX / Chevron Corporation | 0,00 | -4,99 | 0,70 | 2,50 | 0,5591 | 0,0214 | |||
| BLK / BlackRock, Inc. | 0,00 | -13,12 | 0,69 | -5,58 | 0,5567 | -0,0245 | |||
| WRB / W. R. Berkley Corporation | 0,01 | 17,90 | 0,69 | 21,15 | 0,5552 | 0,1026 | |||
| TSCO / Tractor Supply Company | 0,01 | -1,80 | 0,66 | 4,10 | 0,5291 | 0,0275 | |||
| HOOD / Robinhood Markets, Inc. | 0,00 | 0,11 | 0,65 | 48,74 | 0,5189 | 0,1748 | |||
| SHOP / Shopify Inc. | 0,00 | -8,94 | 0,61 | 18,02 | 0,4883 | 0,0803 | |||
| V / Visa Inc. | 0,00 | 3,74 | 0,55 | 1,66 | 0,4408 | 0,0128 | |||
| GOOG / Alphabet Inc. | 0,00 | 0,45 | 0,55 | 39,19 | 0,4387 | 0,1275 | |||
| CTAS / Cintas Corporation | 0,00 | 13,08 | 0,54 | 3,42 | 0,4359 | 0,0198 | |||
| LRCX / Lam Research Corporation | 0,00 | -9,92 | 0,54 | 32,19 | 0,4313 | 0,1094 | |||
| VLO / Valero Energy Corporation | 0,00 | -12,34 | 0,51 | 9,40 | 0,4103 | 0,0401 | |||
| BA / The Boeing Company | 0,00 | 24,28 | 0,50 | 27,58 | 0,3971 | 0,0902 | |||
| COP / ConocoPhillips | 0,01 | 0,79 | 0,49 | 7,27 | 0,3903 | 0,0312 | |||
| VIG / Vanguard Specialized Funds - Vanguard Dividend Appreciation ETF | 0,00 | 0,82 | 0,48 | 6,94 | 0,3834 | 0,0294 | |||
| JNJ / Johnson & Johnson | 0,00 | -55,82 | 0,47 | -46,26 | 0,3749 | -0,3124 | |||
| DELL / Dell Technologies Inc. | 0,00 | -42,59 | 0,45 | -29,91 | 0,3606 | -0,1469 | |||
| BAC / Bank of America Corporation | 0,01 | -3,24 | 0,43 | 3,60 | 0,3467 | 0,0166 | |||
| APH / Amphenol Corporation | 0,00 | 57,10 | 0,43 | 93,67 | 0,3430 | 0,1676 | |||
| FANG / Diamondback Energy, Inc. | 0,00 | 0,39 | 0,3126 | 0,3126 | |||||
| ORLY / O'Reilly Automotive, Inc. | 0,00 | 41,29 | 0,38 | 65,65 | 0,3056 | 0,1236 | |||
| NOW / ServiceNow, Inc. | 0,00 | 40,14 | 0,38 | 24,17 | 0,3012 | 0,0623 | |||
| HSY / The Hershey Company | 0,00 | -25,60 | 0,37 | -15,23 | 0,2990 | -0,0494 | |||
| IJH / iShares Trust - iShares Core S&P Mid-Cap ETF | 0,01 | -11,72 | 0,37 | -6,77 | 0,2983 | -0,0174 | |||
| IDCC / InterDigital, Inc. | 0,00 | 0,00 | 0,35 | 55,56 | 0,2808 | 0,1025 | |||
| ED / Consolidated Edison, Inc. | 0,00 | -14,90 | 0,34 | -16,75 | 0,2753 | -0,0509 | |||
| OKE / ONEOK, Inc. | 0,00 | 10,28 | 0,34 | -1,45 | 0,2722 | -0,0002 | |||
| URI / United Rentals, Inc. | 0,00 | -32,85 | 0,31 | -14,21 | 0,2520 | -0,0381 | |||
| SOFI / SoFi Technologies, Inc. | 0,01 | 0,30 | 0,2385 | 0,2385 | |||||
| FSK / FS KKR Capital Corp. | 0,02 | 2,21 | 0,29 | -27,05 | 0,2360 | -0,0829 | |||
| FFIN / First Financial Bankshares, Inc. | 0,01 | -1,82 | 0,29 | -8,18 | 0,2339 | -0,0175 | |||
| OXY / Occidental Petroleum Corporation | 0,01 | -6,69 | 0,28 | 5,70 | 0,2235 | 0,0155 | |||
| ORCL / Oracle Corporation | 0,00 | 0,27 | 0,2155 | 0,2155 | |||||
| AMD / Advanced Micro Devices, Inc. | 0,00 | -23,58 | 0,27 | -11,67 | 0,2129 | -0,0249 | |||
| IWB / iShares Trust - iShares Russell 1000 ETF | 0,00 | 0,28 | 0,26 | 8,68 | 0,2108 | 0,0188 | |||
| GEV / GE Vernova Inc. | 0,00 | 0,25 | 0,2021 | 0,2021 | |||||
| RIVN / Rivian Automotive, Inc. | 0,02 | -22,47 | 0,25 | -17,38 | 0,2020 | -0,0397 | |||
| AVGO / Broadcom Inc. | 0,00 | 0,25 | 0,1980 | 0,1980 | |||||
| DD / DuPont de Nemours, Inc. | 0,00 | -23,06 | 0,24 | -12,45 | 0,1922 | -0,0239 | |||
| CAT / Caterpillar Inc. | 0,00 | 0,23 | 0,1855 | 0,1855 | |||||
| TXN / Texas Instruments Incorporated | 0,00 | 14,16 | 0,23 | -0,87 | 0,1842 | 0,0010 | |||
| HDV / iShares Trust - iShares Core High Dividend ETF | 0,00 | -0,75 | 0,23 | 4,13 | 0,1825 | 0,0095 | |||
| IWM / iShares Trust - iShares Russell 2000 ETF | 0,00 | 0,21 | 0,1677 | 0,1677 | |||||
| ET / Energy Transfer LP - Limited Partnership | 0,01 | 0,21 | 0,1659 | 0,1659 | |||||
| BX / Blackstone Inc. | 0,00 | 0,20 | 0,1629 | 0,1629 | |||||
| VFF / Village Farms International, Inc. | 0,05 | 0,00 | 0,14 | 167,92 | 0,1139 | 0,0717 | |||
| CION / CION Investment Corporation | 0,01 | 3,69 | 0,14 | 2,26 | 0,1093 | 0,0039 | |||
| WMB / The Williams Companies, Inc. | 0,00 | -100,00 | 0,00 | 0,0000 | |||||
| EPD / Enterprise Products Partners L.P. - Limited Partnership | 0,00 | -100,00 | 0,00 | 0,0000 | |||||
| DIS / The Walt Disney Company | 0,00 | -100,00 | 0,00 | 0,0000 | |||||
| CFR / Cullen/Frost Bankers, Inc. | 0,00 | -100,00 | 0,00 | 0,0000 | |||||
| LIN / Linde plc | 0,00 | -100,00 | 0,00 | 0,0000 | |||||
| TPL / Texas Pacific Land Corporation | 0,00 | -100,00 | 0,00 | -100,00 | -0,1596 | ||||
| PM / Philip Morris International Inc. | 0,00 | -100,00 | 0,00 | 0,0000 | |||||
| PRU / Prudential Financial, Inc. | 0,00 | -100,00 | 0,00 | 0,0000 | |||||
| CRM / Salesforce, Inc. | 0,00 | -100,00 | 0,00 | 0,0000 | |||||
| NVS / Novartis AG - Depositary Receipt (Common Stock) | 0,00 | -100,00 | 0,00 | 0,0000 | |||||
| UGI / UGI Corporation | 0,00 | -100,00 | 0,00 | 0,0000 |