Basisstatistiken
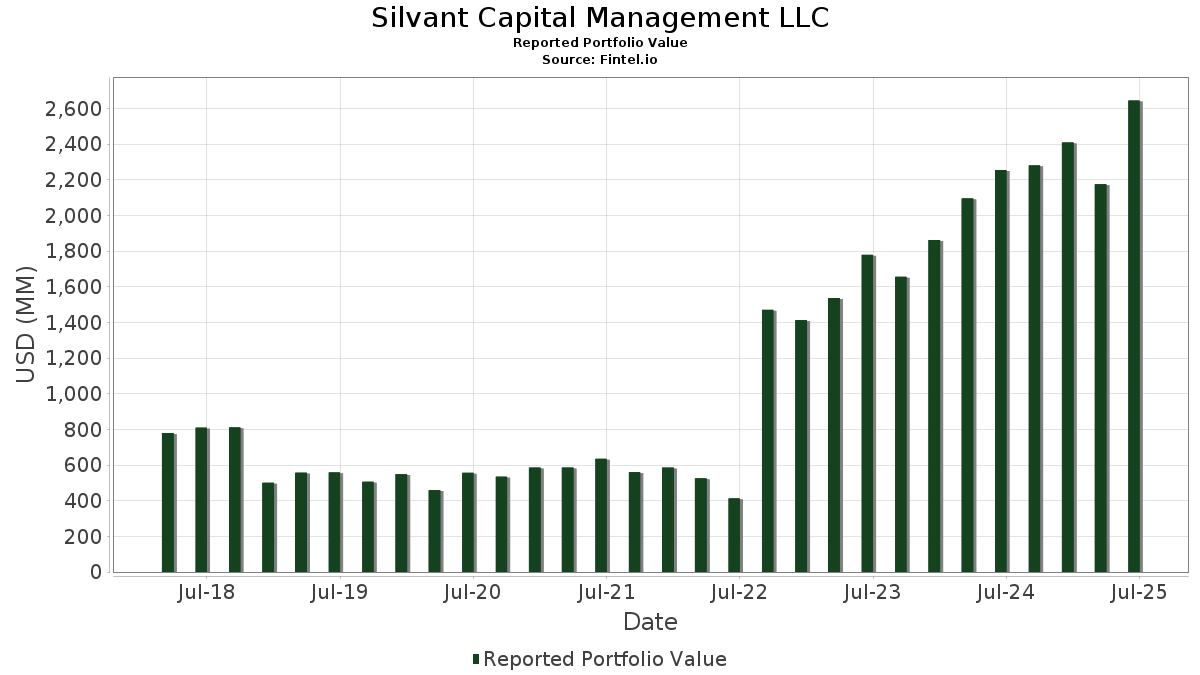
| Portfolio-Wert | $ 2.827.203.293 |
| Aktuelle Positionen | 620 |
Neueste Bestände, Performance, AUM (aus 13F, 13D)
Silvant Capital Management LLC hat 620 Gesamtbeteiligungen in seinen letzten SEC-Einreichungen offengelegt. Der jüngste Portfoliowert wird auf $ 2.827.203.293 USD berechnet. Das tatsächliche verwaltete Vermögen (AUM) ist dieser Wert plus Barmittel (die nicht offengelegt werden). Silvant Capital Management LLCs Top-Bestände sind NVIDIA Corporation (US:NVDA) , Microsoft Corporation (US:MSFT) , Apple Inc. (US:AAPL) , Alphabet Inc. (US:GOOGL) , and Amazon.com, Inc. (US:AMZN) . Silvant Capital Management LLCs neue Positionen sind NVIDIA Corporation (US:NVDA) , Microsoft Corporation (US:MSFT) , Apple Inc. (US:AAPL) , Alphabet Inc. (US:GOOGL) , and Amazon.com, Inc. (US:AMZN) .
Top-Zuwächse in diesem Quartal
Wir verwenden die Veränderung der Portfolioallokation, weil dies die aussagekräftigste Kennzahl ist. Die Änderungen können auf Trades oder Änderungen der Aktienkurse zurückzuführen sein.
| Wertpapier | Aktien (MM) |
Wert (MM$) |
Portfolio % | ΔPortfolio % |
|---|---|---|---|---|
| NVDD / Direxion Shares ETF Trust - Direxion Daily NVDA Bear 1X Shares | 2,16 | 403,82 | 14,0040 | 1,3001 |
| GOOG / Alphabet Inc. | 0,59 | 143,17 | 4,9652 | 1,1799 |
| PLTR / Palantir Technologies Inc. | 0,27 | 49,93 | 1,7314 | 1,1510 |
| AAPL / Apple Inc. | 0,85 | 217,12 | 7,5296 | 1,0667 |
| AVGO / Broadcom Inc. | 0,29 | 94,63 | 3,2815 | 0,4346 |
| PLTR / Palantir Technologies Inc. | 0,27 | 48,92 | 0,9837 | 0,4033 |
| GE / General Electric Company | 0,25 | 76,46 | 2,6516 | 0,2626 |
| APP / AppLovin Corporation | 0,02 | 10,78 | 0,3738 | 0,1878 |
| VMC / Vulcan Materials Company | 0,11 | 33,94 | 1,1768 | 0,1237 |
| GOOG / Alphabet Inc. | 0,05 | 11,19 | 0,3882 | 0,1206 |
Top-Rückgänge in diesem Quartal
Wir verwenden die Veränderung der Portfolioallokation, weil dies die aussagekräftigste Kennzahl ist. Änderungen können auf Handelsgeschäfte oder Änderungen der Aktienkurse zurückzuführen sein.
| Wertpapier | Aktien (MM) |
Wert (MM$) |
Portfolio % | ΔPortfolio % |
|---|---|---|---|---|
| MSFT / Microsoft Corporation | 0,60 | 311,90 | 6,2721 | -4,8752 |
| NVDA / NVIDIA Corporation | 2,12 | 394,64 | 7,9358 | -4,7682 |
| AMZN / Amazon.com, Inc. | 0,62 | 136,63 | 2,7475 | -2,6868 |
| META / Meta Platforms, Inc. | 0,15 | 110,18 | 2,2156 | -2,4675 |
| AAPL / Apple Inc. | 0,83 | 212,24 | 4,2680 | -2,1949 |
| NFLX / Netflix, Inc. | 0,06 | 74,74 | 1,0074 | -2,0428 |
| RCL / Royal Caribbean Cruises Ltd. | 0,28 | 90,11 | 1,2146 | -1,9825 |
| LLY / Eli Lilly and Company | 0,11 | 83,98 | 1,1320 | -1,6478 |
| FICO / Fair Isaac Corporation | 0,03 | 50,24 | 0,6771 | -1,6048 |
| NFLX / Netflix, Inc. | 0,06 | 73,58 | 1,4796 | -1,5706 |
13F und Fondseinreichungen
Dieses Formular wurde am 2025-11-13 für den Berichtszeitraum eingereicht 2025-09-30. Klicken Sie auf das Link-Symbol , um den gesamten Transaktionsverlauf zu sehen.
Upgrade um die Prämiendaten zu entsperren und nach Excel zu exportieren ![]() .
.
| Wertpapier | Typ | Durchschnittlicher Aktienkurs | Aktien (MM) |
ΔAktien (%) |
Wert ($MM) |
ΔAktien (%) |
Portfolio (%) |
ΔPortfolio (%) |
|
|---|---|---|---|---|---|---|---|---|---|
| NVDD / Direxion Shares ETF Trust - Direxion Daily NVDA Bear 1X Shares | 2,16 | 1,82 | 403,82 | 20,24 | 14,0040 | 1,3001 | |||
| NVDA / NVIDIA Corporation | 2,12 | 394,64 | 7,9358 | -4,7682 | |||||
| MSFT / Microsoft Corporation | 0,62 | 3,90 | 318,82 | 8,19 | 11,0563 | -0,0909 | |||
| MSFT / Microsoft Corporation | 0,60 | 311,90 | 6,2721 | -4,8752 | |||||
| AAPL / Apple Inc. | 0,85 | 2,40 | 217,12 | 27,08 | 7,5296 | 1,0667 | |||
| AAPL / Apple Inc. | 0,83 | 212,24 | 4,2680 | -2,1949 | |||||
| GOOG / Alphabet Inc. | 0,59 | 3,72 | 143,17 | 43,08 | 4,9652 | 1,1799 | |||
| GOOGL / Alphabet Inc. | 0,58 | 140,70 | 2,8293 | -0,9560 | |||||
| AMZN / Amazon.com, Inc. | 0,64 | -2,59 | 140,05 | -2,51 | 4,8569 | -0,5773 | |||
| AMZN / Amazon.com, Inc. | 0,62 | 136,63 | 2,7475 | -2,6868 | |||||
| META / Meta Platforms, Inc. | 0,15 | -8,35 | 112,89 | -8,81 | 3,9150 | -0,7682 | |||
| META / Meta Platforms, Inc. | 0,15 | 110,18 | 2,2156 | -2,4675 | |||||
| AVGO / Broadcom Inc. | 0,29 | 5,05 | 94,63 | 25,73 | 3,2815 | 0,4346 | |||
| AVGO / Broadcom Inc. | 0,28 | 93,15 | 1,8732 | -0,9737 | |||||
| RCL / Royal Caribbean Cruises Ltd. | 0,28 | 3,17 | 90,11 | 6,62 | 1,2146 | -1,9825 | |||
| RCL / Royal Caribbean Cruises Ltd. | 0,28 | 89,10 | 1,7916 | -1,4054 | |||||
| V / Visa Inc. | 0,25 | 3,93 | 86,47 | -0,07 | 2,9987 | -0,2744 | |||
| V / Visa Inc. | 0,25 | 85,17 | 1,7127 | -1,5603 | |||||
| LLY / Eli Lilly and Company | 0,11 | 16,76 | 83,98 | 14,28 | 1,1320 | -1,6478 | |||
| LLY / Eli Lilly and Company | 0,11 | 82,14 | 1,6519 | -1,1279 | |||||
| GE / General Electric Company | 0,25 | 3,59 | 76,46 | 21,07 | 2,6516 | 0,2626 | |||
| GE / General Electric Company | 0,25 | 75,60 | 1,5203 | -0,8686 | |||||
| NFLX / Netflix, Inc. | 0,06 | 3,53 | 74,74 | -7,31 | 1,0074 | -2,0428 | |||
| NFLX / Netflix, Inc. | 0,06 | 73,58 | 1,4796 | -1,5706 | |||||
| GEV / GE Vernova Inc. | 0,08 | 3,54 | 50,99 | 20,32 | 0,6874 | -0,9159 | |||
| GEV / GE Vernova Inc. | 0,08 | 50,46 | 1,0147 | -0,5885 | |||||
| FICO / Fair Isaac Corporation | 0,03 | 1,72 | 50,24 | -16,73 | 0,6771 | -1,6048 | |||
| PLTR / Palantir Technologies Inc. | 0,27 | 143,14 | 49,93 | 225,38 | 1,7314 | 1,1510 | |||
| FICO / Fair Isaac Corporation | 0,03 | 49,76 | 1,0006 | -1,2814 | |||||
| PLTR / Palantir Technologies Inc. | 0,27 | 48,92 | 0,9837 | 0,4033 | |||||
| ISRG / Intuitive Surgical, Inc. | 0,09 | 4,08 | 40,42 | -14,34 | 1,4016 | -0,3833 | |||
| ISRG / Intuitive Surgical, Inc. | 0,09 | 39,75 | 0,7993 | -0,9856 | |||||
| ADSK / Autodesk, Inc. | 0,11 | 3,92 | 35,45 | 6,64 | 1,2294 | -0,0281 | |||
| ADSK / Autodesk, Inc. | 0,11 | 34,93 | 0,7024 | -0,5551 | |||||
| VMC / Vulcan Materials Company | 0,11 | 3,34 | 33,94 | 21,89 | 1,1768 | 0,1237 | |||
| VMC / Vulcan Materials Company | 0,11 | 33,66 | 0,6769 | -0,3763 | |||||
| MELI / MercadoLibre, Inc. | 0,01 | 3,98 | 25,61 | -7,03 | 0,3452 | -0,6968 | |||
| MELI / MercadoLibre, Inc. | 0,01 | 25,24 | 0,5075 | -0,5346 | |||||
| HON / Honeywell International Inc. | 0,11 | 2,59 | 23,86 | -7,26 | 0,3216 | -0,6517 | |||
| HON / Honeywell International Inc. | 0,11 | 23,75 | 0,4776 | -0,4957 | |||||
| CRM / Salesforce, Inc. | 0,10 | 3,29 | 22,84 | -10,22 | 0,3079 | -0,6546 | |||
| CRM / Salesforce, Inc. | 0,10 | 22,66 | 0,4557 | -0,5068 | |||||
| LVS / Las Vegas Sands Corp. | 0,39 | 3,47 | 20,87 | 27,91 | 0,7237 | 0,1066 | |||
| LVS / Las Vegas Sands Corp. | 0,38 | 20,67 | 0,4157 | -0,2015 | |||||
| WDAY / Workday, Inc. | 0,08 | 4,39 | 18,71 | 4,71 | 0,2522 | -0,4238 | |||
| WDAY / Workday, Inc. | 0,08 | 18,34 | 0,3688 | -0,3072 | |||||
| ASML / ASML Holding N.V. - Depositary Receipt (Common Stock) | 0,02 | 3,58 | 17,50 | 25,12 | 0,2359 | -0,2931 | |||
| ASML / ASML Holding N.V. - Depositary Receipt (Common Stock) | 0,02 | 17,31 | 0,3481 | -0,1809 | |||||
| COST / Costco Wholesale Corporation | 0,02 | 6,64 | 14,54 | -0,29 | 0,1960 | -0,3556 | |||
| ARM / Arm Holdings plc - Depositary Receipt (Common Stock) | 0,10 | 3,88 | 14,01 | -9,13 | 0,1888 | -0,3942 | |||
| NET / Cloudflare, Inc. | 0,06 | -2,53 | 13,94 | 6,80 | 0,4835 | -0,0103 | |||
| MA / Mastercard Incorporated | 0,02 | 6,66 | 13,81 | 7,97 | 0,4790 | -0,0049 | |||
| ARM / Arm Holdings plc - Depositary Receipt (Common Stock) | 0,10 | 13,81 | 0,2777 | -0,3053 | |||||
| NET / Cloudflare, Inc. | 0,06 | 13,42 | 0,2699 | -0,2240 | |||||
| COST / Costco Wholesale Corporation | 0,01 | 13,39 | 0,2692 | -0,2824 | |||||
| HWM / Howmet Aerospace Inc. | 0,07 | 7,06 | 13,25 | 12,88 | 0,1785 | -0,2654 | |||
| HWM / Howmet Aerospace Inc. | 0,07 | 13,25 | 0,2664 | -0,1776 | |||||
| VST / Vistra Corp. | 0,07 | -3,70 | 13,04 | -2,66 | 0,4522 | -0,0545 | |||
| MA / Mastercard Incorporated | 0,02 | 12,74 | 0,2562 | -0,2277 | |||||
| PWR / Quanta Services, Inc. | 0,03 | -8,64 | 12,68 | 0,13 | 0,4396 | -0,0392 | |||
| PWR / Quanta Services, Inc. | 0,03 | 12,68 | 0,2549 | -0,2239 | |||||
| VST / Vistra Corp. | 0,06 | 12,64 | 0,2542 | -0,2526 | |||||
| VRT / Vertiv Holdings Co | 0,08 | -8,64 | 12,46 | 7,33 | 0,4321 | -0,0070 | |||
| VRT / Vertiv Holdings Co | 0,08 | 12,46 | 0,2505 | -0,1886 | |||||
| GOOG / Alphabet Inc. | 0,05 | 15,24 | 11,19 | 58,24 | 0,3882 | 0,1206 | |||
| MPWR / Monolithic Power Systems, Inc. | 0,01 | 10,95 | 0,2202 | -0,1399 | |||||
| MPWR / Monolithic Power Systems, Inc. | 0,01 | -8,64 | 10,95 | 15,01 | 0,3797 | 0,0196 | |||
| APP / AppLovin Corporation | 0,02 | 6,83 | 10,78 | 119,29 | 0,3738 | 0,1878 | |||
| RBLX / Roblox Corporation | 0,07 | 3,25 | 10,36 | 35,95 | 0,3593 | 0,0710 | |||
| RBLX / Roblox Corporation | 0,07 | 10,36 | 0,2084 | -0,0799 | |||||
| COR / Cencora, Inc. | 0,03 | 10,28 | 0,2068 | -0,2017 | |||||
| COR / Cencora, Inc. | 0,03 | -8,64 | 10,28 | -4,78 | 0,3566 | -0,0519 | |||
| CRWD / CrowdStrike Holdings, Inc. | 0,02 | -2,39 | 10,19 | -6,02 | 0,3534 | -0,0568 | |||
| GOOG / Alphabet Inc. | 0,04 | 9,99 | 0,2009 | -0,0667 | |||||
| APP / AppLovin Corporation | 0,01 | 9,85 | 0,1982 | 0,0122 | |||||
| CRWD / CrowdStrike Holdings, Inc. | 0,02 | 9,80 | 0,1970 | -0,2132 | |||||
| HLT / Hilton Worldwide Holdings Inc. | 0,04 | 11,57 | 9,70 | 8,69 | 0,1307 | -0,2068 | |||
| HLT / Hilton Worldwide Holdings Inc. | 0,04 | 9,70 | 0,1950 | -0,1425 | |||||
| TJX / The TJX Companies, Inc. | 0,07 | 6,70 | 9,68 | 24,89 | 0,3357 | 0,0425 | |||
| TJX / The TJX Companies, Inc. | 0,06 | 8,92 | 0,1793 | -0,1139 | |||||
| SPGI / S&P Global Inc. | 0,02 | 4,01 | 8,83 | -4,00 | 0,1190 | -0,2289 | |||
| AXON / Axon Enterprise, Inc. | 0,01 | 8,66 | 0,1742 | -0,2397 | |||||
| AXON / Axon Enterprise, Inc. | 0,01 | -8,64 | 8,66 | -20,82 | 0,3005 | -0,1134 | |||
| SPGI / S&P Global Inc. | 0,02 | 8,27 | 0,1664 | -0,1815 | |||||
| RDDT / Reddit, Inc. | 0,04 | 1,31 | 8,27 | 54,75 | 0,1115 | -0,0907 | |||
| AXP / American Express Company | 0,02 | 6,49 | 8,24 | 10,88 | 0,2859 | 0,0047 | |||
| ALNY / Alnylam Pharmaceuticals, Inc. | 0,02 | -8,64 | 8,06 | 27,77 | 0,2795 | 0,0409 | |||
| ALNY / Alnylam Pharmaceuticals, Inc. | 0,02 | 8,06 | 0,1621 | -0,0766 | |||||
| RDDT / Reddit, Inc. | 0,03 | 7,79 | 0,1566 | -0,0457 | |||||
| AXP / American Express Company | 0,02 | 7,61 | 0,1530 | -0,1282 | |||||
| LRCX / Lam Research Corporation | 0,06 | -8,64 | 7,60 | 25,68 | 0,2636 | 0,0348 | |||
| LRCX / Lam Research Corporation | 0,06 | 7,60 | 0,1529 | -0,0759 | |||||
| TT / Trane Technologies plc | 0,02 | -6,82 | 7,34 | -10,11 | 0,2547 | -0,0544 | |||
| TT / Trane Technologies plc | 0,02 | 7,34 | 0,1477 | -0,1614 | |||||
| JPM / JPMorgan Chase & Co. | 0,02 | 7,21 | 0,1450 | -0,1398 | |||||
| JPM / JPMorgan Chase & Co. | 0,02 | -11,96 | 7,21 | -4,21 | 0,2501 | -0,0347 | |||
| IDXX / IDEXX Laboratories, Inc. | 0,01 | 7,10 | 0,1428 | -0,1040 | |||||
| IDXX / IDEXX Laboratories, Inc. | 0,01 | -8,64 | 7,10 | 8,83 | 0,0957 | -0,1511 | |||
| MSCI / MSCI Inc. | 0,01 | 7,05 | 0,1418 | -0,1550 | |||||
| MSCI / MSCI Inc. | 0,01 | -8,64 | 7,05 | -10,12 | 0,2446 | -0,0522 | |||
| CVNA / Carvana Co. | 0,02 | 7,01 | 0,1410 | -0,0155 | |||||
| CVNA / Carvana Co. | 0,02 | 51,41 | 7,01 | 69,54 | 0,2432 | 0,0867 | |||
| WMT / Walmart Inc. | 0,07 | 6,98 | 0,1405 | -0,1231 | |||||
| WMT / Walmart Inc. | 0,07 | -4,89 | 6,98 | 0,24 | 0,2422 | -0,0213 | |||
| VRSK / Verisk Analytics, Inc. | 0,03 | -8,11 | 6,91 | -25,82 | 0,2398 | -0,1128 | |||
| VRSK / Verisk Analytics, Inc. | 0,03 | 6,91 | 0,1390 | -0,2135 | |||||
| WAB / Westinghouse Air Brake Technologies Corporation | 0,03 | -8,64 | 6,75 | -12,52 | 0,0910 | -0,2010 | |||
| WAB / Westinghouse Air Brake Technologies Corporation | 0,03 | 6,75 | 0,1358 | -0,1562 | |||||
| URI / United Rentals, Inc. | 0,01 | 6,71 | 0,1349 | -0,1467 | |||||
| URI / United Rentals, Inc. | 0,01 | -28,88 | 6,71 | -9,87 | 0,2327 | -0,0489 | |||
| ETN / Eaton Corporation plc | 0,02 | 3,38 | 6,60 | 8,39 | 0,0890 | -0,1414 | |||
| ARES / Ares Management Corporation | 0,04 | 7,25 | 6,56 | -0,98 | 0,0885 | -0,1623 | |||
| ARES / Ares Management Corporation | 0,04 | 6,56 | 0,1320 | -0,1188 | |||||
| DDOG / Datadog, Inc. | 0,04 | -8,64 | 6,28 | -3,16 | 0,0847 | -0,1608 | |||
| DDOG / Datadog, Inc. | 0,04 | 6,28 | 0,1264 | -0,1191 | |||||
| BKNG / Booking Holdings Inc. | 0,00 | 13,74 | 6,26 | 6,07 | 0,2170 | -0,0061 | |||
| CPNG / Coupang, Inc. | 0,19 | 6,24 | 0,1254 | -0,0968 | |||||
| CPNG / Coupang, Inc. | 0,19 | -1,21 | 6,24 | 6,18 | 0,0841 | -0,1381 | |||
| ETN / Eaton Corporation plc | 0,02 | 6,23 | 0,1253 | -0,1052 | |||||
| ORCL / Oracle Corporation | 0,02 | -4,65 | 6,19 | 22,67 | 0,2147 | 0,0238 | |||
| ORCL / Oracle Corporation | 0,02 | 6,19 | 0,1245 | -0,0664 | |||||
| MCK / McKesson Corporation | 0,01 | 6,14 | 0,1236 | -0,1091 | |||||
| MCK / McKesson Corporation | 0,01 | -5,24 | 6,14 | -0,10 | 0,2131 | -0,0196 | |||
| TEL / TE Connectivity plc | 0,03 | 5,63 | 0,1131 | -0,0658 | |||||
| TEL / TE Connectivity plc | 0,03 | -8,64 | 5,63 | 18,92 | 0,1951 | 0,0161 | |||
| DKNG / DraftKings Inc. | 0,15 | -1,02 | 5,54 | -13,69 | 0,1923 | -0,0507 | |||
| AMAT / Applied Materials, Inc. | 0,03 | -80,56 | 5,54 | -78,26 | 0,1922 | -0,7722 | |||
| BKNG / Booking Holdings Inc. | 0,00 | 5,52 | 0,1111 | -0,1121 | |||||
| ROK / Rockwell Automation, Inc. | 0,02 | -2,72 | 5,42 | 2,36 | 0,1880 | -0,0123 | |||
| SPOT / Spotify Technology S.A. | 0,01 | 5,32 | 0,1069 | -0,1529 | |||||
| SPOT / Spotify Technology S.A. | 0,01 | -14,89 | 5,32 | -22,59 | 0,0717 | -0,1881 | |||
| DKNG / DraftKings Inc. | 0,14 | 5,29 | 0,1064 | -0,1366 | |||||
| ROK / Rockwell Automation, Inc. | 0,01 | 5,23 | 0,1051 | -0,0952 | |||||
| LYV / Live Nation Entertainment, Inc. | 0,03 | -8,64 | 5,15 | -1,32 | 0,0694 | -0,1280 | |||
| LYV / Live Nation Entertainment, Inc. | 0,03 | 5,15 | 0,1036 | -0,0939 | |||||
| HUBS / HubSpot, Inc. | 0,01 | -4,06 | 5,06 | -19,37 | 0,1754 | -0,0619 | |||
| ORLY / O'Reilly Automotive, Inc. | 0,05 | 15,33 | 4,99 | 37,97 | 0,1729 | 0,0362 | |||
| VEEV / Veeva Systems Inc. | 0,02 | 4,92 | 0,0989 | -0,0676 | |||||
| VEEV / Veeva Systems Inc. | 0,02 | 8,01 | 4,92 | 11,72 | 0,0663 | -0,1002 | |||
| HUBS / HubSpot, Inc. | 0,01 | 4,91 | 0,0988 | -0,1384 | |||||
| FITB / Fifth Third Bancorp | 0,11 | -8,64 | 4,90 | -1,05 | 0,1700 | -0,0174 | |||
| FITB / Fifth Third Bancorp | 0,11 | 4,90 | 0,0986 | -0,0888 | |||||
| AMAT / Applied Materials, Inc. | 0,02 | 4,89 | 0,0984 | -0,8661 | |||||
| LPLA / LPL Financial Holdings Inc. | 0,01 | -8,64 | 4,77 | -18,94 | 0,0643 | -0,1584 | |||
| LPLA / LPL Financial Holdings Inc. | 0,01 | 4,77 | 0,0960 | -0,1267 | |||||
| PODD / Insulet Corporation | 0,02 | 20,83 | 4,76 | 18,73 | 0,1649 | 0,0134 | |||
| PODD / Insulet Corporation | 0,01 | 4,61 | 0,0927 | -0,0588 | |||||
| ULTA / Ulta Beauty, Inc. | 0,01 | -8,63 | 4,59 | 6,80 | 0,1592 | -0,0034 | |||
| ULTA / Ulta Beauty, Inc. | 0,01 | 4,59 | 0,0923 | -0,0703 | |||||
| NRG / NRG Energy, Inc. | 0,03 | 4,54 | 0,0912 | -0,0950 | |||||
| NRG / NRG Energy, Inc. | 0,03 | -8,64 | 4,54 | -7,86 | 0,0611 | -0,1251 | |||
| RSG / Republic Services, Inc. | 0,02 | 4,44 | 0,0892 | -0,1005 | |||||
| RSG / Republic Services, Inc. | 0,02 | -4,98 | 4,44 | -11,57 | 0,1538 | -0,0359 | |||
| BAC / Bank of America Corporation | 0,09 | -16,39 | 4,39 | -8,84 | 0,1521 | -0,0299 | |||
| BAC / Bank of America Corporation | 0,09 | 4,39 | 0,0882 | -0,0938 | |||||
| ORLY / O'Reilly Automotive, Inc. | 0,04 | 4,34 | 0,0873 | -0,0494 | |||||
| JLL / Jones Lang LaSalle Incorporated | 0,01 | 12,41 | 4,29 | 31,09 | 0,0579 | -0,0660 | |||
| JLL / Jones Lang LaSalle Incorporated | 0,01 | 4,29 | 0,0863 | -0,0375 | |||||
| UNP / Union Pacific Corporation | 0,02 | 4,69 | 4,26 | 7,58 | 0,1477 | -0,0021 | |||
| FERG / Ferguson Enterprises Inc. | 0,02 | -8,64 | 4,09 | -5,78 | 0,0551 | -0,1091 | |||
| FERG / Ferguson Enterprises Inc. | 0,02 | 4,09 | 0,0822 | -0,0819 | |||||
| HOOD / Robinhood Markets, Inc. | 0,03 | 4,08 | 0,0820 | -0,1481 | |||||
| HOOD / Robinhood Markets, Inc. | 0,03 | -56,18 | 4,08 | -32,98 | 0,0549 | -0,1751 | |||
| TSLA / Tesla, Inc. | 0,01 | -7,27 | 4,07 | 29,82 | 0,1412 | 0,0226 | |||
| TSLA / Tesla, Inc. | 0,01 | 4,07 | 0,0819 | -0,0368 | |||||
| JBL / Jabil Inc. | 0,02 | 4,06 | 0,0816 | -0,0871 | |||||
| JBL / Jabil Inc. | 0,02 | -8,64 | 4,06 | -9,04 | 0,1407 | -0,0280 | |||
| SPY / SPDR S&P 500 ETF | 0,01 | 0,00 | 4,03 | 7,85 | 0,1397 | -0,0016 | |||
| SPY / SPDR S&P 500 ETF | 0,01 | 4,03 | 0,0810 | -0,0603 | |||||
| XYL / Xylem Inc. | 0,03 | 4,01 | 0,0806 | -0,0511 | |||||
| XYL / Xylem Inc. | 0,03 | 0,94 | 4,01 | 15,11 | 0,0540 | -0,0777 | |||
| UNP / Union Pacific Corporation | 0,02 | 3,99 | 0,0802 | -0,0696 | |||||
| BURL / Burlington Stores, Inc. | 0,02 | 3,95 | 0,0795 | -0,0425 | |||||
| BURL / Burlington Stores, Inc. | 0,02 | 12,01 | 3,95 | 22,54 | 0,1371 | 0,0151 | |||
| ROP / Roper Technologies, Inc. | 0,01 | -5,55 | 3,91 | -16,92 | 0,1356 | -0,0424 | |||
| ADI / Analog Devices, Inc. | 0,02 | -7,77 | 3,91 | -4,80 | 0,1355 | -0,0197 | |||
| ADI / Analog Devices, Inc. | 0,02 | 3,91 | 0,0786 | -0,0767 | |||||
| TPR / Tapestry, Inc. | 0,03 | -31,44 | 3,84 | -11,62 | 0,1333 | -0,0312 | |||
| TPR / Tapestry, Inc. | 0,03 | 3,84 | 0,0773 | -0,0872 | |||||
| TSCO / Tractor Supply Company | 0,07 | -8,64 | 3,84 | -1,54 | 0,1332 | -0,0144 | |||
| TSCO / Tractor Supply Company | 0,07 | 3,84 | 0,0772 | -0,0703 | |||||
| MCD / McDonald's Corporation | 0,01 | -4,52 | 3,80 | -0,71 | 0,0512 | -0,0934 | |||
| MCD / McDonald's Corporation | 0,01 | 3,80 | 0,0764 | -0,0683 | |||||
| IBM / International Business Machines Corporation | 0,01 | 3,76 | 0,0757 | -0,0794 | |||||
| IBM / International Business Machines Corporation | 0,01 | -4,10 | 3,76 | -8,20 | 0,1305 | -0,0246 | |||
| ROP / Roper Technologies, Inc. | 0,01 | 3,74 | 0,0753 | -0,1027 | |||||
| RACE / Ferrari N.V. | 0,01 | 7,15 | 3,55 | 5,95 | 0,1230 | -0,0036 | |||
| RACE / Ferrari N.V. | 0,01 | 3,55 | 0,0713 | -0,0553 | |||||
| ENTG / Entegris, Inc. | 0,04 | -8,64 | 3,54 | 4,74 | 0,1227 | -0,0051 | |||
| ENTG / Entegris, Inc. | 0,04 | 3,54 | 0,0712 | -0,0566 | |||||
| Z / Zillow Group, Inc. | 0,05 | 15,63 | 3,53 | 25,70 | 0,1225 | 0,0162 | |||
| ZG / Zillow Group, Inc. | 0,05 | 3,53 | 0,0710 | -0,0353 | |||||
| DXCM / DexCom, Inc. | 0,05 | -8,64 | 3,53 | -29,56 | 0,1224 | -0,0672 | |||
| DXCM / DexCom, Inc. | 0,05 | 3,53 | 0,0710 | -0,1186 | |||||
| HD / The Home Depot, Inc. | 0,01 | -3,87 | 3,37 | 6,24 | 0,1169 | -0,0031 | |||
| HD / The Home Depot, Inc. | 0,01 | 3,37 | 0,0678 | -0,0522 | |||||
| SN / SharkNinja, Inc. | 0,03 | 13,56 | 3,36 | 18,33 | 0,0453 | -0,0621 | |||
| SN / SharkNinja, Inc. | 0,03 | 3,36 | 0,0675 | -0,0398 | |||||
| COIN / Coinbase Global, Inc. | 0,01 | -38,23 | 3,35 | -40,52 | 0,1163 | -0,0970 | |||
| COIN / Coinbase Global, Inc. | 0,01 | 3,35 | 0,0674 | -0,1458 | |||||
| MCHP / Microchip Technology Incorporated | 0,05 | -8,26 | 3,34 | -16,27 | 0,1157 | -0,0350 | |||
| MCHP / Microchip Technology Incorporated | 0,05 | 3,34 | 0,0671 | -0,0836 | |||||
| STRL / Sterling Infrastructure, Inc. | 0,01 | -8,64 | 3,19 | 34,50 | 0,1106 | 0,0209 | |||
| STRL / Sterling Infrastructure, Inc. | 0,01 | 3,19 | 0,0641 | -0,0256 | |||||
| RL / Ralph Lauren Corporation | 0,01 | 3,19 | 0,1105 | 0,1105 | |||||
| RL / Ralph Lauren Corporation | 0,01 | 3,19 | 0,0641 | 0,0641 | |||||
| DHI / D.R. Horton, Inc. | 0,02 | 3,14 | 0,0424 | 0,0424 | |||||
| DHI / D.R. Horton, Inc. | 0,02 | 3,14 | 0,0632 | 0,0632 | |||||
| FN / Fabrinet | 0,01 | 3,13 | 0,0629 | -0,0418 | |||||
| FN / Fabrinet | 0,01 | -8,64 | 3,13 | 13,04 | 0,1086 | 0,0038 | |||
| CB / Chubb Limited | 0,01 | -4,70 | 3,08 | -7,15 | 0,1068 | -0,0187 | |||
| CB / Chubb Limited | 0,01 | 3,08 | 0,0619 | -0,0636 | |||||
| RTX / RTX Corporation | 0,02 | -4,64 | 3,05 | 9,28 | 0,1057 | 0,0002 | |||
| RTX / RTX Corporation | 0,02 | 3,05 | 0,0613 | -0,0442 | |||||
| FANG / Diamondback Energy, Inc. | 0,02 | -8,64 | 3,02 | -4,86 | 0,0407 | -0,0793 | |||
| FANG / Diamondback Energy, Inc. | 0,02 | 3,02 | 0,0607 | -0,0593 | |||||
| WFC / Wells Fargo & Company | 0,04 | 12,96 | 3,02 | 18,18 | 0,1046 | 0,0081 | |||
| CTAS / Cintas Corporation | 0,01 | 2,95 | 0,0594 | -0,0685 | |||||
| CTAS / Cintas Corporation | 0,01 | -5,20 | 2,95 | -12,69 | 0,1024 | -0,0255 | |||
| TTD / The Trade Desk, Inc. | 0,06 | -44,45 | 2,89 | -62,19 | 0,1003 | -0,1890 | |||
| QCOM / QUALCOMM Incorporated | 0,02 | 6,68 | 2,89 | 11,42 | 0,1001 | 0,0021 | |||
| TTD / The Trade Desk, Inc. | 0,06 | 2,81 | 0,0565 | -0,2328 | |||||
| NBIX / Neurocrine Biosciences, Inc. | 0,02 | -8,64 | 2,80 | 2,04 | 0,0971 | -0,0067 | |||
| NBIX / Neurocrine Biosciences, Inc. | 0,02 | 2,80 | 0,0563 | -0,0475 | |||||
| MTD / Mettler-Toledo International Inc. | 0,00 | -8,63 | 2,78 | -4,53 | 0,0964 | -0,0137 | |||
| MTD / Mettler-Toledo International Inc. | 0,00 | 2,78 | 0,0559 | -0,0542 | |||||
| WING / Wingstop Inc. | 0,01 | 2,75 | 0,0552 | -0,0969 | |||||
| WING / Wingstop Inc. | 0,01 | -8,64 | 2,75 | -31,73 | 0,0370 | -0,1151 | |||
| QCOM / QUALCOMM Incorporated | 0,02 | 2,73 | 0,0549 | -0,0431 | |||||
| EHC / Encompass Health Corporation | 0,02 | 2,71 | 0,0545 | -0,0367 | |||||
| EHC / Encompass Health Corporation | 0,02 | 8,48 | 2,71 | 12,35 | 0,0365 | -0,0547 | |||
| WFC / Wells Fargo & Company | 0,03 | 2,68 | 0,0539 | -0,0426 | |||||
| NTRA / Natera, Inc. | 0,02 | 14,79 | 2,48 | 9,40 | 0,0334 | -0,0523 | |||
| THC / Tenet Healthcare Corporation | 0,01 | 2,44 | 0,0491 | -0,0385 | |||||
| THC / Tenet Healthcare Corporation | 0,01 | -8,64 | 2,44 | 5,39 | 0,0329 | -0,0547 | |||
| HCA / HCA Healthcare, Inc. | 0,01 | 2,33 | 0,0469 | -0,0369 | |||||
| HCA / HCA Healthcare, Inc. | 0,01 | -5,34 | 2,33 | 5,28 | 0,0314 | -0,0523 | |||
| DE / Deere & Company | 0,01 | 13,48 | 2,30 | 2,09 | 0,0797 | -0,0055 | |||
| CBRE / CBRE Group, Inc. | 0,01 | 2,29 | 0,0795 | 0,0795 | |||||
| CBRE / CBRE Group, Inc. | 0,01 | 2,29 | 0,0461 | 0,0461 | |||||
| ALAB / Astera Labs, Inc. | 0,01 | 2,20 | 0,0442 | 0,0442 | |||||
| ALAB / Astera Labs, Inc. | 0,01 | 2,20 | 0,0763 | 0,0763 | |||||
| MRK / Merck & Co., Inc. | 0,03 | -4,30 | 2,18 | 1,44 | 0,0757 | -0,0057 | |||
| MRK / Merck & Co., Inc. | 0,03 | 2,18 | 0,0439 | -0,0375 | |||||
| AFRM / Affirm Holdings, Inc. | 0,03 | 2,18 | 0,0439 | 0,0439 | |||||
| AFRM / Affirm Holdings, Inc. | 0,03 | 2,18 | 0,0757 | 0,0757 | |||||
| EMR / Emerson Electric Co. | 0,02 | 13,08 | 2,17 | 11,28 | 0,0753 | 0,0015 | |||
| NTRA / Natera, Inc. | 0,01 | 2,17 | 0,0437 | -0,0421 | |||||
| DUOL / Duolingo, Inc. | 0,01 | 2,17 | 0,0435 | -0,0536 | |||||
| DUOL / Duolingo, Inc. | 0,01 | 7,37 | 2,17 | -15,69 | 0,0292 | -0,0680 | |||
| DE / Deere & Company | 0,00 | 2,03 | 0,0409 | -0,0443 | |||||
| APH / Amphenol Corporation | 0,02 | 2,01 | 0,0403 | 0,0403 | |||||
| APH / Amphenol Corporation | 0,02 | 2,01 | 0,0696 | 0,0696 | |||||
| MRVL / Marvell Technology, Inc. | 0,02 | 1,95 | 0,0393 | -0,0352 | |||||
| MRVL / Marvell Technology, Inc. | 0,02 | -8,64 | 1,95 | -0,76 | 0,0677 | -0,0067 | |||
| EMR / Emerson Electric Co. | 0,01 | 1,93 | 0,0388 | -0,0350 | |||||
| NOW / ServiceNow, Inc. | 0,00 | 14,90 | 1,92 | 2,83 | 0,0667 | -0,0040 | |||
| SYK / Stryker Corporation | 0,01 | -5,28 | 1,92 | -11,51 | 0,0259 | -0,0563 | |||
| SYK / Stryker Corporation | 0,01 | 1,92 | 0,0387 | -0,0435 | |||||
| CRS / Carpenter Technology Corporation | 0,01 | 1,90 | 0,0382 | -0,0503 | |||||
| CRS / Carpenter Technology Corporation | 0,01 | -8,63 | 1,90 | -18,80 | 0,0256 | -0,0629 | |||
| APO / Apollo Global Management, Inc. | 0,01 | 1,87 | 0,0376 | -0,1948 | |||||
| APO / Apollo Global Management, Inc. | 0,01 | -67,60 | 1,87 | -69,58 | 0,0252 | -0,2072 | |||
| DECK / Deckers Outdoor Corporation | 0,02 | 1,87 | 0,0376 | -0,0411 | |||||
| DECK / Deckers Outdoor Corporation | 0,02 | -8,64 | 1,87 | -10,15 | 0,0252 | -0,0535 | |||
| TXN / Texas Instruments Incorporated | 0,01 | 389,09 | 1,82 | 333,33 | 0,0631 | 0,0472 | |||
| TXN / Texas Instruments Incorporated | 0,01 | 1,82 | 0,0366 | 0,0207 | |||||
| CHWY / Chewy, Inc. | 0,04 | -8,64 | 1,81 | -13,33 | 0,0244 | -0,0545 | |||
| CHWY / Chewy, Inc. | 0,04 | 1,81 | 0,0364 | -0,0425 | |||||
| CI / The Cigna Group | 0,01 | 1,77 | 0,0357 | -0,0451 | |||||
| CI / The Cigna Group | 0,01 | -4,76 | 1,77 | -16,95 | 0,0615 | -0,0193 | |||
| TMO / Thermo Fisher Scientific Inc. | 0,00 | 11,76 | 1,74 | 33,69 | 0,0604 | 0,0111 | |||
| BMY / Bristol-Myers Squibb Company | 0,04 | 12,21 | 1,74 | 9,37 | 0,0235 | -0,0368 | |||
| NOW / ServiceNow, Inc. | 0,00 | 1,68 | 0,0338 | -0,0369 | |||||
| TKO / TKO Group Holdings, Inc. | 0,01 | -8,64 | 1,66 | 1,41 | 0,0223 | -0,0395 | |||
| TKO / TKO Group Holdings, Inc. | 0,01 | 1,66 | 0,0333 | -0,0285 | |||||
| PGR / The Progressive Corporation | 0,01 | -33,93 | 1,64 | -38,88 | 0,0567 | -0,0445 | |||
| PGR / The Progressive Corporation | 0,01 | 1,64 | 0,0329 | -0,0683 | |||||
| SLM / SLM Corporation | 0,06 | 1,62 | 0,0325 | -0,0468 | |||||
| SLM / SLM Corporation | 0,06 | -8,64 | 1,62 | -22,86 | 0,0560 | -0,0232 | |||
| COF / Capital One Financial Corporation | 0,01 | 1,60 | 0,0321 | -0,0312 | |||||
| COF / Capital One Financial Corporation | 0,01 | -4,55 | 1,60 | -4,61 | 0,0215 | -0,0418 | |||
| CTVA / Corteva, Inc. | 0,02 | 1,58 | 0,0318 | -0,0374 | |||||
| CTVA / Corteva, Inc. | 0,02 | -4,72 | 1,58 | -13,56 | 0,0549 | -0,0144 | |||
| TMO / Thermo Fisher Scientific Inc. | 0,00 | 1,57 | 0,0315 | -0,0178 | |||||
| BMY / Bristol-Myers Squibb Company | 0,03 | 1,56 | 0,0313 | -0,0289 | |||||
| GEHC / GE HealthCare Technologies Inc. | 0,02 | -5,17 | 1,51 | -3,82 | 0,0524 | -0,0070 | |||
| GEHC / GE HealthCare Technologies Inc. | 0,02 | 1,51 | 0,0304 | -0,0291 | |||||
| MTB / M&T Bank Corporation | 0,01 | -5,00 | 1,50 | -3,22 | 0,0522 | -0,0066 | |||
| MTB / M&T Bank Corporation | 0,01 | 1,50 | 0,0303 | -0,0286 | |||||
| AVAV / AeroVironment, Inc. | 0,00 | 1,38 | 0,0278 | 0,0278 | |||||
| AVAV / AeroVironment, Inc. | 0,00 | 1,38 | 0,0479 | 0,0479 | |||||
| YUM / Yum! Brands, Inc. | 0,01 | 1,38 | 0,0277 | -0,0258 | |||||
| YUM / Yum! Brands, Inc. | 0,01 | -5,07 | 1,38 | -2,62 | 0,0477 | -0,0057 | |||
| ALLY / Ally Financial Inc. | 0,03 | -8,64 | 1,33 | -8,09 | 0,0461 | -0,0086 | |||
| ALLY / Ally Financial Inc. | 0,03 | 1,33 | 0,0267 | -0,0280 | |||||
| PH / Parker-Hannifin Corporation | 0,00 | 1,33 | 0,0267 | -0,0217 | |||||
| PH / Parker-Hannifin Corporation | 0,00 | -4,42 | 1,33 | 3,75 | 0,0461 | -0,0024 | |||
| ZTS / Zoetis Inc. | 0,01 | -5,13 | 1,29 | -11,01 | 0,0174 | -0,0375 | |||
| ZTS / Zoetis Inc. | 0,01 | 1,29 | 0,0260 | -0,0290 | |||||
| BSX / Boston Scientific Corporation | 0,01 | 13,70 | 0,97 | 3,42 | 0,0131 | -0,0224 | |||
| ABBV / AbbVie Inc. | 0,00 | 0,93 | 0,0188 | -0,0095 | |||||
| ABBV / AbbVie Inc. | 0,00 | 0,00 | 0,93 | 24,70 | 0,0324 | 0,0041 | |||
| KKR / KKR & Co. Inc. | 0,01 | 0,93 | 0,0188 | -0,0342 | |||||
| KKR / KKR & Co. Inc. | 0,01 | -31,75 | 0,93 | -33,36 | 0,0126 | -0,0404 | |||
| EFX / Equifax Inc. | 0,00 | 0,90 | 0,0182 | -0,0183 | |||||
| EFX / Equifax Inc. | 0,00 | -5,14 | 0,90 | -6,23 | 0,0313 | -0,0051 | |||
| PCLO / Virtus ETF Trust II - Virtus Seix AAA Private Credit CLO ETF | 0,04 | 0,00 | 0,90 | 0,00 | 0,0121 | -0,0219 | |||
| PCLO / Virtus ETF Trust II - Virtus Seix AAA Private Credit CLO ETF | 0,04 | 0,90 | 0,0181 | -0,0159 | |||||
| BSX / Boston Scientific Corporation | 0,01 | 0,86 | 0,0172 | -0,0182 | |||||
| LSCC / Lattice Semiconductor Corporation | 0,01 | 12,70 | 0,76 | 68,65 | 0,0265 | 0,0094 | |||
| EXE / Expand Energy Corporation | 0,01 | -5,14 | 0,73 | -13,80 | 0,0254 | -0,0067 | |||
| EXE / Expand Energy Corporation | 0,01 | 0,73 | 0,0147 | -0,0174 | |||||
| ONTO / Onto Innovation Inc. | 0,01 | 13,56 | 0,71 | 45,42 | 0,0248 | 0,0062 | |||
| LSCC / Lattice Semiconductor Corporation | 0,01 | 0,68 | 0,0137 | -0,0034 | |||||
| LULU / lululemon athletica inc. | 0,00 | 13,64 | 0,68 | -14,89 | 0,0092 | -0,0211 | |||
| ONTO / Onto Innovation Inc. | 0,00 | 0,63 | 0,0127 | -0,0059 | |||||
| T / AT&T Inc. | 0,02 | 0,00 | 0,62 | -2,37 | 0,0214 | -0,0025 | |||
| T / AT&T Inc. | 0,02 | 0,62 | 0,0124 | -0,0115 | |||||
| LULU / lululemon athletica inc. | 0,00 | 0,60 | 0,0121 | -0,0181 | |||||
| CSCO / Cisco Systems, Inc. | 0,01 | 0,60 | 0,0120 | -0,0109 | |||||
| CSCO / Cisco Systems, Inc. | 0,01 | 0,00 | 0,60 | -1,49 | 0,0081 | -0,0149 | |||
| RARE / Ultragenyx Pharmaceutical Inc. | 0,02 | 0,56 | 0,0113 | 0,0113 | |||||
| RARE / Ultragenyx Pharmaceutical Inc. | 0,02 | 0,56 | 0,0075 | 0,0075 | |||||
| PM / Philip Morris International Inc. | 0,00 | 0,52 | 0,0105 | -0,0117 | |||||
| PM / Philip Morris International Inc. | 0,00 | 0,00 | 0,52 | -11,11 | 0,0181 | -0,0041 | |||
| CAT / Caterpillar Inc. | 0,00 | 0,51 | 0,0103 | -0,0055 | |||||
| CAT / Caterpillar Inc. | 0,00 | 0,00 | 0,51 | 23,02 | 0,0178 | 0,0020 | |||
| OXY / Occidental Petroleum Corporation | 0,01 | -4,36 | 0,51 | 7,66 | 0,0176 | -0,0002 | |||
| OXY / Occidental Petroleum Corporation | 0,01 | 0,51 | 0,0102 | -0,0076 | |||||
| XOM / Exxon Mobil Corporation | 0,00 | 0,00 | 0,49 | 4,49 | 0,0066 | -0,0111 | |||
| XOM / Exxon Mobil Corporation | 0,00 | 0,49 | 0,0099 | -0,0079 | |||||
| VZ / Verizon Communications Inc. | 0,01 | 0,47 | 0,0094 | -0,0080 | |||||
| VZ / Verizon Communications Inc. | 0,01 | 0,00 | 0,47 | 1,52 | 0,0163 | -0,0012 | |||
| JNJ / Johnson & Johnson | 0,00 | 0,46 | 0,0092 | -0,0051 | |||||
| JNJ / Johnson & Johnson | 0,00 | 0,00 | 0,46 | 21,49 | 0,0159 | 0,0016 | |||
| FTXP / Foothills Exploration, Inc. | 0,00 | 0,00 | 0,46 | 20,58 | 0,0062 | -0,0082 | |||
| KLAC / KLA Corporation | 0,00 | 0,46 | 0,0092 | -0,0052 | |||||
| CVX / Chevron Corporation | 0,00 | 0,00 | 0,41 | 8,56 | 0,0141 | -0,0001 | |||
| CVX / Chevron Corporation | 0,00 | 0,41 | 0,0082 | -0,0060 | |||||
| MO / Altria Group, Inc. | 0,01 | 0,39 | 0,0079 | -0,0053 | |||||
| MO / Altria Group, Inc. | 0,01 | 0,00 | 0,39 | 12,89 | 0,0053 | -0,0079 | |||
| PG / The Procter & Gamble Company | 0,00 | 0,39 | 0,0078 | -0,0074 | |||||
| GJR / Strats Trust For Procter & Gambel Security - Preferred Security | 0,00 | 0,00 | 0,39 | -3,50 | 0,0134 | -0,0018 | |||
| AMGN / Amgen Inc. | 0,00 | 0,35 | 0,0071 | -0,0061 | |||||
| AMGN / Amgen Inc. | 0,00 | 0,00 | 0,35 | 1,15 | 0,0122 | -0,0010 | |||
| KO / The Coca-Cola Company | 0,01 | 0,35 | 0,0069 | -0,0070 | |||||
| KO / The Coca-Cola Company | 0,01 | 0,00 | 0,35 | -6,25 | 0,0120 | -0,0020 | |||
| UNH / UnitedHealth Group Incorporated | 0,00 | 0,32 | 0,0064 | -0,0447 | |||||
| UNH / UnitedHealth Group Incorporated | 0,00 | -78,71 | 0,32 | -76,43 | 0,0043 | -0,0468 | |||
| C / Citigroup Inc. | 0,00 | 0,00 | 0,29 | 19,03 | 0,0102 | 0,0009 | |||
| C / Citigroup Inc. | 0,00 | 0,29 | 0,0059 | -0,0034 | |||||
| STX / Seagate Technology Holdings plc | 0,00 | 0,00 | 0,28 | 63,74 | 0,0038 | -0,0027 | |||
| STX / Seagate Technology Holdings plc | 0,00 | 0,28 | 0,0099 | 0,0034 | |||||
| AFL / Aflac Incorporated | 0,00 | 0,00 | 0,28 | 6,18 | 0,0095 | -0,0003 | |||
| AFL / Aflac Incorporated | 0,00 | 0,28 | 0,0055 | -0,0043 | |||||
| PAYX / Paychex, Inc. | 0,00 | 0,27 | 0,0054 | -0,0062 | |||||
| PAYX / Paychex, Inc. | 0,00 | 0,00 | 0,27 | -12,75 | 0,0093 | -0,0023 | |||
| GS / The Goldman Sachs Group, Inc. | 0,00 | 0,26 | 0,0051 | -0,0035 | |||||
| GSCE / GS Connect S&P GSCI Enhanced Commodity Total Return ETN | 0,00 | 0,00 | 0,26 | 12,33 | 0,0089 | 0,0003 | |||
| PFE / Pfizer Inc. | 0,01 | 0,00 | 0,25 | 5,39 | 0,0088 | -0,0003 | |||
| PFE / Pfizer Inc. | 0,01 | 0,25 | 0,0051 | -0,0040 | |||||
| GLW / Corning Incorporated | 0,00 | 0,00 | 0,24 | 55,84 | 0,0083 | 0,0025 | |||
| GLW / Corning Incorporated | 0,00 | 0,24 | 0,0048 | -0,0010 | |||||
| DUK / Duke Energy Corporation | 0,00 | 0,23 | 0,0047 | -0,0037 | |||||
| DUK / Duke Energy Corporation | 0,00 | 0,00 | 0,23 | 4,95 | 0,0031 | -0,0053 | |||
| WM / Waste Management, Inc. | 0,00 | 0,00 | 0,23 | -3,36 | 0,0080 | -0,0010 | |||
| WM / Waste Management, Inc. | 0,00 | 0,23 | 0,0046 | -0,0044 | |||||
| ABT / Abbott Laboratories | 0,00 | 0,00 | 0,22 | -1,77 | 0,0077 | -0,0008 | |||
| ABT / Abbott Laboratories | 0,00 | 0,22 | 0,0045 | -0,0041 | |||||
| MS / Morgan Stanley | 0,00 | 0,00 | 0,22 | 12,57 | 0,0075 | 0,0003 | |||
| MS / Morgan Stanley | 0,00 | 0,22 | 0,0043 | -0,0029 | |||||
| MMM / 3M Company | 0,00 | 0,00 | 0,21 | 1,96 | 0,0072 | -0,0005 | |||
| MMM / 3M Company | 0,00 | 0,21 | 0,0042 | -0,0035 | |||||
| BA / The Boeing Company | 0,00 | 0,00 | 0,20 | 3,17 | 0,0026 | -0,0045 | |||
| BA / The Boeing Company | 0,00 | 0,20 | 0,0039 | -0,0032 | |||||
| PRU / Prudential Financial, Inc. | 0,00 | 0,19 | 0,0038 | -0,0036 | |||||
| PRU / Prudential Financial, Inc. | 0,00 | 0,00 | 0,19 | -3,55 | 0,0066 | -0,0009 | |||
| HPQ / HP Inc. | 0,01 | 0,00 | 0,19 | 11,24 | 0,0065 | 0,0001 | |||
| HPQ / HP Inc. | 0,01 | 0,19 | 0,0038 | -0,0026 | |||||
| IEUS / iShares Trust - iShares MSCI Europe Small-Cap ETF | 0,00 | 0,00 | 0,19 | 0,54 | 0,0064 | -0,0006 | |||
| IEUS / iShares Trust - iShares MSCI Europe Small-Cap ETF | 0,00 | 0,19 | 0,0037 | -0,0033 | |||||
| MDT / Medtronic plc | 0,00 | 0,00 | 0,18 | 9,52 | 0,0064 | 0,0000 | |||
| MDT / Medtronic plc | 0,00 | 0,18 | 0,0037 | -0,0027 | |||||
| IP / International Paper Company | 0,00 | 0,00 | 0,17 | -1,20 | 0,0057 | -0,0006 | |||
| IP / International Paper Company | 0,00 | 0,17 | 0,0033 | -0,0030 | |||||
| SO / The Southern Company | 0,00 | 0,00 | 0,16 | 3,16 | 0,0022 | -0,0038 | |||
| SO / The Southern Company | 0,00 | 0,16 | 0,0033 | -0,0027 | |||||
| PNW / Pinnacle West Capital Corporation | 0,00 | 0,00 | 0,16 | 0,62 | 0,0022 | -0,0039 | |||
| PNW / Pinnacle West Capital Corporation | 0,00 | 0,16 | 0,0033 | -0,0029 | |||||
| PEP / PepsiCo, Inc. | 0,00 | 0,00 | 0,16 | 5,96 | 0,0056 | -0,0001 | |||
| PEP / PepsiCo, Inc. | 0,00 | 0,16 | 0,0032 | -0,0025 | |||||
| GILD / Gilead Sciences, Inc. | 0,00 | 0,00 | 0,16 | 0,00 | 0,0054 | -0,0005 | |||
| GILD / Gilead Sciences, Inc. | 0,00 | 0,16 | 0,0031 | -0,0028 | |||||
| WMB / The Williams Companies, Inc. | 0,00 | 0,16 | 0,0031 | -0,0027 | |||||
| WMB / The Williams Companies, Inc. | 0,00 | 0,00 | 0,16 | 0,65 | 0,0054 | -0,0004 | |||
| SPG / Simon Property Group, Inc. | 0,00 | 0,15 | 0,0031 | -0,0019 | |||||
| SPG / Simon Property Group, Inc. | 0,00 | 0,00 | 0,15 | 17,56 | 0,0021 | -0,0029 | |||
| CMI / Cummins Inc. | 0,00 | 0,00 | 0,15 | 29,57 | 0,0052 | 0,0008 | |||
| CMI / Cummins Inc. | 0,00 | 0,15 | 0,0030 | -0,0014 | |||||
| CAH / Cardinal Health, Inc. | 0,00 | 0,00 | 0,15 | -6,37 | 0,0051 | -0,0009 | |||
| CAH / Cardinal Health, Inc. | 0,00 | 0,15 | 0,0030 | -0,0030 | |||||
| ETR / Entergy Corporation | 0,00 | 0,15 | 0,0030 | -0,0020 | |||||
| ETR / Entergy Corporation | 0,00 | 0,00 | 0,15 | 12,21 | 0,0051 | 0,0001 | |||
| NEE / NextEra Energy, Inc. | 0,00 | 0,00 | 0,15 | 8,96 | 0,0020 | -0,0031 | |||
| NEE / NextEra Energy, Inc. | 0,00 | 0,15 | 0,0030 | -0,0022 | |||||
| PFG / Principal Financial Group, Inc. | 0,00 | 0,00 | 0,14 | 4,35 | 0,0050 | -0,0002 | |||
| PFG / Principal Financial Group, Inc. | 0,00 | 0,14 | 0,0029 | -0,0023 | |||||
| BRK.B / Berkshire Hathaway Inc. | 0,00 | 0,14 | 0,0029 | -0,0023 | |||||
| BRK.B / Berkshire Hathaway Inc. | 0,00 | 0,00 | 0,14 | 3,65 | 0,0019 | -0,0033 | |||
| DRI / Darden Restaurants, Inc. | 0,00 | 0,00 | 0,14 | -12,58 | 0,0019 | -0,0042 | |||
| DRI / Darden Restaurants, Inc. | 0,00 | 0,14 | 0,0028 | -0,0032 | |||||
| BLK / BlackRock, Inc. | 0,00 | 0,14 | 0,0028 | -0,0019 | |||||
| BLK / BlackRock, Inc. | 0,00 | 0,00 | 0,14 | 11,29 | 0,0048 | 0,0001 | |||
| LMT / Lockheed Martin Corporation | 0,00 | 0,14 | 0,0028 | -0,0021 | |||||
| LMT / Lockheed Martin Corporation | 0,00 | 0,00 | 0,14 | 7,81 | 0,0019 | -0,0030 | |||
| KMI / Kinder Morgan, Inc. | 0,00 | 0,14 | 0,0027 | -0,0026 | |||||
| KMI / Kinder Morgan, Inc. | 0,00 | 0,00 | 0,14 | -4,26 | 0,0047 | -0,0006 | |||
| SBUX / Starbucks Corporation | 0,00 | 0,00 | 0,14 | -7,53 | 0,0047 | -0,0009 | |||
| SBUX / Starbucks Corporation | 0,00 | 0,14 | 0,0027 | -0,0028 | |||||
| F / Ford Motor Company | 0,01 | 0,00 | 0,14 | 10,66 | 0,0047 | 0,0000 | |||
| F / Ford Motor Company | 0,01 | 0,14 | 0,0027 | -0,0019 | |||||
| IRM / Iron Mountain Incorporated | 0,00 | 0,13 | 0,0026 | -0,0024 | |||||
| IRM / Iron Mountain Incorporated | 0,00 | 0,00 | 0,13 | -0,76 | 0,0046 | -0,0004 | |||
| MET / MetLife, Inc. | 0,00 | 0,00 | 0,13 | 2,34 | 0,0046 | -0,0003 | |||
| MET / MetLife, Inc. | 0,00 | 0,13 | 0,0026 | -0,0022 | |||||
| SNAP / Snap Inc. | 0,02 | 11,01 | 0,13 | -1,56 | 0,0044 | -0,0005 | |||
| NEM / Newmont Corporation | 0,00 | 0,12 | 0,0025 | -0,0007 | |||||
| NEM / Newmont Corporation | 0,00 | 0,00 | 0,12 | 45,88 | 0,0043 | 0,0011 | |||
| PPL / PPL Corporation | 0,00 | 0,00 | 0,12 | 9,91 | 0,0016 | -0,0026 | |||
| PPL / PPL Corporation | 0,00 | 0,12 | 0,0025 | -0,0018 | |||||
| PSA / Public Storage | 0,00 | 0,12 | 0,0024 | -0,0022 | |||||
| PSA / Public Storage | 0,00 | 0,00 | 0,12 | -1,65 | 0,0016 | -0,0030 | |||
| TFC / Truist Financial Corporation | 0,00 | 0,00 | 0,12 | 6,31 | 0,0041 | -0,0001 | |||
| TFC / Truist Financial Corporation | 0,00 | 0,12 | 0,0024 | -0,0018 | |||||
| PLD / Prologis, Inc. | 0,00 | 0,00 | 0,12 | 9,35 | 0,0016 | -0,0025 | |||
| PLD / Prologis, Inc. | 0,00 | 0,12 | 0,0024 | -0,0017 | |||||
| SNAP / Snap Inc. | 0,01 | 0,11 | 0,0023 | -0,0026 | |||||
| KHC / The Kraft Heinz Company | 0,00 | 0,00 | 0,11 | 0,00 | 0,0037 | -0,0003 | |||
| KHC / The Kraft Heinz Company | 0,00 | 0,11 | 0,0022 | -0,0019 | |||||
| ADP / Automatic Data Processing, Inc. | 0,00 | 0,00 | 0,10 | -4,81 | 0,0034 | -0,0005 | |||
| ADP / Automatic Data Processing, Inc. | 0,00 | 0,10 | 0,0020 | -0,0019 | |||||
| AMCR / Amcor plc | 0,01 | 0,10 | 0,0020 | -0,0022 | |||||
| AMCR / Amcor plc | 0,01 | 0,00 | 0,10 | -10,91 | 0,0013 | -0,0029 | |||
| D / Dominion Energy, Inc. | 0,00 | 0,00 | 0,10 | 8,99 | 0,0013 | -0,0021 | |||
| D / Dominion Energy, Inc. | 0,00 | 0,10 | 0,0020 | -0,0014 | |||||
| TGT / Target Corporation | 0,00 | 0,00 | 0,10 | -8,49 | 0,0034 | -0,0007 | |||
| TGT / Target Corporation | 0,00 | 0,10 | 0,0020 | -0,0021 | |||||
| VLO / Valero Energy Corporation | 0,00 | 0,10 | 0,0020 | -0,0009 | |||||
| VLO / Valero Energy Corporation | 0,00 | 0,00 | 0,10 | 27,63 | 0,0034 | 0,0005 | |||
| MPC / Marathon Petroleum Corporation | 0,00 | 0,00 | 0,10 | 15,85 | 0,0033 | 0,0002 | |||
| MPC / Marathon Petroleum Corporation | 0,00 | 0,10 | 0,0019 | -0,0012 | |||||
| GPC / Genuine Parts Company | 0,00 | 0,00 | 0,10 | 14,46 | 0,0033 | 0,0001 | |||
| GPC / Genuine Parts Company | 0,00 | 0,10 | 0,0019 | -0,0012 | |||||
| CMCSA / Comcast Corporation | 0,00 | 0,00 | 0,10 | -12,04 | 0,0033 | -0,0008 | |||
| CMCSA / Comcast Corporation | 0,00 | 0,10 | 0,0019 | -0,0022 | |||||
| HPE / Hewlett Packard Enterprise Company | 0,00 | 0,10 | 0,0019 | -0,0011 | |||||
| HPE / Hewlett Packard Enterprise Company | 0,00 | 0,00 | 0,10 | 20,25 | 0,0033 | 0,0003 | |||
| COP / ConocoPhillips | 0,00 | 0,00 | 0,09 | 5,62 | 0,0033 | -0,0001 | |||
| COP / ConocoPhillips | 0,00 | 0,09 | 0,0019 | -0,0015 | |||||
| CCI / Crown Castle Inc. | 0,00 | 0,00 | 0,09 | -7,00 | 0,0033 | -0,0005 | |||
| CCI / Crown Castle Inc. | 0,00 | 0,09 | 0,0019 | -0,0019 | |||||
| CME / CME Group Inc. | 0,00 | 0,00 | 0,09 | -2,11 | 0,0033 | -0,0004 | |||
| CME / CME Group Inc. | 0,00 | 0,09 | 0,0019 | -0,0017 | |||||
| GD / General Dynamics Corporation | 0,00 | 0,09 | 0,0019 | -0,0011 | |||||
| GDX / General Dynamics Corporation | 0,00 | 0,00 | 0,09 | 17,72 | 0,0032 | 0,0002 | |||
| PNC / The PNC Financial Services Group, Inc. | 0,00 | 0,00 | 0,09 | 7,23 | 0,0031 | -0,0000 | |||
| PNC / The PNC Financial Services Group, Inc. | 0,00 | 0,09 | 0,0018 | -0,0013 | |||||
| CVS / CVS Health Corporation | 0,00 | 0,00 | 0,09 | 10,00 | 0,0031 | 0,0000 | |||
| CVS / CVS Health Corporation | 0,00 | 0,09 | 0,0018 | -0,0013 | |||||
| LYB / LyondellBasell Industries N.V. | 0,00 | 0,00 | 0,09 | -15,53 | 0,0030 | -0,0009 | |||
| LYB / LyondellBasell Industries N.V. | 0,00 | 0,09 | 0,0018 | -0,0022 | |||||
| JCI / Johnson Controls International plc | 0,00 | 0,00 | 0,09 | 3,61 | 0,0030 | -0,0001 | |||
| JCI / Johnson Controls International plc | 0,00 | 0,09 | 0,0017 | -0,0014 | |||||
| DOC / Healthpeak Properties, Inc. | 0,00 | 0,09 | 0,0017 | -0,0012 | |||||
| DOC / Healthpeak Properties, Inc. | 0,00 | 0,00 | 0,09 | 8,97 | 0,0030 | 0,0000 | |||
| MDLZ / Mondelez International, Inc. | 0,00 | 0,09 | 0,0017 | -0,0018 | |||||
| MDLZ / Mondelez International, Inc. | 0,00 | 0,00 | 0,09 | -7,61 | 0,0030 | -0,0005 | |||
| BK / The Bank of New York Mellon Corporation | 0,00 | 0,00 | 0,08 | 20,00 | 0,0029 | 0,0003 | |||
| BK / The Bank of New York Mellon Corporation | 0,00 | 0,08 | 0,0017 | -0,0010 | |||||
| CNP / CenterPoint Energy, Inc. | 0,00 | 0,00 | 0,08 | 6,41 | 0,0029 | -0,0001 | |||
| CNP / CenterPoint Energy, Inc. | 0,00 | 0,08 | 0,0017 | -0,0013 | |||||
| ELV / Elevance Health, Inc. | 0,00 | 0,08 | 0,0017 | -0,0021 | |||||
| ELV / Elevance Health, Inc. | 0,00 | 0,00 | 0,08 | -16,16 | 0,0029 | -0,0009 | |||
| NSC / Norfolk Southern Corporation | 0,00 | 0,00 | 0,08 | 17,14 | 0,0029 | 0,0002 | |||
| NSC / Norfolk Southern Corporation | 0,00 | 0,08 | 0,0017 | -0,0010 | |||||
| GM / General Motors Company | 0,00 | 0,08 | 0,0017 | -0,0009 | |||||
| GM / General Motors Company | 0,00 | 0,00 | 0,08 | 24,24 | 0,0011 | -0,0014 | |||
| UPS / United Parcel Service, Inc. | 0,00 | 0,08 | 0,0016 | -0,0020 | |||||
| UPS / United Parcel Service, Inc. | 0,00 | 0,00 | 0,08 | -16,67 | 0,0028 | -0,0009 | |||
| ITW / Illinois Tool Works Inc. | 0,00 | 0,00 | 0,08 | 5,33 | 0,0011 | -0,0018 | |||
| ITW / Illinois Tool Works Inc. | 0,00 | 0,08 | 0,0016 | -0,0012 | |||||
| CSX / CSX Corporation | 0,00 | 0,00 | 0,08 | 9,86 | 0,0027 | -0,0000 | |||
| CSX / CSX Corporation | 0,00 | 0,08 | 0,0016 | -0,0011 | |||||
| TRV / The Travelers Companies, Inc. | 0,00 | 0,00 | 0,08 | 4,05 | 0,0027 | -0,0001 | |||
| TRV / The Travelers Companies, Inc. | 0,00 | 0,08 | 0,0016 | -0,0013 | |||||
| USB / U.S. Bancorp | 0,00 | 0,00 | 0,08 | 7,04 | 0,0010 | -0,0017 | |||
| USB / U.S. Bancorp | 0,00 | 0,08 | 0,0015 | -0,0012 | |||||
| PEG / Public Service Enterprise Group Incorporated | 0,00 | 0,08 | 0,0015 | -0,0014 | |||||
| PEG / Public Service Enterprise Group Incorporated | 0,00 | 0,00 | 0,08 | -1,32 | 0,0010 | -0,0019 | |||
| APD / Air Products and Chemicals, Inc. | 0,00 | 0,08 | 0,0015 | -0,0014 | |||||
| APD / Air Products and Chemicals, Inc. | 0,00 | 0,00 | 0,08 | -3,85 | 0,0010 | -0,0019 | |||
| MCO / Moody's Corporation | 0,00 | 0,07 | 0,0015 | -0,0015 | |||||
| MCO / Moody's Corporation | 0,00 | 0,00 | 0,07 | -5,13 | 0,0010 | -0,0020 | |||
| AMP / Ameriprise Financial, Inc. | 0,00 | 0,00 | 0,07 | -8,64 | 0,0026 | -0,0005 | |||
| AMP / Ameriprise Financial, Inc. | 0,00 | 0,07 | 0,0015 | -0,0016 | |||||
| AMT / American Tower Corporation | 0,00 | 0,07 | 0,0015 | -0,0017 | |||||
| AMT / American Tower Corporation | 0,00 | 0,00 | 0,07 | -13,10 | 0,0010 | -0,0022 | |||
| NKE / NIKE, Inc. | 0,00 | 0,00 | 0,07 | -1,35 | 0,0025 | -0,0003 | |||
| NKE / NIKE, Inc. | 0,00 | 0,07 | 0,0015 | -0,0013 | |||||
| AVB / AvalonBay Communities, Inc. | 0,00 | 0,00 | 0,07 | -5,26 | 0,0025 | -0,0004 | |||
| AVB / AvalonBay Communities, Inc. | 0,00 | 0,07 | 0,0015 | -0,0014 | |||||
| MMC / Marsh & McLennan Companies, Inc. | 0,00 | 0,00 | 0,07 | -7,69 | 0,0010 | -0,0020 | |||
| MMC / Marsh & McLennan Companies, Inc. | 0,00 | 0,07 | 0,0015 | -0,0015 | |||||
| OKE / ONEOK, Inc. | 0,00 | 0,00 | 0,07 | -10,39 | 0,0009 | -0,0020 | |||
| OKE / ONEOK, Inc. | 0,00 | 0,07 | 0,0014 | -0,0015 | |||||
| DOW / Dow Inc. | 0,00 | 0,07 | 0,0014 | -0,0016 | |||||
| DOW / Dow Inc. | 0,00 | 0,00 | 0,07 | -13,92 | 0,0024 | -0,0006 | |||
| CL / Colgate-Palmolive Company | 0,00 | 0,07 | 0,0014 | -0,0016 | |||||
| CL / Colgate-Palmolive Company | 0,00 | 0,00 | 0,07 | -11,69 | 0,0024 | -0,0006 | |||
| CEG / Constellation Energy Corporation | 0,00 | 0,00 | 0,07 | 3,03 | 0,0024 | -0,0002 | |||
| CEG / Constellation Energy Corporation | 0,00 | 0,07 | 0,0014 | -0,0012 | |||||
| ICE / Intercontinental Exchange, Inc. | 0,00 | 0,07 | 0,0014 | -0,0014 | |||||
| ICE / Intercontinental Exchange, Inc. | 0,00 | 0,00 | 0,07 | -8,11 | 0,0024 | -0,0004 | |||
| HAS / Hasbro, Inc. | 0,00 | 0,00 | 0,07 | 3,08 | 0,0023 | -0,0001 | |||
| HAS / Hasbro, Inc. | 0,00 | 0,07 | 0,0014 | -0,0011 | |||||
| BBY / Best Buy Co., Inc. | 0,00 | 0,00 | 0,07 | 13,56 | 0,0023 | 0,0001 | |||
| BBY / Best Buy Co., Inc. | 0,00 | 0,07 | 0,0014 | -0,0009 | |||||
| OMC / Omnicom Group Inc. | 0,00 | 0,07 | 0,0013 | -0,0009 | |||||
| OMC / Omnicom Group Inc. | 0,00 | 0,00 | 0,07 | 12,07 | 0,0009 | -0,0013 | |||
| STT / State Street Corporation | 0,00 | 0,06 | 0,0013 | -0,0009 | |||||
| STT / State Street Corporation | 0,00 | 0,00 | 0,06 | 8,62 | 0,0022 | 0,0000 | |||
| WELL / Welltower Inc. | 0,00 | 0,00 | 0,06 | 15,09 | 0,0021 | 0,0001 | |||
| WELL / Welltower Inc. | 0,00 | 0,06 | 0,0012 | -0,0008 | |||||
| IVZ / Invesco Ltd. | 0,00 | 0,00 | 0,06 | 46,34 | 0,0021 | 0,0005 | |||
| IVZ / Invesco Ltd. | 0,00 | 0,06 | 0,0012 | -0,0004 | |||||
| AVY / Avery Dennison Corporation | 0,00 | 0,00 | 0,06 | -7,81 | 0,0021 | -0,0004 | |||
| AVY / Avery Dennison Corporation | 0,00 | 0,06 | 0,0012 | -0,0012 | |||||
| EOG / EOG Resources, Inc. | 0,00 | 0,06 | 0,0012 | -0,0012 | |||||
| EOG / EOG Resources, Inc. | 0,00 | 0,00 | 0,06 | -6,35 | 0,0021 | -0,0003 | |||
| IPG / The Interpublic Group of Companies, Inc. | 0,00 | 0,06 | 0,0012 | -0,0008 | |||||
| IPG / The Interpublic Group of Companies, Inc. | 0,00 | 0,00 | 0,06 | 15,69 | 0,0008 | -0,0012 | |||
| WHR / Whirlpool Corporation | 0,00 | 0,00 | 0,06 | -22,67 | 0,0020 | -0,0008 | |||
| WHR / Whirlpool Corporation | 0,00 | 0,06 | 0,0012 | -0,0017 | |||||
| HBAN / Huntington Bancshares Incorporated | 0,00 | 0,00 | 0,06 | 3,77 | 0,0019 | -0,0001 | |||
| HBAN / Huntington Bancshares Incorporated | 0,00 | 0,06 | 0,0011 | -0,0009 | |||||
| BX / Blackstone Inc. | 0,00 | 0,05 | 0,0011 | -0,0007 | |||||
| BX / Blackstone Inc. | 0,00 | 0,00 | 0,05 | 12,77 | 0,0019 | 0,0001 | |||
| AIG / American International Group, Inc. | 0,00 | 0,05 | 0,0011 | -0,0011 | |||||
| AIG / American International Group, Inc. | 0,00 | 0,00 | 0,05 | -7,14 | 0,0018 | -0,0003 | |||
| TAP / Molson Coors Beverage Company | 0,00 | 0,00 | 0,05 | -5,45 | 0,0018 | -0,0003 | |||
| TAP / Molson Coors Beverage Company | 0,00 | 0,05 | 0,0010 | -0,0010 | |||||
| AEP / American Electric Power Company, Inc. | 0,00 | 0,05 | 0,0010 | -0,0007 | |||||
| AEP / American Electric Power Company, Inc. | 0,00 | 0,00 | 0,05 | 8,89 | 0,0007 | -0,0011 | |||
| LOW / Lowe's Companies, Inc. | 0,00 | 0,05 | 0,0010 | -0,0007 | |||||
| LOW / Lowe's Companies, Inc. | 0,00 | 0,00 | 0,05 | 13,95 | 0,0017 | 0,0001 | |||
| O / Realty Income Corporation | 0,00 | 0,05 | 0,0010 | -0,0008 | |||||
| O / Realty Income Corporation | 0,00 | 0,00 | 0,05 | 6,67 | 0,0017 | -0,0001 | |||
| LIN / Linde plc | 0,00 | 0,05 | 0,0010 | -0,0008 | |||||
| LIN / Linde plc | 0,00 | 0,00 | 0,05 | 2,17 | 0,0016 | -0,0001 | |||
| EQIX / Equinix, Inc. | 0,00 | 0,00 | 0,05 | -2,13 | 0,0016 | -0,0002 | |||
| EQIX / Equinix, Inc. | 0,00 | 0,05 | 0,0009 | -0,0009 | |||||
| DAL / Delta Air Lines, Inc. | 0,00 | 0,00 | 0,05 | 15,00 | 0,0016 | 0,0001 | |||
| DAL / Delta Air Lines, Inc. | 0,00 | 0,05 | 0,0009 | -0,0006 | |||||
| DD / DuPont de Nemours, Inc. | 0,00 | 0,05 | 0,0009 | -0,0006 | |||||
| DD / DuPont de Nemours, Inc. | 0,00 | 0,00 | 0,05 | 12,50 | 0,0016 | 0,0001 | |||
| BXP / Boston Properties, Inc. | 0,00 | 0,05 | 0,0009 | -0,0006 | |||||
| BXP / Boston Properties, Inc. | 0,00 | 0,00 | 0,05 | 9,76 | 0,0016 | 0,0000 | |||
| SLB / SLB N.V. | 0,00 | 0,04 | 0,0009 | -0,0007 | |||||
| SLB / SLB N.V. | 0,00 | 0,00 | 0,04 | 2,38 | 0,0015 | -0,0001 | |||
| VICI / VICI Properties Inc. | 0,00 | 0,00 | 0,04 | 0,00 | 0,0014 | -0,0001 | |||
| VICI / VICI Properties Inc. | 0,00 | 0,04 | 0,0008 | -0,0007 | |||||
| TROW / T. Rowe Price Group, Inc. | 0,00 | 0,04 | 0,0008 | -0,0006 | |||||
| TROW / T. Rowe Price Group, Inc. | 0,00 | 0,00 | 0,04 | 8,33 | 0,0014 | -0,0000 | |||
| PCAR / PACCAR Inc | 0,00 | 0,00 | 0,04 | 5,41 | 0,0014 | -0,0001 | |||
| PCAR / PACCAR Inc | 0,00 | 0,04 | 0,0008 | -0,0006 | |||||
| GIS / General Mills, Inc. | 0,00 | 0,04 | 0,0008 | -0,0007 | |||||
| GIS / General Mills, Inc. | 0,00 | 0,00 | 0,04 | -2,63 | 0,0013 | -0,0002 | |||
| ADM / Archer-Daniels-Midland Company | 0,00 | 0,04 | 0,0007 | -0,0005 | |||||
| ADM / Archer-Daniels-Midland Company | 0,00 | 0,00 | 0,04 | 12,50 | 0,0005 | -0,0007 | |||
| DOCU / DocuSign, Inc. | 0,00 | -5,61 | 0,04 | -12,20 | 0,0013 | -0,0003 | |||
| DOCU / DocuSign, Inc. | 0,00 | 0,04 | 0,0007 | -0,0008 | |||||
| WEC / WEC Energy Group, Inc. | 0,00 | 0,03 | 0,0007 | -0,0005 | |||||
| WEC / WEC Energy Group, Inc. | 0,00 | 0,00 | 0,03 | 10,00 | 0,0004 | -0,0007 | |||
| MAR / Marriott International, Inc. | 0,00 | 0,03 | 0,0007 | -0,0006 | |||||
| MAR / Marriott International, Inc. | 0,00 | 0,00 | 0,03 | -5,88 | 0,0004 | -0,0009 | |||
| EIX / Edison International | 0,00 | 0,03 | 0,0006 | -0,0005 | |||||
| EIX / Edison International | 0,00 | 0,00 | 0,03 | 7,14 | 0,0011 | -0,0000 | |||
| NOC / Northrop Grumman Corporation | 0,00 | 0,03 | 0,0006 | -0,0003 | |||||
| NOC / Northrop Grumman Corporation | 0,00 | 0,00 | 0,03 | 20,83 | 0,0004 | -0,0005 | |||
| EXC / Exelon Corporation | 0,00 | 0,03 | 0,0006 | -0,0005 | |||||
| EXC / Exelon Corporation | 0,00 | 0,00 | 0,03 | 0,00 | 0,0010 | -0,0001 | |||
| SRE / Sempra | 0,00 | 0,03 | 0,0006 | -0,0003 | |||||
| SRE / Sempra | 0,00 | 0,00 | 0,03 | 17,39 | 0,0009 | 0,0001 | |||
| CCL / Carnival Corporation & plc | 0,00 | 0,03 | 0,0005 | -0,0005 | |||||
| CCL / Carnival Corporation & plc | 0,00 | 0,00 | 0,03 | 3,85 | 0,0004 | -0,0006 | |||
| PPG / PPG Industries, Inc. | 0,00 | 0,00 | 0,03 | -7,41 | 0,0003 | -0,0007 | |||
| PPG / PPG Industries, Inc. | 0,00 | 0,03 | 0,0005 | -0,0005 | |||||
| PSX / Phillips 66 | 0,00 | 0,03 | 0,0005 | -0,0003 | |||||
| PSX / Phillips 66 | 0,00 | 0,00 | 0,03 | 13,64 | 0,0009 | 0,0000 | |||
| KEY / KeyCorp | 0,00 | 0,02 | 0,0005 | -0,0004 | |||||
| KEY / KeyCorp | 0,00 | 0,00 | 0,02 | 9,09 | 0,0008 | -0,0000 | |||
| FDX / FedEx Corporation | 0,00 | 0,02 | 0,0005 | -0,0004 | |||||
| FDX / FedEx Corporation | 0,00 | 0,00 | 0,02 | 4,76 | 0,0008 | -0,0000 | |||
| AEE / Ameren Corporation | 0,00 | 0,00 | 0,02 | 10,00 | 0,0008 | -0,0000 | |||
| AEE / Ameren Corporation | 0,00 | 0,02 | 0,0004 | -0,0003 | |||||
| VTR / Ventas, Inc. | 0,00 | 0,02 | 0,0004 | -0,0003 | |||||
| VTR / Ventas, Inc. | 0,00 | 0,00 | 0,02 | 10,53 | 0,0008 | 0,0000 | |||
| HAL / Halliburton Company | 0,00 | 0,00 | 0,02 | 17,65 | 0,0007 | 0,0001 | |||
| HAL / Halliburton Company | 0,00 | 0,02 | 0,0004 | -0,0002 | |||||
| EQR / Equity Residential | 0,00 | 0,02 | 0,0004 | -0,0004 | |||||
| EQR / Equity Residential | 0,00 | 0,00 | 0,02 | 0,00 | 0,0007 | -0,0001 | |||
| WYNN / Wynn Resorts, Limited | 0,00 | 0,02 | 0,0003 | -0,0001 | |||||
| WYNN / Wynn Resorts, Limited | 0,00 | 0,00 | 0,02 | 50,00 | 0,0005 | 0,0001 | |||
| CPB / The Campbell's Company | 0,00 | 0,00 | 0,01 | 0,00 | 0,0005 | -0,0000 | |||
| CPB / The Campbell's Company | 0,00 | 0,01 | 0,0003 | -0,0002 | |||||
| ALL / The Allstate Corporation | 0,00 | 0,00 | 0,01 | 7,69 | 0,0002 | -0,0003 | |||
| ALL / The Allstate Corporation | 0,00 | 0,01 | 0,0003 | -0,0002 | |||||
| APA / APA Corporation | 0,00 | 0,00 | 0,01 | 25,00 | 0,0002 | 0,0000 | |||
| APA / APA Corporation | 0,00 | 0,01 | 0,0001 | -0,0000 | |||||
| AJG / Arthur J. Gallagher & Co. | 0,00 | -100,00 | 0,00 | -100,00 | -0,2233 | ||||
| AJG / Arthur J. Gallagher & Co. | 0,00 | 0,00 | 0,0000 | ||||||
| AME / AMETEK, Inc. | 0,00 | -100,00 | 0,00 | 0,0000 | |||||
| AME / AMETEK, Inc. | 0,00 | -100,00 | 0,00 | 0,0000 | |||||
| XMTR / Xometry, Inc. | 0,00 | 0,00 | -0,0282 | ||||||
| XMTR / Xometry, Inc. | 0,00 | -100,00 | 0,00 | -100,00 | -0,0282 |