Basisstatistiken
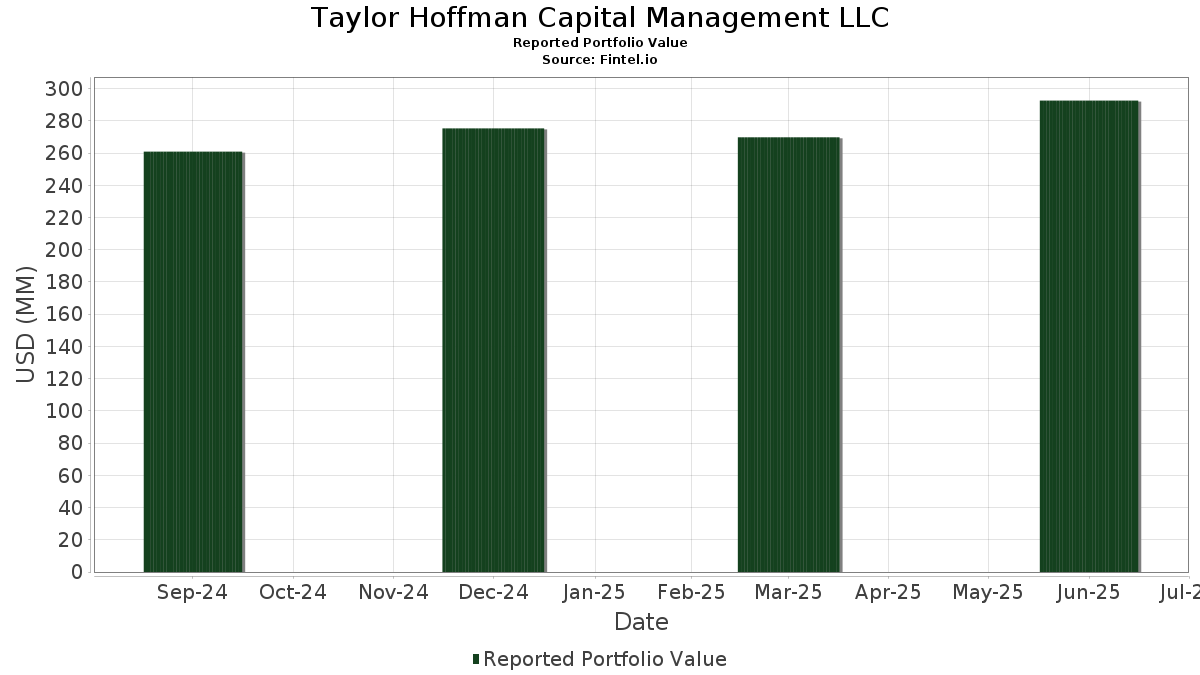
| Portfolio-Wert | $ 317.427.265 |
| Aktuelle Positionen | 118 |
Neueste Bestände, Performance, AUM (aus 13F, 13D)
Taylor Hoffman Capital Management LLC hat 118 Gesamtbeteiligungen in seinen letzten SEC-Einreichungen offengelegt. Der jüngste Portfoliowert wird auf $ 317.427.265 USD berechnet. Das tatsächliche verwaltete Vermögen (AUM) ist dieser Wert plus Barmittel (die nicht offengelegt werden). Taylor Hoffman Capital Management LLCs Top-Bestände sind Apple Inc. (US:AAPL) , Arista Networks, Inc. (US:ANET) , Meta Platforms, Inc. (US:META) , Lam Research Corporation (US:LRCX) , and Alphabet Inc. (US:GOOGL) . Taylor Hoffman Capital Management LLCs neue Positionen sind MarketAxess Holdings Inc. (US:MKTX) , NewMarket Corporation (US:NEU) , The Hershey Company (US:HSY) , .
Top-Zuwächse in diesem Quartal
Wir verwenden die Veränderung der Portfolioallokation, weil dies die aussagekräftigste Kennzahl ist. Die Änderungen können auf Trades oder Änderungen der Aktienkurse zurückzuführen sein.
| Wertpapier | Aktien (MM) |
Wert (MM$) |
Portfolio % | ΔPortfolio % |
|---|---|---|---|---|
| ANET / Arista Networks, Inc. | 0,14 | 20,00 | 6,2993 | 1,4166 |
| MKTX / MarketAxess Holdings Inc. | 0,02 | 3,36 | 1,0587 | 1,0587 |
| AAPL / Apple Inc. | 0,09 | 24,03 | 7,5697 | 0,9210 |
| LRCX / Lam Research Corporation | 0,10 | 12,75 | 4,0177 | 0,8590 |
| GOOGL / Alphabet Inc. | 0,04 | 10,14 | 3,1929 | 0,7224 |
| GNTX / Gentex Corporation | 0,19 | 5,38 | 1,6941 | 0,3869 |
| EBAY / eBay Inc. | 0,11 | 9,70 | 3,0550 | 0,3684 |
| AWI / Armstrong World Industries, Inc. | 0,04 | 8,67 | 2,7326 | 0,2715 |
| EA / Electronic Arts Inc. | 0,03 | 5,88 | 1,8537 | 0,2656 |
| JNJ / Johnson & Johnson | 0,03 | 5,57 | 1,7546 | 0,1956 |
Top-Rückgänge in diesem Quartal
Wir verwenden die Veränderung der Portfolioallokation, weil dies die aussagekräftigste Kennzahl ist. Änderungen können auf Handelsgeschäfte oder Änderungen der Aktienkurse zurückzuführen sein.
| Wertpapier | Aktien (MM) |
Wert (MM$) |
Portfolio % | ΔPortfolio % |
|---|---|---|---|---|
| FICO / Fair Isaac Corporation | 0,01 | 7,85 | 2,4728 | -0,7904 |
| META / Meta Platforms, Inc. | 0,02 | 14,56 | 4,5869 | -0,5335 |
| DE / Deere & Company | 0,02 | 7,78 | 2,4516 | -0,4952 |
| PAYX / Paychex, Inc. | 0,04 | 5,15 | 1,6214 | -0,3733 |
| CNS / Cohen & Steers, Inc. | 0,06 | 4,19 | 1,3188 | -0,2989 |
| GJR / Strats Trust For Procter & Gambel Security - Preferred Security | 0,04 | 6,74 | 2,1232 | -0,2628 |
| SEIC / SEI Investments Company | 0,07 | 5,96 | 1,8782 | -0,2482 |
| SPGI / S&P Global Inc. | 0,01 | 4,78 | 1,5071 | -0,2470 |
| CSCO / Cisco Systems, Inc. | 0,11 | 7,32 | 2,3072 | -0,2215 |
| PM / Philip Morris International Inc. | 0,02 | 3,00 | 0,9435 | -0,2059 |
13F und Fondseinreichungen
Dieses Formular wurde am 2025-11-07 für den Berichtszeitraum eingereicht 2025-09-30. Klicken Sie auf das Link-Symbol , um den gesamten Transaktionsverlauf zu sehen.
Upgrade um die Prämiendaten zu entsperren und nach Excel zu exportieren ![]() .
.
| Wertpapier | Typ | Durchschnittlicher Aktienkurs | Aktien (MM) |
ΔAktien (%) |
Wert ($MM) |
ΔAktien (%) |
Portfolio (%) |
ΔPortfolio (%) |
|
|---|---|---|---|---|---|---|---|---|---|
| AAPL / Apple Inc. | 0,09 | -0,47 | 24,03 | 23,52 | 7,5697 | 0,9210 | |||
| ANET / Arista Networks, Inc. | 0,14 | -1,72 | 20,00 | 39,96 | 6,2993 | 1,4166 | |||
| META / Meta Platforms, Inc. | 0,02 | -2,32 | 14,56 | -2,81 | 4,5869 | -0,5335 | |||
| LRCX / Lam Research Corporation | 0,10 | 0,32 | 12,75 | 38,00 | 4,0177 | 0,8590 | |||
| GOOGL / Alphabet Inc. | 0,04 | 1,65 | 10,14 | 40,22 | 3,1929 | 0,7224 | |||
| AMAT / Applied Materials, Inc. | 0,05 | 0,73 | 9,78 | 12,64 | 3,0822 | 0,1138 | |||
| EBAY / eBay Inc. | 0,11 | 1,00 | 9,70 | 23,37 | 3,0550 | 0,3684 | |||
| AWI / Armstrong World Industries, Inc. | 0,04 | -0,17 | 8,67 | 20,47 | 2,7326 | 0,2715 | |||
| FICO / Fair Isaac Corporation | 0,01 | 0,42 | 7,85 | -17,79 | 2,4728 | -0,7904 | |||
| SNA / Snap-on Incorporated | 0,02 | 1,98 | 7,82 | 13,58 | 2,4639 | 0,1102 | |||
| DE / Deere & Company | 0,02 | 0,37 | 7,78 | -9,73 | 2,4516 | -0,4952 | |||
| CSCO / Cisco Systems, Inc. | 0,11 | 0,38 | 7,32 | -1,01 | 2,3072 | -0,2215 | |||
| VEA / Vanguard Tax-Managed Funds - Vanguard FTSE Developed Markets ETF | 0,11 | -0,33 | 6,77 | 4,77 | 2,1331 | -0,0760 | |||
| GJR / Strats Trust For Procter & Gambel Security - Preferred Security | 0,04 | 0,10 | 6,74 | -3,47 | 2,1232 | -0,2628 | |||
| MSFT / Microsoft Corporation | 0,01 | -0,04 | 5,99 | 4,08 | 1,8879 | -0,0799 | |||
| SEIC / SEI Investments Company | 0,07 | 1,48 | 5,96 | -4,18 | 1,8782 | -0,2482 | |||
| EA / Electronic Arts Inc. | 0,03 | 0,27 | 5,88 | 26,65 | 1,8537 | 0,2656 | |||
| VRSN / VeriSign, Inc. | 0,02 | 1,09 | 5,69 | -2,15 | 1,7937 | -0,1949 | |||
| JNJ / Johnson & Johnson | 0,03 | 0,59 | 5,57 | 22,10 | 1,7546 | 0,1956 | |||
| ADBE / Adobe Inc. | 0,02 | 19,26 | 5,49 | 8,76 | 1,7289 | 0,0040 | |||
| GNTX / Gentex Corporation | 0,19 | 9,25 | 5,38 | 40,61 | 1,6941 | 0,3869 | |||
| PAYX / Paychex, Inc. | 0,04 | 1,20 | 5,15 | -11,82 | 1,6214 | -0,3733 | |||
| ALSN / Allison Transmission Holdings, Inc. | 0,06 | 9,93 | 5,05 | -1,77 | 1,5906 | -0,1661 | |||
| MCO / Moody's Corporation | 0,01 | 0,93 | 4,94 | -4,11 | 1,5566 | -0,2047 | |||
| SPGI / S&P Global Inc. | 0,01 | 0,99 | 4,78 | -6,80 | 1,5071 | -0,2470 | |||
| UNP / Union Pacific Corporation | 0,02 | 1,58 | 4,67 | 4,36 | 1,4714 | -0,0582 | |||
| TROW / T. Rowe Price Group, Inc. | 0,04 | 3,57 | 4,39 | 10,16 | 1,3834 | 0,0209 | |||
| QLYS / Qualys, Inc. | 0,03 | 4,56 | 4,33 | -3,15 | 1,3653 | -0,1642 | |||
| CNS / Cohen & Steers, Inc. | 0,06 | 1,57 | 4,19 | -11,56 | 1,3188 | -0,2989 | |||
| GGG / Graco Inc. | 0,05 | 2,84 | 4,01 | 1,62 | 1,2648 | -0,0854 | |||
| MNST / Monster Beverage Corporation | 0,06 | 1,50 | 3,74 | 9,10 | 1,1789 | 0,0062 | |||
| KLAC / KLA Corporation | 0,00 | -0,68 | 3,61 | 19,57 | 1,1359 | 0,1054 | |||
| BND / Vanguard Bond Index Funds - Vanguard Total Bond Market ETF | 0,05 | -3,91 | 3,59 | -2,94 | 1,1320 | -0,1334 | |||
| VOO / Vanguard Index Funds - Vanguard S&P 500 ETF | 0,01 | -7,24 | 3,39 | 0,03 | 1,0680 | -0,0906 | |||
| MKTX / MarketAxess Holdings Inc. | 0,02 | 3,36 | 1,0587 | 1,0587 | |||||
| BN / Brookfield Corporation | 0,05 | -0,54 | 3,18 | 10,26 | 1,0021 | 0,0163 | |||
| PM / Philip Morris International Inc. | 0,02 | 0,00 | 3,00 | -10,94 | 0,9435 | -0,2059 | |||
| CSX / CSX Corporation | 0,08 | 0,00 | 2,79 | 8,80 | 0,8805 | 0,0027 | |||
| VUG / Vanguard Index Funds - Vanguard Growth ETF | 0,00 | -1,89 | 2,06 | 7,34 | 0,6499 | -0,0070 | |||
| CBOE / Cboe Global Markets, Inc. | 0,01 | -1,33 | 2,06 | 3,78 | 0,6484 | -0,0295 | |||
| NVDA / NVIDIA Corporation | 0,01 | -11,88 | 1,86 | 4,03 | 0,5853 | -0,0249 | |||
| MO / Altria Group, Inc. | 0,03 | 0,37 | 1,79 | 13,11 | 0,5628 | 0,0229 | |||
| GOOG / Alphabet Inc. | 0,01 | 0,00 | 1,71 | 37,27 | 0,5386 | 0,1130 | |||
| D / Dominion Energy, Inc. | 0,03 | -1,20 | 1,65 | 6,93 | 0,5207 | -0,0076 | |||
| JPM / JPMorgan Chase & Co. | 0,00 | -0,90 | 1,53 | 7,82 | 0,4822 | -0,0030 | |||
| NOW / ServiceNow, Inc. | 0,00 | 0,00 | 1,52 | -10,46 | 0,4798 | -0,1017 | |||
| VTV / Vanguard Index Funds - Vanguard Value ETF | 0,01 | -0,09 | 1,49 | 5,39 | 0,4684 | -0,0136 | |||
| NSC / Norfolk Southern Corporation | 0,00 | 0,00 | 1,44 | 17,36 | 0,4539 | 0,0343 | |||
| XOM / Exxon Mobil Corporation | 0,01 | 0,00 | 1,37 | 4,60 | 0,4303 | -0,0160 | |||
| MCD / McDonald's Corporation | 0,00 | 0,00 | 1,30 | 4,01 | 0,4092 | -0,0176 | |||
| BRK.B / Berkshire Hathaway Inc. | 0,00 | 0,00 | 1,30 | 3,51 | 0,4083 | -0,0197 | |||
| DUK / Duke Energy Corporation | 0,01 | -2,04 | 1,27 | 2,66 | 0,4017 | -0,0225 | |||
| MDLZ / Mondelez International, Inc. | 0,02 | 0,00 | 1,15 | -7,41 | 0,3622 | -0,0620 | |||
| ALB / Albemarle Corporation | 0,01 | 0,00 | 1,10 | 29,36 | 0,3457 | 0,0558 | |||
| PEP / PepsiCo, Inc. | 0,01 | -0,76 | 1,06 | 5,59 | 0,3334 | -0,0093 | |||
| VTEB / Vanguard Municipal Bond Funds - Vanguard Tax-Exempt Bond ETF | 0,02 | -6,88 | 1,01 | -4,88 | 0,3195 | -0,0450 | |||
| KEYS / Keysight Technologies, Inc. | 0,01 | 0,00 | 0,96 | 6,76 | 0,3035 | -0,0050 | |||
| KO_KZ / The Coca-Cola Company | 0,01 | 0,00 | 0,95 | -6,30 | 0,3001 | -0,0472 | |||
| ZTS / Zoetis Inc. | 0,01 | 0,00 | 0,94 | -6,20 | 0,2958 | -0,0462 | |||
| GE / General Electric Company | 0,00 | 11,44 | 0,91 | 30,39 | 0,2880 | 0,0481 | |||
| MRK / Merck & Co., Inc. | 0,01 | 0,01 | 0,87 | 6,09 | 0,2746 | -0,0064 | |||
| CAT / Caterpillar Inc. | 0,00 | -1,17 | 0,81 | 21,39 | 0,2542 | 0,0272 | |||
| ORCL / Oracle Corporation | 0,00 | -0,63 | 0,80 | 27,93 | 0,2512 | 0,0380 | |||
| ITW / Illinois Tool Works Inc. | 0,00 | 0,00 | 0,76 | 5,45 | 0,2379 | -0,0068 | |||
| UNH / UnitedHealth Group Incorporated | 0,00 | 0,00 | 0,75 | 10,72 | 0,2376 | 0,0047 | |||
| IVOO / Vanguard Admiral Funds - Vanguard S&P Mid-Cap 400 ETF | 0,01 | -0,96 | 0,74 | 4,10 | 0,2323 | -0,0097 | |||
| FAST / Fastenal Company | 0,01 | 0,00 | 0,71 | 16,67 | 0,2252 | 0,0159 | |||
| BAM / Brookfield Asset Management Ltd. | 0,01 | 0,00 | 0,67 | 3,06 | 0,2121 | -0,0113 | |||
| MU / Micron Technology, Inc. | 0,00 | 0,00 | 0,65 | 35,77 | 0,2046 | 0,0411 | |||
| VTI / Vanguard Index Funds - Vanguard Total Stock Market ETF | 0,00 | 0,00 | 0,62 | 8,00 | 0,1957 | -0,0009 | |||
| UPS / United Parcel Service, Inc. | 0,01 | 0,00 | 0,61 | -17,19 | 0,1928 | -0,0600 | |||
| MKL / Markel Group Inc. | 0,00 | -0,63 | 0,60 | -4,90 | 0,1897 | -0,0267 | |||
| EMR / Emerson Electric Co. | 0,00 | 0,00 | 0,58 | -1,54 | 0,1812 | -0,0186 | |||
| BKNG / Booking Holdings Inc. | 0,00 | 0,00 | 0,56 | -6,81 | 0,1769 | -0,0289 | |||
| EFA / iShares Trust - iShares MSCI EAFE ETF | 0,01 | 0,00 | 0,55 | 4,38 | 0,1729 | -0,0067 | |||
| LLY / Eli Lilly and Company | 0,00 | 0,00 | 0,55 | -2,14 | 0,1728 | -0,0187 | |||
| NKSH / National Bankshares, Inc. | 0,02 | 0,00 | 0,53 | 8,32 | 0,1683 | -0,0004 | |||
| NVR / NVR, Inc. | 0,00 | 0,00 | 0,50 | 8,97 | 0,1569 | 0,0004 | |||
| ORLY / O'Reilly Automotive, Inc. | 0,00 | 0,00 | 0,49 | 19,76 | 0,1549 | 0,0144 | |||
| VSMS.X / Vanguard Admiral Funds - Vanguard S&P Small-Cap 600 ETF | 0,00 | -0,65 | 0,49 | 8,44 | 0,1538 | -0,0001 | |||
| CVX / Chevron Corporation | 0,00 | 0,00 | 0,47 | 8,58 | 0,1475 | -0,0001 | |||
| CHKP / Check Point Software Technologies Ltd. | 0,00 | 44,46 | 0,46 | 35,19 | 0,1453 | 0,0286 | |||
| TFC / Truist Financial Corporation | 0,01 | 0,00 | 0,46 | 6,48 | 0,1450 | -0,0029 | |||
| SYY / Sysco Corporation | 0,01 | 0,00 | 0,45 | 8,63 | 0,1429 | 0,0003 | |||
| GIS / General Mills, Inc. | 0,01 | -2,68 | 0,45 | -5,29 | 0,1412 | -0,0205 | |||
| LIN / Linde plc | 0,00 | 0,00 | 0,44 | 1,38 | 0,1390 | -0,0100 | |||
| ELV / Elevance Health, Inc. | 0,00 | -0,59 | 0,44 | -17,42 | 0,1376 | -0,0432 | |||
| AEP / American Electric Power Company, Inc. | 0,00 | -1,04 | 0,41 | 7,11 | 0,1285 | -0,0014 | |||
| NEE / NextEra Energy, Inc. | 0,01 | 0,00 | 0,40 | 8,67 | 0,1265 | 0,0003 | |||
| GEV / GE Vernova Inc. | 0,00 | 0,00 | 0,36 | 16,29 | 0,1149 | 0,0076 | |||
| DOV / Dover Corporation | 0,00 | 0,00 | 0,36 | -9,02 | 0,1146 | -0,0220 | |||
| AMZN / Amazon.com, Inc. | 0,00 | 0,00 | 0,36 | 0,00 | 0,1146 | -0,0096 | |||
| WMT / Walmart Inc. | 0,00 | -1,67 | 0,36 | 3,71 | 0,1146 | -0,0054 | |||
| UVV / Universal Corporation | 0,01 | 0,00 | 0,36 | -4,26 | 0,1137 | -0,0149 | |||
| ADI / Analog Devices, Inc. | 0,00 | 0,00 | 0,36 | 3,20 | 0,1121 | -0,0057 | |||
| AMGN / Amgen Inc. | 0,00 | 0,00 | 0,35 | 1,15 | 0,1113 | -0,0082 | |||
| VEEV / Veeva Systems Inc. | 0,00 | 0,00 | 0,34 | 3,35 | 0,1071 | -0,0052 | |||
| COF / Capital One Financial Corporation | 0,00 | 0,00 | 0,33 | 0,00 | 0,1031 | -0,0089 | |||
| SHW / The Sherwin-Williams Company | 0,00 | 0,00 | 0,33 | 0,93 | 0,1029 | -0,0078 | |||
| OKE / ONEOK, Inc. | 0,00 | 0,00 | 0,30 | -10,71 | 0,0948 | -0,0202 | |||
| V / Visa Inc. | 0,00 | 0,00 | 0,30 | -3,57 | 0,0936 | -0,0120 | |||
| MMM / 3M Company | 0,00 | 0,00 | 0,29 | 1,74 | 0,0922 | -0,0059 | |||
| WSO / Watsco, Inc. | 0,00 | 0,00 | 0,29 | -8,46 | 0,0922 | -0,0171 | |||
| PAYC / Paycom Software, Inc. | 0,00 | 0,00 | 0,29 | -9,97 | 0,0912 | -0,0188 | |||
| CHH / Choice Hotels International, Inc. | 0,00 | -13,54 | 0,28 | -27,20 | 0,0888 | -0,0435 | |||
| FTNT / Fortinet, Inc. | 0,00 | 0,00 | 0,26 | -20,67 | 0,0825 | -0,0300 | |||
| HRB / H&R Block, Inc. | 0,00 | 0,00 | 0,25 | -7,72 | 0,0792 | -0,0141 | |||
| TXN / Texas Instruments Incorporated | 0,00 | 0,00 | 0,24 | -11,28 | 0,0744 | -0,0168 | |||
| NEU / NewMarket Corporation | 0,00 | 0,23 | 0,0718 | 0,0718 | |||||
| SBUX / Starbucks Corporation | 0,00 | -6,18 | 0,22 | -13,31 | 0,0679 | -0,0172 | |||
| TFI / SPDR Series Trust - State Street SPDR Nuveen ICE Municipal Bond ETF | 0,00 | 0,00 | 0,21 | 2,42 | 0,0668 | -0,0042 | |||
| IBM / International Business Machines Corporation | 0,00 | 0,00 | 0,21 | -4,09 | 0,0666 | -0,0089 | |||
| HD / The Home Depot, Inc. | 0,00 | -6,50 | 0,21 | 2,96 | 0,0661 | -0,0033 | |||
| SO / The Southern Company | 0,00 | -3,08 | 0,21 | 0,00 | 0,0657 | -0,0056 | |||
| TDG / TransDigm Group Incorporated | 0,00 | 0,00 | 0,21 | -13,33 | 0,0656 | -0,0165 | |||
| HSY / The Hershey Company | 0,00 | 0,21 | 0,0655 | 0,0655 | |||||
| CAH / Cardinal Health, Inc. | 0,00 | -3,03 | 0,20 | -9,05 | 0,0633 | -0,0125 | |||
| NBB / Nuveen Taxable Municipal Income Fund | 0,01 | 0,00 | 0,18 | 2,81 | 0,0577 | -0,0034 | |||
| KMB / Kimberly-Clark Corporation | 0,00 | -100,00 | 0,00 | 0,0000 | |||||
| QQQM / Invesco Exchange-Traded Fund Trust II - Invesco NASDAQ 100 ETF | 0,00 | -100,00 | 0,00 | 0,0000 | |||||
| CHD / Church & Dwight Co., Inc. | 0,00 | -100,00 | 0,00 | 0,0000 | |||||
| KMX / CarMax, Inc. | 0,00 | -100,00 | 0,00 | 0,0000 |