Basisstatistiken
| Manager | Jeff Ubben |
| Insider-Profil | ValueAct Holdings, L.P. |
| Portfolio-Wert | $ 5.929.591.152 |
| Aktuelle Positionen | 16 |
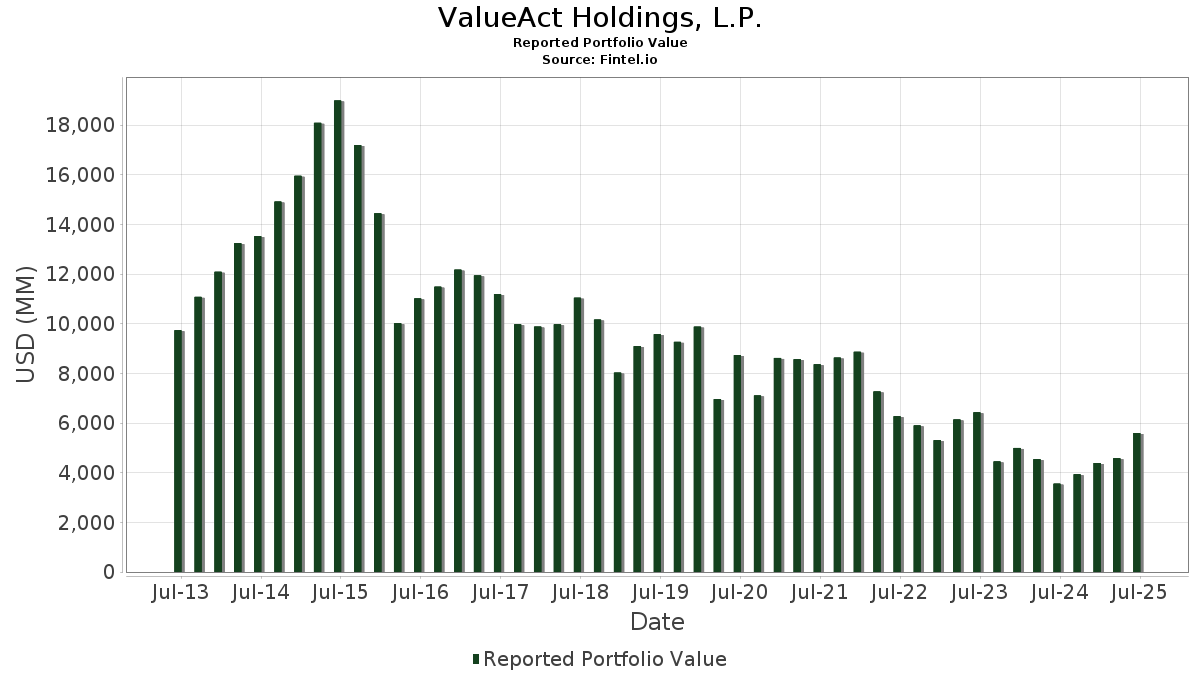
Neueste Bestände, Performance, AUM (aus 13F, 13D)
ValueAct Holdings, L.P. hat 16 Gesamtbeteiligungen in seinen letzten SEC-Einreichungen offengelegt. Der/die Portfoliomanager sind als Jeff Ubben aufgeführt. Der jüngste Portfoliowert wird auf $ 5.929.591.152 USD berechnet. Das tatsächliche verwaltete Vermögen (AUM) ist dieser Wert plus Barmittel (die nicht offengelegt werden). ValueAct Holdings, L.P.s Top-Bestände sind Amazon.com, Inc. (US:AMZN) , Salesforce, Inc. (US:CRM) , Roblox Corporation (US:RBLX) , Meta Platforms, Inc. (US:META) , and Visa Inc. (US:V) .
Top-Zuwächse in diesem Quartal
Wir verwenden die Veränderung der Portfolioallokation, weil dies die aussagekräftigste Kennzahl ist. Die Änderungen können auf Trades oder Änderungen der Aktienkurse zurückzuführen sein.
| Wertpapier | Aktien (MM) |
Wert (MM$) |
Portfolio % | ΔPortfolio % |
|---|---|---|---|---|
| RKT / Rocket Companies, Inc. | 25,40 | 492,17 | 8,3002 | 4,4697 |
| MDB / MongoDB, Inc. | 2,12 | 367,19 | 6,1925 | 3,6030 |
| TOST / Toast, Inc. | 3,40 | 124,03 | 2,0917 | 2,0917 |
| META / Meta Platforms, Inc. | 0,77 | 564,50 | 9,5200 | 1,3028 |
| V / Visa Inc. | 1,57 | 534,55 | 9,0150 | 1,1208 |
| RBLX / Roblox Corporation | 4,28 | 593,31 | 10,0059 | 1,1154 |
| COOP / Mr. Cooper Group Inc. | 0,90 | 190,72 | 3,2165 | 0,8054 |
| LLYVA / Liberty Live Holdings, Inc. | 1,72 | 162,15 | 2,7346 | 0,2177 |
Top-Rückgänge in diesem Quartal
Wir verwenden die Veränderung der Portfolioallokation, weil dies die aussagekräftigste Kennzahl ist. Änderungen können auf Handelsgeschäfte oder Änderungen der Aktienkurse zurückzuführen sein.
| Wertpapier | Aktien (MM) |
Wert (MM$) |
Portfolio % | ΔPortfolio % |
|---|---|---|---|---|
| DIS / The Walt Disney Company | 4,39 | 502,88 | 8,4808 | -2,7870 |
| NSIT / Insight Enterprises, Inc. | 2,27 | 257,64 | 4,3450 | -2,7124 |
| CRM / Salesforce, Inc. | 2,90 | 686,95 | 11,5851 | -2,5308 |
| AMZN / Amazon.com, Inc. | 3,50 | 768,60 | 12,9622 | -2,2109 |
| RDFN / Redfin Corporation | 0,00 | 0,00 | -1,1602 | |
| CBRE / CBRE Group, Inc. | 0,23 | 36,96 | 0,6234 | -0,8516 |
| LYV / Live Nation Entertainment, Inc. | 0,64 | 104,72 | 1,7660 | -0,6258 |
| SSD / Simpson Manufacturing Co., Inc. | 1,21 | 202,28 | 3,4114 | -0,4888 |
| CCC / CCC Intelligent Solutions Holdings Inc. | 0,00 | 0,00 | -0,4843 | |
| LLYVK / Liberty Live Holdings, Inc. | 3,52 | 340,94 | 5,7497 | -0,0364 |
13F und Fondseinreichungen
Dieses Formular wurde am 2025-11-14 für den Berichtszeitraum eingereicht 2025-09-30. Klicken Sie auf das Link-Symbol , um den gesamten Transaktionsverlauf zu sehen.
Upgrade um die Prämiendaten zu entsperren und nach Excel zu exportieren ![]() .
.
| Wertpapier | Typ | Durchschnittlicher Aktienkurs | Aktien (MM) |
ΔAktien (%) |
Wert ($MM) |
ΔAktien (%) |
Portfolio (%) |
ΔPortfolio (%) |
|
|---|---|---|---|---|---|---|---|---|---|
| AMZN / Amazon.com, Inc. | 3,50 | -9,61 | 768,60 | -9,53 | 12,9622 | -2,2109 | |||
| CRM / Salesforce, Inc. | 2,90 | 0,00 | 686,95 | -13,09 | 11,5851 | -2,5308 | |||
| RBLX / Roblox Corporation | 4,28 | -9,48 | 593,31 | 19,18 | 10,0059 | 1,1154 | |||
| META / Meta Platforms, Inc. | 0,77 | 23,31 | 564,50 | 22,69 | 9,5200 | 1,3028 | |||
| V / Visa Inc. | 1,57 | 25,78 | 534,55 | 20,93 | 9,0150 | 1,1208 | |||
| DIS / The Walt Disney Company | 4,39 | -13,67 | 502,88 | -20,29 | 8,4808 | -2,7870 | |||
| RKT / Rocket Companies, Inc. | 25,40 | 67,90 | 492,17 | 129,47 | 8,3002 | 4,4697 | |||
| MDB / MongoDB, Inc. | 2,12 | 206,76 | 367,19 | 153,24 | 6,1925 | 3,6030 | |||
| LLYVK / Liberty Live Holdings, Inc. | 3,52 | -11,92 | 340,94 | 5,23 | 5,7497 | -0,0364 | |||
| NSIT / Insight Enterprises, Inc. | 2,27 | -20,62 | 257,64 | -34,80 | 4,3450 | -2,7124 | |||
| SSD / Simpson Manufacturing Co., Inc. | 1,21 | -14,09 | 202,28 | -7,37 | 3,4114 | -0,4888 | |||
| COOP / Mr. Cooper Group Inc. | 0,90 | 0,00 | 190,72 | 41,27 | 3,2165 | 0,8054 | |||
| LLYVA / Liberty Live Holdings, Inc. | 1,72 | -3,02 | 162,15 | 15,06 | 2,7346 | 0,2177 | |||
| TOST / Toast, Inc. | 3,40 | 124,03 | 2,0917 | 2,0917 | |||||
| LYV / Live Nation Entertainment, Inc. | 0,64 | -27,61 | 104,72 | -21,81 | 1,7660 | -0,6258 | |||
| CBRE / CBRE Group, Inc. | 0,23 | -60,20 | 36,96 | -55,24 | 0,6234 | -0,8516 | |||
| CCC / CCC Intelligent Solutions Holdings Inc. | 0,00 | -100,00 | 0,00 | -100,00 | -0,4843 | ||||
| RDFN / Redfin Corporation | 0,00 | -100,00 | 0,00 | -100,00 | -1,1602 | ||||
| EXPE / Expedia Group, Inc. | 0,00 | -100,00 | 0,00 | 0,0000 |