Basisstatistiken
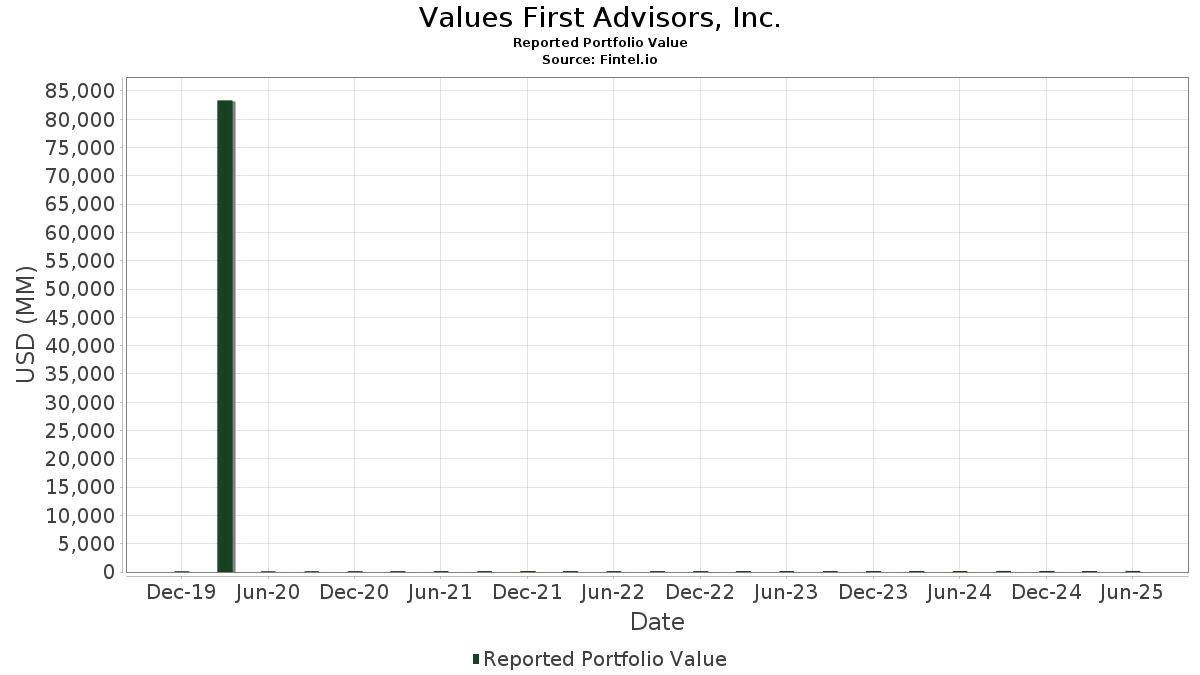
| Portfolio-Wert | $ 186.839.226 |
| Aktuelle Positionen | 171 |
Neueste Bestände, Performance, AUM (aus 13F, 13D)
Values First Advisors, Inc. hat 171 Gesamtbeteiligungen in seinen letzten SEC-Einreichungen offengelegt. Der jüngste Portfoliowert wird auf $ 186.839.226 USD berechnet. Das tatsächliche verwaltete Vermögen (AUM) ist dieser Wert plus Barmittel (die nicht offengelegt werden). Values First Advisors, Inc.s Top-Bestände sind Vanguard Scottsdale Funds - Vanguard Short-Term Treasury ETF (US:VGSH) , iShares Trust - iShares 1-3 Year Treasury Bond ETF (US:SHY) , iShares Trust - iShares Core 1-5 Year USD Bond ETF (US:ISTB) , iShares Trust - iShares 3-7 Year Treasury Bond ETF (US:IEI) , and iShares Trust - iShares 7-10 Year Treasury Bond ETF (US:IEF) . Values First Advisors, Inc.s neue Positionen sind Talen Energy Corporation (US:TLN) , Unified Series Trust - OneAscent International Equity ETF (US:OAIM) , Medtronic plc (US:MDT) , Unified Series Trust - Oneascent Large Cap Core ETF (US:OALC) , and .
Top-Zuwächse in diesem Quartal
Wir verwenden die Veränderung der Portfolioallokation, weil dies die aussagekräftigste Kennzahl ist. Die Änderungen können auf Trades oder Änderungen der Aktienkurse zurückzuführen sein.
| Wertpapier | Aktien (MM) |
Wert (MM$) |
Portfolio % | ΔPortfolio % |
|---|---|---|---|---|
| BIL / SPDR Series Trust - State Street SPDR Bloomberg 1-3 Month T-Bill ETF | 0,04 | 3,47 | 1,8585 | 1,0177 |
| EBS / Emergent BioSolutions Inc. | 0,37 | 3,25 | 1,7368 | 0,4302 |
| CGNX / Cognex Corporation | 0,06 | 2,79 | 1,4955 | 0,4195 |
| MPWR / Monolithic Power Systems, Inc. | 0,00 | 3,09 | 1,6543 | 0,2953 |
| APH / Amphenol Corporation | 0,02 | 2,70 | 1,4463 | 0,2575 |
| ALNY / Alnylam Pharmaceuticals, Inc. | 0,00 | 1,77 | 0,9473 | 0,2463 |
| TLN / Talen Energy Corporation | 0,00 | 0,44 | 0,2370 | 0,2370 |
| HWKN / Hawkins, Inc. | 0,01 | 2,16 | 1,1562 | 0,2246 |
| MIRM / Mirum Pharmaceuticals, Inc. | 0,02 | 1,37 | 0,7342 | 0,1900 |
| ELAN / Elanco Animal Health Incorporated | 0,05 | 1,07 | 0,5731 | 0,1517 |
Top-Rückgänge in diesem Quartal
Wir verwenden die Veränderung der Portfolioallokation, weil dies die aussagekräftigste Kennzahl ist. Änderungen können auf Handelsgeschäfte oder Änderungen der Aktienkurse zurückzuführen sein.
| Wertpapier | Aktien (MM) |
Wert (MM$) |
Portfolio % | ΔPortfolio % |
|---|---|---|---|---|
| MINT / PIMCO ETF Trust - PIMCO Enhanced Short Maturity Active Exchange-Traded Fund | 0,04 | 4,35 | 0,9051 | -4,1669 |
| VGSH / Vanguard Scottsdale Funds - Vanguard Short-Term Treasury ETF | 0,15 | 9,02 | 1,8769 | -2,2096 |
| ISTB / iShares Trust - iShares Core 1-5 Year USD Bond ETF | 0,13 | 6,37 | 1,3263 | -2,0593 |
| IEI / iShares Trust - iShares 3-7 Year Treasury Bond ETF | 0,04 | 5,17 | 1,0747 | -1,6509 |
| IEF / iShares Trust - iShares 7-10 Year Treasury Bond ETF | 0,05 | 5,12 | 1,0657 | -1,6439 |
| VRNA / Verona Pharma plc - Depositary Receipt (Common Stock) | 0,00 | 0,00 | -1,3219 | |
| BMI / Badger Meter, Inc. | 0,01 | 1,35 | 0,2810 | -0,7436 |
| HCKT / The Hackett Group, Inc. | 0,07 | 1,25 | 0,2607 | -0,6575 |
| SRCE / 1st Source Corporation | 0,03 | 1,79 | 0,3727 | -0,6154 |
| TECH / Bio-Techne Corporation | 0,04 | 1,98 | 0,4113 | -0,6000 |
13F und Fondseinreichungen
Dieses Formular wurde am 2025-10-21 für den Berichtszeitraum eingereicht 2025-09-30. Klicken Sie auf das Link-Symbol , um den gesamten Transaktionsverlauf zu sehen.
Upgrade um die Prämiendaten zu entsperren und nach Excel zu exportieren ![]() .
.
| Wertpapier | Typ | Durchschnittlicher Aktienkurs | Aktien (MM) |
ΔAktien (%) |
Wert ($MM) |
ΔAktien (%) |
Portfolio (%) |
ΔPortfolio (%) |
|
|---|---|---|---|---|---|---|---|---|---|
| VGSH / Vanguard Scottsdale Funds - Vanguard Short-Term Treasury ETF | 0,15 | 20,09 | 9,02 | 20,23 | 1,8769 | -2,2096 | |||
| SHY / iShares Trust - iShares 1-3 Year Treasury Bond ETF | 0,08 | 3,30 | 6,84 | 3,42 | 3,6597 | 0,0587 | |||
| ISTB / iShares Trust - iShares Core 1-5 Year USD Bond ETF | 0,13 | 2,15 | 6,37 | 2,56 | 1,3263 | -2,0593 | |||
| IEI / iShares Trust - iShares 3-7 Year Treasury Bond ETF | 0,04 | 2,86 | 5,17 | 3,22 | 1,0747 | -1,6509 | |||
| IEF / iShares Trust - iShares 7-10 Year Treasury Bond ETF | 0,05 | 2,22 | 5,12 | 2,96 | 1,0657 | -1,6439 | |||
| MINT / PIMCO ETF Trust - PIMCO Enhanced Short Maturity Active Exchange-Traded Fund | 0,04 | -53,36 | 4,35 | -53,29 | 0,9051 | -4,1669 | |||
| NEAR / iShares U.S. ETF Trust - iShares Short Duration Bond Active ETF | 0,08 | 2,69 | 4,33 | 3,07 | 2,3188 | 0,0290 | |||
| EGB / The Ensign Group, Inc. | 0,02 | -1,28 | 3,53 | 10,58 | 1,8910 | 0,1504 | |||
| BIL / SPDR Series Trust - State Street SPDR Bloomberg 1-3 Month T-Bill ETF | 0,04 | 124,89 | 3,47 | 125,02 | 1,8585 | 1,0177 | |||
| EBS / Emergent BioSolutions Inc. | 0,37 | -2,15 | 3,25 | 35,32 | 1,7368 | 0,4302 | |||
| SGOV / iShares Trust - iShares 0-3 Month Treasury Bond ETF | 0,03 | 153,30 | 3,20 | 153,45 | 0,6652 | -0,0222 | |||
| MPWR / Monolithic Power Systems, Inc. | 0,00 | -1,58 | 3,09 | 23,85 | 1,6543 | 0,2953 | |||
| CGNX / Cognex Corporation | 0,06 | -0,96 | 2,79 | 41,47 | 1,4955 | 0,4195 | |||
| APH / Amphenol Corporation | 0,02 | -1,20 | 2,70 | 23,83 | 1,4463 | 0,2575 | |||
| LOW / Lowe's Companies, Inc. | 0,01 | -1,10 | 2,63 | 12,04 | 1,4093 | 0,1290 | |||
| MCHP / Microchip Technology Incorporated | 0,04 | -0,47 | 2,42 | -9,18 | 1,2971 | -0,1561 | |||
| NNN / NNN REIT, Inc. | 0,06 | 0,75 | 2,41 | -0,66 | 1,2894 | -0,0317 | |||
| GNTX / Gentex Corporation | 0,08 | -0,55 | 2,28 | 27,99 | 0,4748 | -0,4964 | |||
| DCI / Donaldson Company, Inc. | 0,03 | -0,28 | 2,17 | 17,73 | 0,4505 | -0,5515 | |||
| HWKN / Hawkins, Inc. | 0,01 | -1,78 | 2,16 | 26,32 | 1,1562 | 0,2246 | |||
| XMTR / Xometry, Inc. | 0,04 | -4,32 | 2,15 | 54,23 | 0,4474 | -0,3119 | |||
| MAA / Mid-America Apartment Communities, Inc. | 0,02 | 0,47 | 2,14 | -5,15 | 1,1440 | -0,0835 | |||
| LOPE / Grand Canyon Education, Inc. | 0,01 | -1,00 | 2,06 | 14,96 | 0,4288 | -0,5473 | |||
| AFG / American Financial Group, Inc. | 0,01 | -0,39 | 2,01 | 15,01 | 0,4179 | -0,5334 | |||
| EXPD / Expeditors International of Washington, Inc. | 0,02 | -1,03 | 2,00 | 6,16 | 1,0703 | 0,0446 | |||
| TECH / Bio-Techne Corporation | 0,04 | -1,54 | 1,98 | 6,47 | 0,4113 | -0,6000 | |||
| NVDD / Direxion Shares ETF Trust - Direxion Daily NVDA Bear 1X Shares | 0,01 | -2,36 | 1,96 | 15,30 | 1,0485 | 0,1231 | |||
| GH / Guardant Health, Inc. | 0,03 | -4,60 | 1,94 | 14,53 | 1,0381 | 0,1157 | |||
| CINF / Cincinnati Financial Corporation | 0,01 | -0,49 | 1,92 | 5,60 | 1,0292 | 0,0378 | |||
| GEV / GE Vernova Inc. | 0,00 | -2,94 | 1,91 | 12,77 | 0,3969 | -0,5243 | |||
| TT / Trane Technologies plc | 0,00 | 2,32 | 1,90 | -1,30 | 1,0151 | -0,0314 | |||
| TTC / The Toro Company | 0,02 | -0,52 | 1,89 | 7,22 | 1,0103 | 0,0516 | |||
| TLH / iShares Trust - iShares 10-20 Year Treasury Bond ETF | 0,02 | 2,34 | 1,88 | 3,74 | 1,0085 | 0,0192 | |||
| TLT / iShares Trust - iShares 20+ Year Treasury Bond ETF | 0,02 | 2,18 | 1,87 | 3,43 | 1,0002 | 0,0165 | |||
| LMAT / LeMaitre Vascular, Inc. | 0,02 | -0,80 | 1,85 | 4,51 | 0,3857 | -0,5802 | |||
| GGG / Graco Inc. | 0,02 | -0,73 | 1,81 | -1,90 | 0,9690 | -0,0362 | |||
| ROL / Rollins, Inc. | 0,03 | -0,69 | 1,79 | 3,40 | 0,9599 | 0,0151 | |||
| SRCE / 1st Source Corporation | 0,03 | -0,43 | 1,79 | -1,27 | 0,3727 | -0,6154 | |||
| EOG / EOG Resources, Inc. | 0,02 | -0,28 | 1,79 | -6,53 | 0,9575 | -0,0850 | |||
| ALNY / Alnylam Pharmaceuticals, Inc. | 0,00 | -1,65 | 1,77 | 37,53 | 0,9473 | 0,2463 | |||
| EGY / VAALCO Energy, Inc. | 0,41 | -0,75 | 1,66 | 10,51 | 0,8891 | 0,0704 | |||
| ORLY / O'Reilly Automotive, Inc. | 0,01 | 1,58 | 1,49 | 21,50 | 0,7954 | 0,1292 | |||
| FIZZ / National Beverage Corp. | 0,04 | -1,05 | 1,47 | -15,49 | 0,7884 | -0,1613 | |||
| SKT / Tanger Inc. | 0,04 | 0,11 | 1,45 | 10,78 | 0,7759 | 0,0631 | |||
| BILS / SPDR Series Trust - State Street SPDR Bloomberg 3-12 Month T-Bill ETF | 0,01 | 2,14 | 1,40 | 2,27 | 0,2911 | -0,4544 | |||
| MIRM / Mirum Pharmaceuticals, Inc. | 0,02 | -4,69 | 1,37 | 37,24 | 0,7342 | 0,1900 | |||
| BMI / Badger Meter, Inc. | 0,01 | -1,51 | 1,35 | -28,23 | 0,2810 | -0,7436 | |||
| HCKT / The Hackett Group, Inc. | 0,07 | -0,59 | 1,25 | -25,64 | 0,2607 | -0,6575 | |||
| ROP / Roper Technologies, Inc. | 0,00 | -2,93 | 1,24 | -14,62 | 0,6629 | -0,1270 | |||
| TOST / Toast, Inc. | 0,03 | -3,81 | 1,15 | -20,74 | 0,6181 | -0,1752 | |||
| LRCX / Lam Research Corporation | 0,01 | -4,36 | 1,13 | 31,66 | 0,6056 | 0,1372 | |||
| WELL / Welltower Inc. | 0,01 | 1,01 | 1,11 | 16,98 | 0,2309 | -0,2855 | |||
| AXP / American Express Company | 0,00 | 18,60 | 1,10 | 23,57 | 0,2292 | -0,2566 | |||
| IRTC / iRhythm Holdings, Inc. | 0,01 | -4,54 | 1,07 | 6,67 | 0,5734 | 0,0263 | |||
| ELAN / Elanco Animal Health Incorporated | 0,05 | -1,87 | 1,07 | 38,42 | 0,5731 | 0,1517 | |||
| LQDT / Liquidity Services, Inc. | 0,04 | -1,86 | 1,00 | 14,04 | 0,5351 | 0,0579 | |||
| AVGO / Broadcom Inc. | 0,00 | -0,63 | 0,99 | 19,01 | 0,2058 | -0,2473 | |||
| DHI / D.R. Horton, Inc. | 0,01 | -5,21 | 0,97 | 24,61 | 0,2014 | -0,2217 | |||
| LIN / Linde plc | 0,00 | -1,46 | 0,96 | -0,31 | 0,5132 | -0,0103 | |||
| URI / United Rentals, Inc. | 0,00 | -4,32 | 0,93 | 21,25 | 0,4978 | 0,0800 | |||
| SPGI / S&P Global Inc. | 0,00 | -1,40 | 0,92 | -9,07 | 0,4939 | -0,0584 | |||
| ODFL / Old Dominion Freight Line, Inc. | 0,01 | -3,03 | 0,92 | -15,86 | 0,4915 | -0,1032 | |||
| VST / Vistra Corp. | 0,00 | -4,53 | 0,92 | -3,47 | 0,4909 | -0,0267 | |||
| SLP / Simulations Plus, Inc. | 0,06 | -1,59 | 0,85 | -15,08 | 0,4554 | -0,0899 | |||
| OHI / Omega Healthcare Investors, Inc. | 0,02 | 2,14 | 0,85 | 17,64 | 0,4538 | 0,0613 | |||
| BBNX / Beta Bionics, Inc. | 0,04 | -4,93 | 0,80 | 29,89 | 0,1673 | -0,1703 | |||
| INSM / Insmed Incorporated | 0,01 | -4,29 | 0,79 | 37,11 | 0,4213 | 0,1082 | |||
| CHWY / Chewy, Inc. | 0,02 | 38,47 | 0,78 | 31,31 | 0,1624 | -0,1611 | |||
| MTD / Mettler-Toledo International Inc. | 0,00 | -3,83 | 0,77 | 0,65 | 0,4123 | -0,0049 | |||
| CSV / Carriage Services, Inc. | 0,02 | -1,64 | 0,77 | -4,25 | 0,4105 | -0,0257 | |||
| EXEL / Exelixis, Inc. | 0,02 | -1,88 | 0,73 | -8,05 | 0,1522 | -0,2811 | |||
| RBA / RB Global, Inc. | 0,01 | -4,66 | 0,72 | -2,72 | 0,3835 | -0,0176 | |||
| WMB / The Williams Companies, Inc. | 0,01 | -0,76 | 0,72 | 0,14 | 0,3832 | -0,0064 | |||
| SRRK / Scholar Rock Holding Corporation | 0,02 | -4,83 | 0,71 | 0,14 | 0,3817 | -0,0065 | |||
| SO / The Southern Company | 0,01 | 0,47 | 0,71 | 3,82 | 0,1471 | -0,2243 | |||
| WCN / Waste Connections, Inc. | 0,00 | -4,45 | 0,69 | -9,97 | 0,3676 | -0,0475 | |||
| NLY / Annaly Capital Management, Inc. | 0,03 | 3,82 | 0,67 | 11,58 | 0,1384 | -0,1866 | |||
| VMC / Vulcan Materials Company | 0,00 | -3,71 | 0,66 | 13,38 | 0,3542 | 0,0367 | |||
| TMDX / TransMedics Group, Inc. | 0,01 | -4,70 | 0,66 | -20,22 | 0,3506 | -0,0966 | |||
| DG / Dollar General Corporation | 0,01 | -1,35 | 0,65 | -10,82 | 0,3487 | -0,0494 | |||
| INTU / Intuit Inc. | 0,00 | -1,05 | 0,64 | -14,27 | 0,1339 | -0,2750 | |||
| DDOG / Datadog, Inc. | 0,00 | -4,37 | 0,64 | 1,26 | 0,3435 | -0,0014 | |||
| COLL / Collegium Pharmaceutical, Inc. | 0,02 | -4,68 | 0,62 | 12,84 | 0,3293 | 0,0322 | |||
| NEOG / Neogen Corporation | 0,11 | -1,99 | 0,62 | 17,14 | 0,3292 | 0,0431 | |||
| KIM / Kimco Realty Corporation | 0,03 | 1,66 | 0,60 | 5,61 | 0,3227 | 0,0119 | |||
| RPRX / Royalty Pharma plc | 0,02 | 11,20 | 0,60 | 8,86 | 0,1254 | -0,1761 | |||
| GBX / The Greenbrier Companies, Inc. | 0,01 | -0,91 | 0,60 | -0,66 | 0,1250 | -0,2044 | |||
| AXSM / Axsome Therapeutics, Inc. | 0,00 | -4,44 | 0,59 | 11,07 | 0,1234 | -0,1671 | |||
| GLBE / Global-E Online Ltd. | 0,02 | -4,15 | 0,57 | 2,17 | 0,1178 | -0,1840 | |||
| NTNX / Nutanix, Inc. | 0,01 | -3,76 | 0,57 | -6,46 | 0,1178 | -0,2113 | |||
| LSCC / Lattice Semiconductor Corporation | 0,01 | -3,67 | 0,56 | 44,07 | 0,1165 | -0,0950 | |||
| AXON / Axon Enterprise, Inc. | 0,00 | -4,66 | 0,56 | -17,36 | 0,1161 | -0,2514 | |||
| NOW / ServiceNow, Inc. | 0,00 | 23,40 | 0,55 | 10,48 | 0,1142 | -0,1560 | |||
| UA / Under Armour, Inc. | 0,11 | -2,06 | 0,55 | -27,10 | 0,2924 | -0,1158 | |||
| INOD / Innodata Inc. | 0,01 | -1,62 | 0,54 | 48,22 | 0,2897 | 0,0905 | |||
| SHW / The Sherwin-Williams Company | 0,00 | -1,53 | 0,53 | -0,74 | 0,2861 | -0,0072 | |||
| EXR / Extra Space Storage Inc. | 0,00 | 1,64 | 0,53 | -2,91 | 0,2856 | -0,0136 | |||
| PANW / Palo Alto Networks, Inc. | 0,00 | 41,71 | 0,53 | 40,96 | 0,2840 | 0,0791 | |||
| SITM / SiTime Corporation | 0,00 | -4,05 | 0,53 | 35,73 | 0,2829 | 0,0706 | |||
| STAG / STAG Industrial, Inc. | 0,01 | 1,53 | 0,52 | -1,33 | 0,2788 | -0,0085 | |||
| CEG / Constellation Energy Corporation | 0,00 | -1,28 | 0,51 | 0,59 | 0,2723 | -0,0031 | |||
| ESUM / Strategy Shares - Eventide US Market ETF | 0,02 | 43,57 | 0,51 | 50,00 | 0,1057 | -0,0786 | |||
| CDNS / Cadence Design Systems, Inc. | 0,00 | -1,66 | 0,50 | 12,11 | 0,2680 | 0,0247 | |||
| BIBL / Northern Lights Fund Trust IV - Inspire 100 ETF | 0,01 | -10,89 | 0,48 | -4,17 | 0,1004 | -0,1740 | |||
| TPLC / The Timothy Plan - Timothy Plan US Large/Mid Cap Core ETF | 0,01 | 33,93 | 0,48 | 38,15 | 0,0995 | -0,0891 | |||
| ITRN / Ituran Location and Control Ltd. | 0,01 | -0,91 | 0,47 | -8,59 | 0,2507 | -0,0285 | |||
| HUBS / HubSpot, Inc. | 0,00 | -4,10 | 0,46 | -19,47 | 0,2461 | -0,0646 | |||
| LNG / Cheniere Energy, Inc. | 0,00 | -4,65 | 0,46 | -8,05 | 0,2450 | -0,0260 | |||
| TRGP / Targa Resources Corp. | 0,00 | -4,89 | 0,46 | -8,43 | 0,2444 | -0,0273 | |||
| EVH / Evolent Health, Inc. | 0,05 | -2,83 | 0,45 | -27,10 | 0,0942 | -0,2436 | |||
| CTRE / CareTrust REIT, Inc. | 0,01 | -0,79 | 0,45 | 12,37 | 0,2385 | 0,0226 | |||
| TLN / Talen Energy Corporation | 0,00 | 0,44 | 0,2370 | 0,2370 | |||||
| FAST / Fastenal Company | 0,01 | -4,55 | 0,44 | 11,45 | 0,0913 | -0,1232 | |||
| RXRX / Recursion Pharmaceuticals, Inc. | 0,09 | -1,93 | 0,44 | -5,43 | 0,2330 | -0,0177 | |||
| HD / The Home Depot, Inc. | 0,00 | -1,47 | 0,44 | 9,02 | 0,2329 | 0,0153 | |||
| MSI / Motorola Solutions, Inc. | 0,00 | -1,25 | 0,43 | 7,18 | 0,2323 | 0,0121 | |||
| FTDR / Frontdoor, Inc. | 0,01 | -4,64 | 0,42 | 8,81 | 0,0874 | -0,1228 | |||
| MG / Mistras Group, Inc. | 0,04 | -1,89 | 0,42 | 20,75 | 0,2243 | 0,0349 | |||
| WM / Waste Management, Inc. | 0,00 | -1,15 | 0,42 | -4,57 | 0,2238 | -0,0149 | |||
| WY / Weyerhaeuser Company | 0,02 | 1,37 | 0,41 | -2,15 | 0,2190 | -0,0088 | |||
| PWR / Quanta Services, Inc. | 0,00 | -3,91 | 0,41 | 5,18 | 0,0846 | -0,1258 | |||
| OLN / Olin Corporation | 0,02 | -1,16 | 0,38 | 22,90 | 0,2043 | 0,0352 | |||
| LAD / Lithia Motors, Inc. | 0,00 | -4,21 | 0,37 | -10,31 | 0,2003 | -0,0272 | |||
| SSYS / Stratasys Ltd. | 0,03 | -1,93 | 0,36 | -4,24 | 0,1937 | -0,0122 | |||
| ISRG / Intuitive Surgical, Inc. | 0,00 | -4,90 | 0,35 | -21,67 | 0,0723 | -0,1695 | |||
| MNDY / monday.com Ltd. | 0,00 | -4,13 | 0,34 | -41,00 | 0,0711 | -0,2441 | |||
| AMSF / AMERISAFE, Inc. | 0,01 | -1,06 | 0,34 | -0,87 | 0,1826 | -0,0047 | |||
| VGT / Vanguard World Fund - Vanguard Information Technology ETF | 0,00 | -19,11 | 0,34 | -8,89 | 0,0704 | -0,1319 | |||
| AJG / Arthur J. Gallagher & Co. | 0,00 | -1,64 | 0,34 | -4,83 | 0,1794 | -0,0123 | |||
| CENT / Central Garden & Pet Company | 0,01 | -1,84 | 0,33 | -8,96 | 0,0678 | -0,1270 | |||
| WDAY / Workday, Inc. | 0,00 | -41,74 | 0,32 | -41,65 | 0,0663 | -0,2306 | |||
| BRK.A / Berkshire Hathaway Inc. | 0,00 | 0,00 | 0,31 | 3,65 | 0,0650 | -0,0993 | |||
| HBAN / Huntington Bancshares Incorporated | 0,02 | -0,93 | 0,31 | 1,97 | 0,1664 | 0,0005 | |||
| TW / Tradeweb Markets Inc. | 0,00 | -4,21 | 0,31 | -27,38 | 0,0635 | -0,1655 | |||
| SHV / iShares Trust - iShares 0-1 Year Treasury Bond ETF | 0,00 | 69,46 | 0,30 | 70,06 | 0,1614 | 0,0646 | |||
| CRWD / CrowdStrike Holdings, Inc. | 0,00 | -4,34 | 0,29 | -7,91 | 0,1562 | -0,0162 | |||
| BSX / Boston Scientific Corporation | 0,00 | -5,02 | 0,29 | -13,60 | 0,1533 | -0,0274 | |||
| CYBR / CyberArk Software Ltd. | 0,00 | -2,83 | 0,28 | 15,57 | 0,0587 | -0,0744 | |||
| RELY / Remitly Global, Inc. | 0,02 | -3,80 | 0,28 | -16,37 | 0,0585 | -0,1249 | |||
| ETR / Entergy Corporation | 0,00 | -1,26 | 0,28 | 10,80 | 0,1486 | 0,0120 | |||
| LLY / Eli Lilly and Company | 0,00 | -1,65 | 0,27 | -3,55 | 0,1458 | -0,0082 | |||
| FTXP / Foothills Exploration, Inc. | 0,00 | -1,24 | 0,26 | 18,52 | 0,0535 | -0,0643 | |||
| DGII / Digi International Inc. | 0,01 | -1,85 | 0,25 | 2,43 | 0,1359 | 0,0012 | |||
| TTD / The Trade Desk, Inc. | 0,01 | -25,82 | 0,25 | -49,70 | 0,0524 | -0,2194 | |||
| GBIL / Goldman Sachs ETF Trust - Goldman Sachs Access Treasury 0-1 Year ETF | 0,00 | 19,87 | 0,24 | 19,80 | 0,0505 | -0,0596 | |||
| FERG / Ferguson Enterprises Inc. | 0,00 | -1,29 | 0,24 | 2,12 | 0,1290 | 0,0001 | |||
| COLD / Americold Realty Trust, Inc. | 0,02 | 1,57 | 0,24 | -25,23 | 0,0501 | -0,1252 | |||
| NTGR / NETGEAR, Inc. | 0,01 | -1,84 | 0,23 | 9,05 | 0,1230 | 0,0086 | |||
| ELCV / Strategy Shares - Eventide High Dividend ETF | 0,01 | 38,21 | 0,23 | 45,22 | 0,0476 | -0,0380 | |||
| OAIM / Unified Series Trust - OneAscent International Equity ETF | 0,01 | 0,22 | 0,1172 | 0,1172 | |||||
| IRDM / Iridium Communications Inc. | 0,01 | -1,51 | 0,21 | -43,16 | 0,0443 | -0,1591 | |||
| VITL / Vital Farms, Inc. | 0,01 | -4,19 | 0,21 | 2,46 | 0,1117 | 0,0006 | |||
| ROK / Rockwell Automation, Inc. | 0,00 | -3,28 | 0,21 | 1,49 | 0,1102 | 0,0000 | |||
| MDT / Medtronic plc | 0,00 | 0,20 | 0,1092 | 0,1092 | |||||
| XYL / Xylem Inc. | 0,00 | 0,20 | 0,1088 | 0,1088 | |||||
| TLF / Tandy Leather Factory, Inc. | 0,05 | -1,83 | 0,16 | -4,82 | 0,0330 | -0,0577 | |||
| DV / DoubleVerify Holdings, Inc. | 0,01 | 0,15 | 0,0318 | 0,0318 | |||||
| OALC / Unified Series Trust - Oneascent Large Cap Core ETF | 0,00 | 0,14 | 0,0745 | 0,0745 | |||||
| GIFI / Gulf Island Fabrication, Inc. | 0,02 | -1,88 | 0,13 | 4,17 | 0,0261 | -0,0398 | |||
| TPIF / The Timothy Plan - Timothy Plan International ETF | 0,00 | 34,61 | 0,09 | 39,39 | 0,0495 | 0,0133 | |||
| TLPH / Talphera, Inc. | 0,10 | -1,34 | 0,09 | 93,33 | 0,0182 | -0,0067 | |||
| LCUT / Lifetime Brands, Inc. | 0,02 | -0,99 | 0,09 | -24,56 | 0,0462 | -0,0164 | |||
| CENTA / Central Garden & Pet Company | 0,00 | -1,81 | 0,07 | -7,59 | 0,0153 | -0,0280 | |||
| TPSC / The Timothy Plan - Timothy Plan US Small Cap Core ETF | 0,00 | 25,90 | 0,07 | 34,62 | 0,0148 | -0,0138 | |||
| IBD / Northern Lights Fund Trust IV - Inspire Corporate Bond ETF | 0,00 | 961,40 | 0,06 | 1.000,00 | 0,0115 | 0,0087 | |||
| PLUR / Pluri Inc. | 0,01 | -1,79 | 0,05 | -11,67 | 0,0285 | -0,0041 | |||
| AGEN / Agenus Inc. | 0,01 | -1,81 | 0,05 | -17,74 | 0,0107 | -0,0231 | |||
| ISMD / Northern Lights Fund Trust IV - Inspire Small/Mid Cap ETF | 0,00 | 3,35 | 0,02 | 15,38 | 0,0083 | 0,0008 | |||
| VMBS / Vanguard Scottsdale Funds - Vanguard Mortgage-Backed Securities ETF | 0,00 | 0,00 | 0,00 | 0,00 | 0,0007 | -0,0011 | |||
| FLRN / SPDR Series Trust - State Street SPDR Bloomberg Investment Grade Floating Rate ETF | 0,00 | 0,00 | 0,00 | 0,0000 | -0,0001 | ||||
| VCSH / Vanguard Scottsdale Funds - Vanguard Short-Term Corporate Bond ETF | 0,00 | 0,00 | 0,00 | 0,0000 | -0,0001 | ||||
| ARGX / argenx SE - Depositary Receipt (Common Stock) | 0,00 | -100,00 | 0,00 | -100,00 | -0,3078 | ||||
| VRNA / Verona Pharma plc - Depositary Receipt (Common Stock) | 0,00 | -100,00 | 0,00 | -100,00 | -1,3219 | ||||
| SAGE / Sage Therapeutics, Inc. | 0,00 | -100,00 | 0,00 | 0,0000 | |||||
| IP / International Paper Company | 0,00 | -100,00 | 0,00 | -100,00 | -0,1758 | ||||
| CRMT / America's Car-Mart, Inc. | 0,00 | -100,00 | 0,00 | 0,0000 | |||||
| BPMC / Blueprint Medicines Corporation | 0,00 | -100,00 | 0,00 | 0,0000 | |||||
| SAP / SAP SE - Depositary Receipt (Common Stock) | 0,00 | -100,00 | 0,00 | 0,0000 | |||||
| FICO / Fair Isaac Corporation | 0,00 | -100,00 | 0,00 | 0,0000 | |||||
| AVB / AvalonBay Communities, Inc. | 0,00 | -100,00 | 0,00 | 0,0000 | |||||
| RSG / Republic Services, Inc. | 0,00 | -100,00 | 0,00 | 0,0000 | |||||
| ASML / ASML Holding N.V. - Depositary Receipt (Common Stock) | 0,00 | -100,00 | 0,00 | -100,00 | -0,4625 | ||||
| VRSK / Verisk Analytics, Inc. | 0,00 | -100,00 | 0,00 | 0,0000 | |||||
| PEG / Public Service Enterprise Group Incorporated | 0,00 | -100,00 | 0,00 | 0,0000 | |||||
| T / AT&T Inc. | 0,00 | -100,00 | 0,00 | -100,00 | -0,0094 | ||||
| UNP / Union Pacific Corporation | 0,00 | -100,00 | 0,00 | -100,00 | -0,2281 |