Basisstatistiken
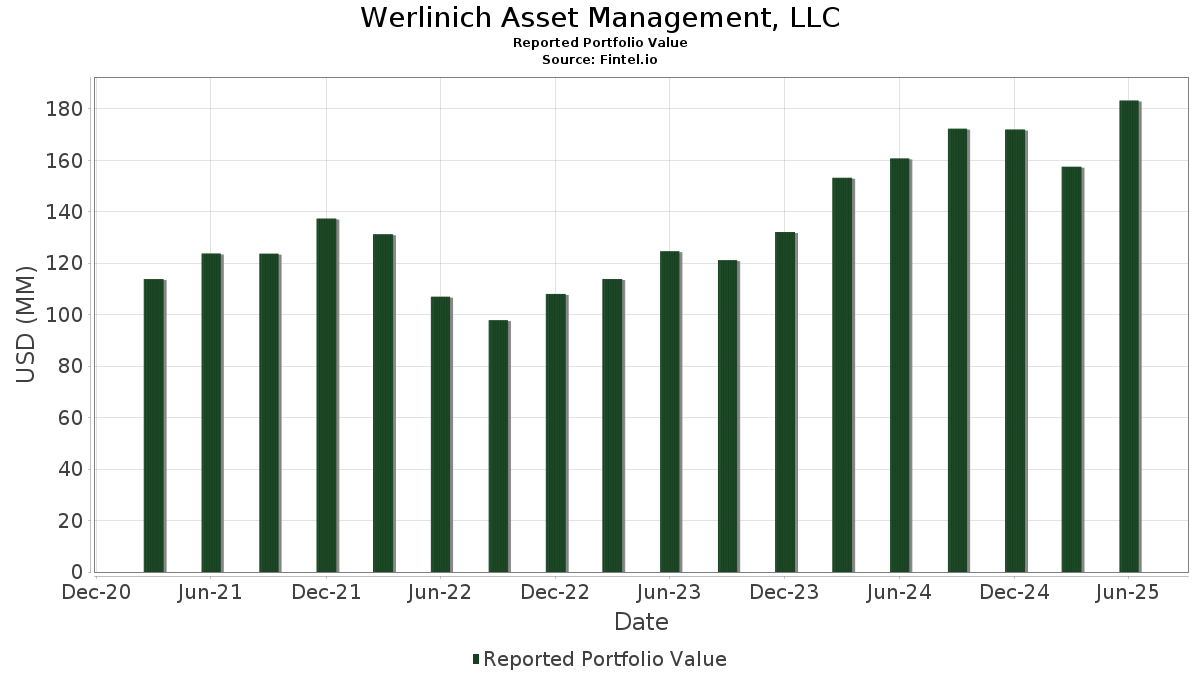
| Portfolio-Wert | $ 202.944.757 |
| Aktuelle Positionen | 59 |
Neueste Bestände, Performance, AUM (aus 13F, 13D)
Werlinich Asset Management, LLC hat 59 Gesamtbeteiligungen in seinen letzten SEC-Einreichungen offengelegt. Der jüngste Portfoliowert wird auf $ 202.944.757 USD berechnet. Das tatsächliche verwaltete Vermögen (AUM) ist dieser Wert plus Barmittel (die nicht offengelegt werden). Werlinich Asset Management, LLCs Top-Bestände sind Direxion Shares ETF Trust - Direxion Daily NVDA Bear 1X Shares (US:NVDD) , JPMorgan Chase & Co. (MX:JPM) , Hubbell Incorporated (US:HUBB) , Union Pacific Corporation (US:UNP) , and Advanced Micro Devices, Inc. (US:AMD) . Werlinich Asset Management, LLCs neue Positionen sind Ares Capital Corporation (US:ARCC) , Figure Technology Solutions, Inc. (US:FIGR) , Kratos Defense & Security Solutions, Inc. (GB:1KTOSM) , Solstice Advanced Materials, Inc. (CH:BVPC364) , and Symbotic Inc. (US:SYM) .
Top-Zuwächse in diesem Quartal
Wir verwenden die Veränderung der Portfolioallokation, weil dies die aussagekräftigste Kennzahl ist. Die Änderungen können auf Trades oder Änderungen der Aktienkurse zurückzuführen sein.
| Wertpapier | Aktien (MM) |
Wert (MM$) |
Portfolio % | ΔPortfolio % |
|---|---|---|---|---|
| AMD / Advanced Micro Devices, Inc. | 0,04 | 8,55 | 4,2151 | 1,0166 |
| MU / Micron Technology, Inc. | 0,01 | 3,13 | 1,5407 | 0,6525 |
| GOOGL / Alphabet Inc. | 0,01 | 3,76 | 1,8521 | 0,4056 |
| ARCC / Ares Capital Corporation | 0,04 | 0,77 | 0,3802 | 0,3802 |
| MRK / Merck & Co., Inc. | 0,03 | 3,06 | 1,5069 | 0,3045 |
| FIGR / Figure Technology Solutions, Inc. | 0,01 | 0,54 | 0,2663 | 0,2663 |
| 1KTOSM / Kratos Defense & Security Solutions, Inc. | 0,01 | 0,46 | 0,2282 | 0,2282 |
| BVPC364 / Solstice Advanced Materials, Inc. | 0,01 | 0,46 | 0,2257 | 0,2257 |
| GLW / Corning Incorporated | 0,07 | 6,30 | 3,1046 | 0,2128 |
| CAT / Caterpillar Inc. | 0,00 | 2,43 | 1,1998 | 0,2001 |
Top-Rückgänge in diesem Quartal
Wir verwenden die Veränderung der Portfolioallokation, weil dies die aussagekräftigste Kennzahl ist. Änderungen können auf Handelsgeschäfte oder Änderungen der Aktienkurse zurückzuführen sein.
| Wertpapier | Aktien (MM) |
Wert (MM$) |
Portfolio % | ΔPortfolio % |
|---|---|---|---|---|
| IRM / Iron Mountain Incorporated | 0,05 | 4,33 | 2,1321 | -0,4920 |
| NFLX / Netflix, Inc. | 0,03 | 3,15 | 1,5503 | -0,4481 |
| MSFT / Microsoft Corporation | 0,01 | 7,08 | 3,4890 | -0,3710 |
| BX / Blackstone Inc. | 0,04 | 5,75 | 2,8316 | -0,2994 |
| PSA / Public Storage | 0,01 | 1,85 | 0,9119 | -0,2010 |
| DELL / Dell Technologies Inc. | 0,02 | 2,71 | 1,3346 | -0,1541 |
| NOC / Northrop Grumman Corporation | 0,01 | 4,14 | 2,0379 | -0,1412 |
| COST / Costco Wholesale Corporation | 0,00 | 3,14 | 1,5458 | -0,1226 |
| ADP / Automatic Data Processing, Inc. | 0,01 | 3,37 | 1,6602 | -0,1209 |
| LMT / Lockheed Martin Corporation | 0,02 | 7,44 | 3,6646 | -0,1029 |
13F und Fondseinreichungen
Dieses Formular wurde am 2026-01-06 für den Berichtszeitraum eingereicht 2025-12-31. Klicken Sie auf das Link-Symbol , um den gesamten Transaktionsverlauf zu sehen.
Upgrade um die Prämiendaten zu entsperren und nach Excel zu exportieren ![]() .
.
| Wertpapier | Typ | Durchschnittlicher Aktienkurs | Aktien (MM) |
ΔAktien (%) |
Wert ($MM) |
ΔAktien (%) |
Portfolio (%) |
ΔPortfolio (%) |
|
|---|---|---|---|---|---|---|---|---|---|
| NVDD / Direxion Shares ETF Trust - Direxion Daily NVDA Bear 1X Shares | 0,22 | -0,14 | 40,47 | 0,37 | 19,9415 | -0,0902 | |||
| JPM / JPMorgan Chase & Co. | 0,04 | 0,11 | 11,40 | 2,64 | 5,6152 | 0,0993 | |||
| HUBB / Hubbell Incorporated | 0,02 | -2,03 | 10,80 | 1,69 | 5,3220 | 0,0448 | |||
| UNP / Union Pacific Corporation | 0,04 | 0,18 | 8,60 | -1,23 | 4,2387 | -0,0882 | |||
| AMD / Advanced Micro Devices, Inc. | 0,04 | -0,17 | 8,55 | 32,89 | 4,2151 | 1,0166 | |||
| LMT / Lockheed Martin Corporation | 0,02 | 0,33 | 7,44 | -1,93 | 3,6646 | -0,1029 | |||
| MSFT / Microsoft Corporation | 0,01 | -3,17 | 7,08 | -8,87 | 3,4890 | -0,3710 | |||
| GLW / Corning Incorporated | 0,07 | -0,07 | 6,30 | 8,25 | 3,1046 | 0,2128 | |||
| BX / Blackstone Inc. | 0,04 | 0,65 | 5,75 | -8,82 | 2,8316 | -0,2994 | |||
| SRE / Sempra | 0,05 | 0,00 | 4,79 | -0,97 | 2,3617 | -0,0434 | |||
| RTX / RTX Corporation | 0,03 | 0,00 | 4,76 | 9,98 | 2,3451 | 0,1949 | |||
| IRM / Iron Mountain Incorporated | 0,05 | 0,18 | 4,33 | -18,08 | 2,1321 | -0,4920 | |||
| NOC / Northrop Grumman Corporation | 0,01 | 0,00 | 4,14 | -5,70 | 2,0379 | -0,1412 | |||
| ABBV / AbbVie Inc. | 0,02 | 0,56 | 4,10 | -0,22 | 2,0218 | -0,0212 | |||
| AAPL / Apple Inc. | 0,01 | -0,17 | 4,01 | 7,05 | 1,9753 | 0,1150 | |||
| GOOGL / Alphabet Inc. | 0,01 | 0,00 | 3,76 | 29,10 | 1,8521 | 0,4056 | |||
| MS / Morgan Stanley | 0,02 | 0,00 | 3,59 | 12,66 | 1,7710 | 0,1859 | |||
| ADP / Automatic Data Processing, Inc. | 0,01 | 6,29 | 3,37 | -6,00 | 1,6602 | -0,1209 | |||
| JNJ / Johnson & Johnson | 0,02 | 0,00 | 3,15 | 11,61 | 1,5538 | 0,1498 | |||
| NFLX / Netflix, Inc. | 0,03 | 900,00 | 3,15 | -21,78 | 1,5503 | -0,4481 | |||
| COST / Costco Wholesale Corporation | 0,00 | -0,11 | 3,14 | -6,58 | 1,5458 | -0,1226 | |||
| MU / Micron Technology, Inc. | 0,01 | 0,00 | 3,13 | 74,93 | 1,5407 | 0,6525 | |||
| MRK / Merck & Co., Inc. | 0,03 | 0,00 | 3,06 | 26,36 | 1,5069 | 0,3045 | |||
| DELL / Dell Technologies Inc. | 0,02 | 0,18 | 2,71 | -9,61 | 1,3346 | -0,1541 | |||
| HON / Honeywell International Inc. | 0,01 | 0,68 | 2,63 | -6,12 | 1,2939 | -0,0953 | |||
| CAT / Caterpillar Inc. | 0,00 | 0,00 | 2,43 | 20,97 | 1,1998 | 0,2001 | |||
| PFE / Pfizer Inc. | 0,09 | -1,83 | 2,28 | -3,72 | 1,1218 | -0,0530 | |||
| VRT / Vertiv Holdings Co | 0,01 | 0,00 | 2,27 | 8,95 | 1,1163 | 0,0831 | |||
| ASML / ASML Holding N.V. - Depositary Receipt (Common Stock) | 0,00 | 0,00 | 2,10 | 10,75 | 1,0355 | 0,0927 | |||
| ABT / Abbott Laboratories | 0,02 | 8,87 | 1,97 | 2,23 | 0,9696 | 0,0134 | |||
| GD / General Dynamics Corporation | 0,01 | 0,00 | 1,92 | -0,47 | 0,9468 | -0,0121 | |||
| AMT / American Tower Corporation | 0,01 | 17,23 | 1,88 | 7,73 | 0,9274 | 0,0593 | |||
| ANET / Arista Networks, Inc. | 0,01 | 0,32 | 1,88 | -8,83 | 0,9257 | -0,0979 | |||
| PSA / Public Storage | 0,01 | -8,61 | 1,85 | -17,41 | 0,9119 | -0,2010 | |||
| DLR / Digital Realty Trust, Inc. | 0,01 | 13,22 | 1,66 | 2,41 | 0,8165 | 0,0127 | |||
| PANW / Palo Alto Networks, Inc. | 0,01 | 1,24 | 1,57 | -7,10 | 0,7740 | -0,0660 | |||
| AMZN / Amazon.com, Inc. | 0,01 | 0,00 | 1,56 | 5,85 | 0,7677 | 0,0368 | |||
| CRWD / CrowdStrike Holdings, Inc. | 0,00 | 0,00 | 1,25 | -3,03 | 0,6157 | -0,0244 | |||
| WM / Waste Management, Inc. | 0,01 | 16,12 | 1,20 | 16,80 | 0,5897 | 0,0806 | |||
| NSC / Norfolk Southern Corporation | 0,00 | 0,00 | 1,18 | -3,45 | 0,5802 | -0,0256 | |||
| HII / Huntington Ingalls Industries, Inc. | 0,00 | 0,00 | 1,11 | 18,80 | 0,5451 | 0,0824 | |||
| MA / Mastercard Incorporated | 0,00 | 0,00 | 0,95 | 1,50 | 0,4675 | 0,0032 | |||
| CSX / CSX Corporation | 0,03 | 0,00 | 0,91 | 2,59 | 0,4491 | 0,0076 | |||
| FTNT / Fortinet, Inc. | 0,01 | 3,00 | 0,90 | -1,65 | 0,4416 | -0,0110 | |||
| HD / The Home Depot, Inc. | 0,00 | 24,95 | 0,81 | 6,75 | 0,3975 | 0,0222 | |||
| ARCC / Ares Capital Corporation | 0,04 | 0,77 | 0,3802 | 0,3802 | |||||
| CARR / Carrier Global Corporation | 0,01 | 0,59 | 0,68 | -9,96 | 0,3343 | -0,0401 | |||
| OTIS / Otis Worldwide Corporation | 0,01 | 0,28 | 0,63 | -3,52 | 0,3112 | -0,0139 | |||
| LHX / L3Harris Technologies, Inc. | 0,00 | 0,00 | 0,56 | -3,26 | 0,2781 | -0,0117 | |||
| FIGR / Figure Technology Solutions, Inc. | 0,01 | 0,54 | 0,2663 | 0,2663 | |||||
| AWK / American Water Works Company, Inc. | 0,00 | 1,61 | 0,54 | -4,27 | 0,2655 | -0,0142 | |||
| PAYX / Paychex, Inc. | 0,00 | 1,06 | 0,54 | -9,58 | 0,2654 | -0,0306 | |||
| DGX / Quest Diagnostics Incorporated | 0,00 | 4,12 | 0,53 | -4,15 | 0,2620 | -0,0135 | |||
| 1KTOSM / Kratos Defense & Security Solutions, Inc. | 0,01 | 0,46 | 0,2282 | 0,2282 | |||||
| ORCL / Oracle Corporation | 0,00 | 0,00 | 0,46 | -29,86 | 0,2259 | -0,0989 | |||
| BVPC364 / Solstice Advanced Materials, Inc. | 0,01 | 0,46 | 0,2257 | 0,2257 | |||||
| SYM / Symbotic Inc. | 0,01 | 0,40 | 0,1985 | 0,1985 | |||||
| DHR / Danaher Corporation | 0,00 | 0,43 | 0,27 | 16,96 | 0,1330 | 0,0182 | |||
| LIN / Linde plc | 0,00 | 0,00 | 0,25 | -3,16 | 0,1211 | -0,0047 | |||
| TTD / The Trade Desk, Inc. | 0,00 | -100,00 | 0,00 | 0,0000 | |||||
| APD / Air Products and Chemicals, Inc. | 0,00 | -100,00 | 0,00 | 0,0000 | |||||
| WY / Weyerhaeuser Company | 0,00 | -100,00 | 0,00 | 0,0000 | |||||
| S / SentinelOne, Inc. | 0,00 | -100,00 | 0,00 | 0,0000 | |||||
| CRM / Salesforce, Inc. | 0,00 | -100,00 | 0,00 | 0,0000 | |||||
| ZTS / Zoetis Inc. | 0,00 | -100,00 | 0,00 | 0,0000 | |||||
| RCAT / Red Cat Holdings, Inc. | 0,00 | -100,00 | 0,00 | 0,0000 |