Anvia Holdings Corporation
Einführung
Diese Seite bietet eine umfassende Analyse des bekannten Insiderhandels von James M Cassidy. Insider sind leitende Angestellte, Direktoren oder bedeutende Investoren in einem Unternehmen. Es ist für Insider illegal, auf der Grundlage bestimmter, nicht öffentlicher Informationen mit ihren Unternehmen zu handeln. Das bedeutet nicht, dass es für sie illegal ist, irgendwelche Geschäfte in ihren eigenen Unternehmen zu tätigen. Sie müssen jedoch alle Geschäfte der SEC über ein Formular 4 melden. Trotz dieser Einschränkungen deuten akademische Untersuchungen darauf hin, dass Insider im Allgemeinen dazu neigen, den Markt in ihren eigenen Unternehmen zu übertreffen.
Durchschnittliche Handelsrentabilität
Die durchschnittliche Handelsrentabilität ist die durchschnittliche Rendite aller offenen Marktkäufe, die der Insider in den letzten drei Jahren getätigt hat. Um dies zu berechnen, untersuchen wir jeden ungeplanten Kauf, den der Insider auf dem offenen Markt getätigt hat, mit Ausnahme aller Geschäfte, die als Teil eines 10b5-1-Handelsplans gekennzeichnet waren. Anschließend berechnen wir die durchschnittliche Performance dieser Geschäfte über 3, 6 und 12 Monate, wobei wir für jeden dieser Zeiträume den Durchschnitt bilden, um eine endgültige Performance-Kennzahl für jedes Geschäft zu erhalten. Schließlich berechnen wir den Durchschnitt aller Performance-Metriken, um eine Performance-Metrik für den Insider zu ermitteln. Diese Liste enthält nur Insider, die in den letzten zwei Jahren mindestens drei Geschäfte getätigt haben.
Wenn die Handelsrentabilität dieses Insiders "N/A" ist, hat er entweder in den letzten drei Jahren keine Käufe auf dem freien Markt getätigt, oder die von ihm getätigten Geschäfte sind zu kurz her, um eine zuverlässige Performance-Kennzahl zu berechnen.
Aktualisierungshäufigkeit: Täglich
Unternehmen mit gemeldeten Insiderpositionen
Aus den SEC-Filings geht hervor, dass James M Cassidy Beteiligungen an den folgenden Unternehmen gemeldet oder mit ihnen gehandelt hat:
| Wertpapier | Titel | Letzte gemeldete Beteiligungen |
|---|---|---|
| 200.000 | ||
| 125.000 | ||
| president,CFO,secretary, Director, 10% Owner | 20.000.000 | |
| president,CFO,secretary, Director | 20.000.000 | |
| president,CFO,secretary, Director, 10% Owner | 20.000.000 | |
| president,CFO,secretary, Director, 10% Owner | 20.000.000 | |
| president,CFO,secretary, Director, 10% Owner | 20.000.000 | |
| president,CFO,secretary, Director, 10% Owner | 20.000.000 | |
| president,CFO,secretary, Director | 20.000.000 | |
| president,CFO,secretary, Director, 10% Owner | 20.000.000 | |
| president,CFO,secretary, Director, 10% Owner | 20.000.000 | |
| president,CFO,secretary, Director, 10% Owner | 20.000.000 | |
| 250.000 | ||
| 250.000 | ||
| 250.000 | ||
| US:XESP / Electronic Servitor Publication Network, Inc. | 0 | |
| US:NBND / NetBrands Corp. | president, Director, 10% Owner | 20.000.000 |
| president, Director, 10% Owner | 20.000.000 | |
| president, Director, 10% Owner | 20.000.000 | |
| president, Director, 10% Owner | 20.000.000 | |
| 250.000 | ||
| 250.000 | ||
| 250.000 | ||
| 250.000 | ||
| 250.000 | ||
| 250.000 | ||
| 250.000 | ||
| 0 | ||
| 250.000 | ||
| 250.000 | ||
| President, Director, 10% Owner | 20.000.000 | |
| president, Director, 10% Owner | 20.000.000 | |
| 125.000 | ||
| 250.000 | ||
| 250.000 | ||
| 250.000 | ||
| 0 | ||
| 250.000 | ||
| 250.000 | ||
| president, Director, 10% Owner | 20.000.000 | |
| 250.000 | ||
| 0 | ||
| 250.000 | ||
| US:ANVV / Anvia Holdings Corporation | 250.000 | |
| 250.000 | ||
| 300.000 | ||
| 250.000 | ||
| 250.000 | ||
| president,secretary,treasurer, Director, 10% Owner | 20.000.000 | |
| president,secretary,treasurer, Director, 10% Owner | 20.000.000 | |
| president,secretary,treasurer, Director, 10% Owner | 20.000.000 | |
| 250.000 | ||
| 250.000 | ||
| 2.500.000 | ||
| 250.000 | ||
| 250.000 | ||
| 250.000 | ||
| 250.000 | ||
| 300.000 | ||
| president,secretary,treasurer, Director, 10% Owner | 20.000.000 | |
| president,secretary,treasurer, Director, 10% Owner | 20.000.000 | |
| 250.000 | ||
| 250.000 | ||
| 250.000 | ||
| US:KULR / KULR Technology Group, Inc. | 300.000 | |
| 250.000 | ||
| president,secretary,treasurer, Director, 10% Owner | 20.000.000 | |
| president,secretary,treasurer, Director, 10% Owner | 20.000.000 | |
| 250.000 | ||
| 250.000 | ||
| 250.000 | ||
| 250.000 | ||
| 250.000 | ||
| 250.000 | ||
| 250.000 | ||
| president, Director, 10% Owner | 20.000.000 | |
| President, Director, 10% Owner | 20.000.000 | |
| 250.000 | ||
| 10% Owner | 150.000 | |
| 150.000 | ||
| 250.000 | ||
| President, Director, 10% Owner | 20.000.000 | |
| President, Director, 10% Owner | 20.000.000 | |
| president, Director, 10% Owner | 20.000.000 | |
| President, Director, 10% Owner | 20.000.000 | |
| President, Director, 10% Owner | 20.000.000 | |
| President, Director, 10% Owner | 20.000.000 | |
| President, Director, 10% Owner | 20.000.000 | |
| President, Director, 10% Owner | 20.000.000 | |
| President, Director, 10% Owner | 20.000.000 | |
| 250.000 | ||
| 250.000 | ||
| 250.000 | ||
| 250.000 | ||
| 250.000 | ||
| 250.000 | ||
| 250.000 | ||
| 250.000 | ||
| 250.000 | ||
| 250.000 | ||
| 0 | ||
| 250.000 | ||
| 250.000 | ||
| 1.250.000 | ||
| Director, 10% Owner | 20.000.000 | |
| 125.000 | ||
| President, Director, 10% Owner | 20.000.000 | |
| President, Director, 10% Owner | 20.000.000 | |
| then President, Director, 10% Owner | 20.000.000 | |
| president, Director, 10% Owner | 20.000.000 | |
| 250.000 | ||
| 250.000 | ||
| US:CBDY / Target Group Inc. | 250.000 | |
| 250.000 | ||
| 0 | ||
| 50.000 | ||
| 250.000 | ||
| 10% Owner | 250.000 | |
| 250.000 | ||
| 250.000 | ||
| 50.000 | ||
| US:SSOK / Sunstock, Inc. | 10% Owner | 250.000 |
| 200.000 | ||
| 10% Owner | 200.000 | |
| 10% Owner | 250.000 | |
| 50.000 | ||
| 10% Owner | 250.000 | |
| president, Director, 10% Owner | 20.000.000 | |
| 0 | ||
| 250.000 | ||
| president, Director, 10% Owner | 20.000.000 | |
| US:LTESF / LEET Inc. | 150.000 | |
| former officer, direcotr, Director, 10% Owner | 250.000 | |
| frm.office and director, Director, 10% Owner | 250.000 | |
| fmr off.,director, 10% owner, Director, 10% Owner | 250.000 | |
| 250.000 | ||
| US:AUID / authID Inc. | former director former preside, 10% Owner | 250.000 |
| president, Director, 10% Owner | 10.000.000 | |
| president, Director, 10% Owner | 10.000.000 | |
| President, Director, 10% Owner | 10.000.000 | |
| president, Director, 10% Owner | 10.000.000 | |
| president, Director, 10% Owner | 10.000.000 | |
| 250.000 | ||
| 10% Owner | 250.000 | |
| 10% Owner | 250.000 | |
| 10% Owner | 250.000 | |
| 10% Owner | 250.000 | |
| 10% Owner | 250.000 | |
| 10% Owner | 250.000 |
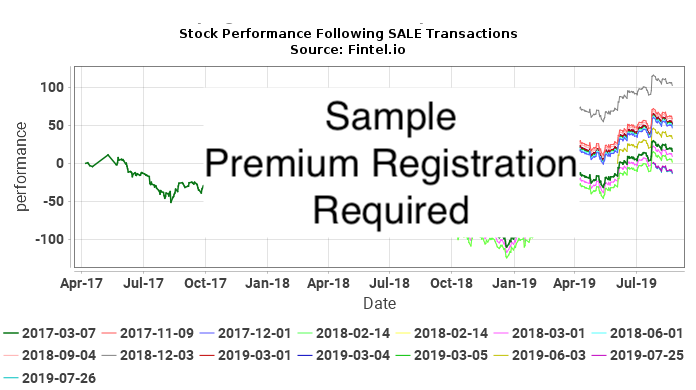
So interpretieren Sie die Diagramme
Die folgenden Diagramme zeigen die Wertentwicklung von Wertpapieren nach jedem offenen, nicht geplanten Handel von James M Cassidy. Nicht geplante Geschäfte sind Geschäfte, die nicht im Rahmen eines 10b5-1-Handelsplans getätigt wurden. Die Aktienperformance wird als kumulative prozentuale Veränderung des Aktienkurses dargestellt. Wenn beispielsweise am 1. Januar 2019 ein Insiderhandel getätigt wurde, zeigt das Diagramm die tägliche prozentuale Veränderung des Wertpapiers bis zum heutigen Tag. Wenn der Aktienkurs in dieser Zeit von $10 auf $15 gestiegen ist, beträgt die kumulative prozentuale Veränderung des Aktienkurses 50 %. Eine Kursveränderung von $10 auf $20 würde 100% betragen und eine Kursveränderung von $10 auf $5 wäre -50%.
Letztendlich versuchen wir festzustellen, wie eng die Geschäfte des Insiders mit den (positiven oder negativen) Überschussrenditen des Aktienkurses korrelieren, um zu sehen, ob der Insider seine Geschäfte zeitlich so abstimmt, dass er von Insiderinformationen profitiert. Stellen Sie sich die Situation vor, dass ein Insider dies tun würde. In dieser Situation würden wir entweder (a) positive Renditen nach Käufen oder (b) negative Renditen nach Verkäufen erwarten. Im Falle von (a) würde das KAUF-Diagramm eine Reihe von aufwärts gerichteten Kurven zeigen, die auf positive Renditen nach jeder Kauftransaktion hinweisen. Im Falle von (b) würde das VERKAUFS-Diagramm eine Reihe von abwärts gerichteten Kurven zeigen, die auf negative Renditen nach jeder Verkaufstransaktion hinweisen.
Dies allein reicht jedoch nicht aus, um Schlussfolgerungen zu ziehen. Wenn sich der Aktienkurs des Unternehmens beispielsweise über viele Jahre hinweg in einem nicht-zyklischen Aufwärtstrend befand, dann würden wir erwarten, dass alle Nach-Kauf-Kurven aufwärts gerichtet sind. Ebenso würden nicht-zyklische Rückgänge über viele Jahre hinweg zu abwärts geneigten Nachhandelsdiagrammen führen. Keines dieser Diagramme würde auf Insiderhandel hindeuten.
Der stärkste Indikator wäre eine Situation, in der der Aktienkurs extrem zyklisch war und es sowohl positive Signale im KAUF-Chart als auch negative im VERKAUF-Chart gab. Diese Situation würde stark auf einen Insider hindeuten, der das Timing von Geschäften zu seinem finanziellen Vorteil nutzt.
Insiderkäufe ANVV / Anvia Holdings Corporation - Kurzfristige Gewinnanalyse
In diesem Abschnitt analysieren wir die Rentabilität jedes ungeplanten Insiderkaufs, der auf dem freien Markt in ANVV / Anvia Holdings Corporation getätigt wurde. Diese Analyse hilft zu verstehen, ob der Insider beständig abnormale Renditen erzielt und es sich lohnt, ihm zu folgen. Diese Analyse bezieht sich auf ein Jahr nach jedem Handel, und die Ergebnisse sind theoretisch.
Die folgende Tabelle zeigt die jüngsten Käufe am offenen Markt, die nicht Teil eines automatischen Handelsplans waren.
| Handelsdatum | Ticker | Insider | Berichtete Aktien |
Berichteter Preis |
Angepasste Aktien |
Angepasster Preis |
Kostenbasis | Tage bis Max |
Preis bei Max |
Max Gewinn ($) |
Max Rendite (%) |
|---|---|---|---|---|---|---|---|
| Für diese Insider- und Wertpapierkombination sind keine ungeplanten Open-Market-Trades bekannt |
Angepasster Preis ist der an den Split angepasste Preis. Angepasste Aktien ist die an den Split angepasste Anzahl der Aktien.
Insiderverkäufe ANVV / Anvia Holdings Corporation - Kurzfristige Verlustanalyse
In diesem Abschnitt analysieren wir die kurzfristige Verlustvermeidung jedes ungeplanten Insider-Verkaufs auf dem freien Markt in ANVV / Anvia Holdings Corporation. Ein konsistentes Muster der Verlustvermeidung kann darauf hindeuten, dass zukünftige Verkaufstransaktionen Kursrückgänge vorhersagen können. Diese Analyse bezieht sich auf ein Jahr nach jedem Handel und die Ergebnisse sind theoretisch.
Die folgende Tabelle zeigt die jüngsten Verkäufe am offenen Markt, die nicht Teil eines automatischen Handelsplans waren.
| Handelsdatum | Ticker | Insider | Berichtete Aktien |
Berichteter Preis |
Angepasste Aktien |
Angepasster Preis |
Kostenbasis | Tage bis Min |
Preis bei Min |
Max Verlust Vermieden ($) |
Max. Verlust Vermieden (%) |
|---|---|---|---|---|---|---|---|---|---|---|---|
| 2017-01-10 | none | CASSIDY JAMES M | 9.750.000 | 0,0000 | 9.750.000 | 0,0000 | 0 | 0 |
Angepasster Preis ist der an den Split angepasste Preis. Angepasste Aktien ist die an den Split angepasste Anzahl der Aktien.
Insiderkäufe AUID / authID Inc. - Kurzfristige Gewinnanalyse
In diesem Abschnitt analysieren wir die Rentabilität jedes ungeplanten Insiderkaufs, der auf dem freien Markt in ANVV / Anvia Holdings Corporation getätigt wurde. Diese Analyse hilft zu verstehen, ob der Insider beständig abnormale Renditen erzielt und es sich lohnt, ihm zu folgen. Diese Analyse bezieht sich auf ein Jahr nach jedem Handel, und die Ergebnisse sind theoretisch.
Die folgende Tabelle zeigt die jüngsten Käufe am offenen Markt, die nicht Teil eines automatischen Handelsplans waren.
| Handelsdatum | Ticker | Insider | Berichtete Aktien |
Berichteter Preis |
Angepasste Aktien |
Angepasster Preis |
Kostenbasis | Tage bis Max |
Preis bei Max |
Max Gewinn ($) |
Max Rendite (%) |
|---|---|---|---|---|---|---|---|
| Für diese Insider- und Wertpapierkombination sind keine ungeplanten Open-Market-Trades bekannt |
Angepasster Preis ist der an den Split angepasste Preis. Angepasste Aktien ist die an den Split angepasste Anzahl der Aktien.
Insiderverkäufe AUID / authID Inc. - Kurzfristige Verlustanalyse
In diesem Abschnitt analysieren wir die kurzfristige Verlustvermeidung jedes ungeplanten Insider-Verkaufs auf dem freien Markt in ANVV / Anvia Holdings Corporation. Ein konsistentes Muster der Verlustvermeidung kann darauf hindeuten, dass zukünftige Verkaufstransaktionen Kursrückgänge vorhersagen können. Diese Analyse bezieht sich auf ein Jahr nach jedem Handel und die Ergebnisse sind theoretisch.
Die folgende Tabelle zeigt die jüngsten Verkäufe am offenen Markt, die nicht Teil eines automatischen Handelsplans waren.
| Handelsdatum | Ticker | Insider | Berichtete Aktien |
Berichteter Preis |
Angepasste Aktien |
Angepasster Preis |
Kostenbasis | Tage bis Min |
Preis bei Min |
Max Verlust Vermieden ($) |
Max. Verlust Vermieden (%) |
|---|---|---|---|---|---|---|---|
| Für diese Insider- und Wertpapierkombination sind keine ungeplanten Open-Market-Trades bekannt |
Angepasster Preis ist der an den Split angepasste Preis. Angepasste Aktien ist die an den Split angepasste Anzahl der Aktien.
Insiderkäufe CBDY / Target Group Inc. - Kurzfristige Gewinnanalyse
In diesem Abschnitt analysieren wir die Rentabilität jedes ungeplanten Insiderkaufs, der auf dem freien Markt in ANVV / Anvia Holdings Corporation getätigt wurde. Diese Analyse hilft zu verstehen, ob der Insider beständig abnormale Renditen erzielt und es sich lohnt, ihm zu folgen. Diese Analyse bezieht sich auf ein Jahr nach jedem Handel, und die Ergebnisse sind theoretisch.
Die folgende Tabelle zeigt die jüngsten Käufe am offenen Markt, die nicht Teil eines automatischen Handelsplans waren.
| Handelsdatum | Ticker | Insider | Berichtete Aktien |
Berichteter Preis |
Angepasste Aktien |
Angepasster Preis |
Kostenbasis | Tage bis Max |
Preis bei Max |
Max Gewinn ($) |
Max Rendite (%) |
|---|---|---|---|---|---|---|---|
| Für diese Insider- und Wertpapierkombination sind keine ungeplanten Open-Market-Trades bekannt |
Angepasster Preis ist der an den Split angepasste Preis. Angepasste Aktien ist die an den Split angepasste Anzahl der Aktien.
Insiderverkäufe CBDY / Target Group Inc. - Kurzfristige Verlustanalyse
In diesem Abschnitt analysieren wir die kurzfristige Verlustvermeidung jedes ungeplanten Insider-Verkaufs auf dem freien Markt in ANVV / Anvia Holdings Corporation. Ein konsistentes Muster der Verlustvermeidung kann darauf hindeuten, dass zukünftige Verkaufstransaktionen Kursrückgänge vorhersagen können. Diese Analyse bezieht sich auf ein Jahr nach jedem Handel und die Ergebnisse sind theoretisch.
Die folgende Tabelle zeigt die jüngsten Verkäufe am offenen Markt, die nicht Teil eines automatischen Handelsplans waren.
| Handelsdatum | Ticker | Insider | Berichtete Aktien |
Berichteter Preis |
Angepasste Aktien |
Angepasster Preis |
Kostenbasis | Tage bis Min |
Preis bei Min |
Max Verlust Vermieden ($) |
Max. Verlust Vermieden (%) |
|---|---|---|---|---|---|---|---|---|---|---|---|
| 2014-05-05 | none | CASSIDY JAMES M | 9.750.000 | 975,0000 | 9.750 | 975.000,0000 | 9.506.250.000 | 731 |
Angepasster Preis ist der an den Split angepasste Preis. Angepasste Aktien ist die an den Split angepasste Anzahl der Aktien.
Insiderkäufe KULR / KULR Technology Group, Inc. - Kurzfristige Gewinnanalyse
In diesem Abschnitt analysieren wir die Rentabilität jedes ungeplanten Insiderkaufs, der auf dem freien Markt in ANVV / Anvia Holdings Corporation getätigt wurde. Diese Analyse hilft zu verstehen, ob der Insider beständig abnormale Renditen erzielt und es sich lohnt, ihm zu folgen. Diese Analyse bezieht sich auf ein Jahr nach jedem Handel, und die Ergebnisse sind theoretisch.
Die folgende Tabelle zeigt die jüngsten Käufe am offenen Markt, die nicht Teil eines automatischen Handelsplans waren.
| Handelsdatum | Ticker | Insider | Berichtete Aktien |
Berichteter Preis |
Angepasste Aktien |
Angepasster Preis |
Kostenbasis | Tage bis Max |
Preis bei Max |
Max Gewinn ($) |
Max Rendite (%) |
|---|---|---|---|---|---|---|---|
| Für diese Insider- und Wertpapierkombination sind keine ungeplanten Open-Market-Trades bekannt |
Angepasster Preis ist der an den Split angepasste Preis. Angepasste Aktien ist die an den Split angepasste Anzahl der Aktien.
Insiderverkäufe KULR / KULR Technology Group, Inc. - Kurzfristige Verlustanalyse
In diesem Abschnitt analysieren wir die kurzfristige Verlustvermeidung jedes ungeplanten Insider-Verkaufs auf dem freien Markt in ANVV / Anvia Holdings Corporation. Ein konsistentes Muster der Verlustvermeidung kann darauf hindeuten, dass zukünftige Verkaufstransaktionen Kursrückgänge vorhersagen können. Diese Analyse bezieht sich auf ein Jahr nach jedem Handel und die Ergebnisse sind theoretisch.
Die folgende Tabelle zeigt die jüngsten Verkäufe am offenen Markt, die nicht Teil eines automatischen Handelsplans waren.
| Handelsdatum | Ticker | Insider | Berichtete Aktien |
Berichteter Preis |
Angepasste Aktien |
Angepasster Preis |
Kostenbasis | Tage bis Min |
Preis bei Min |
Max Verlust Vermieden ($) |
Max. Verlust Vermieden (%) |
|---|---|---|---|---|---|---|---|---|---|---|---|
| 2016-04-17 | none | CASSIDY JAMES M | 970.000 | 970,0000 | 121.250 | 7.760,0000 | 940.900.000 | 0 |
Angepasster Preis ist der an den Split angepasste Preis. Angepasste Aktien ist die an den Split angepasste Anzahl der Aktien.
Insiderkäufe LTESF / LEET Inc. - Kurzfristige Gewinnanalyse
In diesem Abschnitt analysieren wir die Rentabilität jedes ungeplanten Insiderkaufs, der auf dem freien Markt in ANVV / Anvia Holdings Corporation getätigt wurde. Diese Analyse hilft zu verstehen, ob der Insider beständig abnormale Renditen erzielt und es sich lohnt, ihm zu folgen. Diese Analyse bezieht sich auf ein Jahr nach jedem Handel, und die Ergebnisse sind theoretisch.
Die folgende Tabelle zeigt die jüngsten Käufe am offenen Markt, die nicht Teil eines automatischen Handelsplans waren.
| Handelsdatum | Ticker | Insider | Berichtete Aktien |
Berichteter Preis |
Angepasste Aktien |
Angepasster Preis |
Kostenbasis | Tage bis Max |
Preis bei Max |
Max Gewinn ($) |
Max Rendite (%) |
|---|---|---|---|---|---|---|---|
| Für diese Insider- und Wertpapierkombination sind keine ungeplanten Open-Market-Trades bekannt |
Angepasster Preis ist der an den Split angepasste Preis. Angepasste Aktien ist die an den Split angepasste Anzahl der Aktien.
Insiderverkäufe LTESF / LEET Inc. - Kurzfristige Verlustanalyse
In diesem Abschnitt analysieren wir die kurzfristige Verlustvermeidung jedes ungeplanten Insider-Verkaufs auf dem freien Markt in ANVV / Anvia Holdings Corporation. Ein konsistentes Muster der Verlustvermeidung kann darauf hindeuten, dass zukünftige Verkaufstransaktionen Kursrückgänge vorhersagen können. Diese Analyse bezieht sich auf ein Jahr nach jedem Handel und die Ergebnisse sind theoretisch.
Die folgende Tabelle zeigt die jüngsten Verkäufe am offenen Markt, die nicht Teil eines automatischen Handelsplans waren.
| Handelsdatum | Ticker | Insider | Berichtete Aktien |
Berichteter Preis |
Angepasste Aktien |
Angepasster Preis |
Kostenbasis | Tage bis Min |
Preis bei Min |
Max Verlust Vermieden ($) |
Max. Verlust Vermieden (%) |
|---|---|---|---|---|---|---|---|---|---|---|---|
| 2014-02-06 | none | CASSIDY JAMES M | 9.850.000 | 985,0000 | 9.850.000 | 985,0000 | 9.702.250.000 | 730 |
Angepasster Preis ist der an den Split angepasste Preis. Angepasste Aktien ist die an den Split angepasste Anzahl der Aktien.
Insiderkäufe NBND / NetBrands Corp. - Kurzfristige Gewinnanalyse
In diesem Abschnitt analysieren wir die Rentabilität jedes ungeplanten Insiderkaufs, der auf dem freien Markt in ANVV / Anvia Holdings Corporation getätigt wurde. Diese Analyse hilft zu verstehen, ob der Insider beständig abnormale Renditen erzielt und es sich lohnt, ihm zu folgen. Diese Analyse bezieht sich auf ein Jahr nach jedem Handel, und die Ergebnisse sind theoretisch.
Die folgende Tabelle zeigt die jüngsten Käufe am offenen Markt, die nicht Teil eines automatischen Handelsplans waren.
| Handelsdatum | Ticker | Insider | Berichtete Aktien |
Berichteter Preis |
Angepasste Aktien |
Angepasster Preis |
Kostenbasis | Tage bis Max |
Preis bei Max |
Max Gewinn ($) |
Max Rendite (%) |
|---|---|---|---|---|---|---|---|
| Für diese Insider- und Wertpapierkombination sind keine ungeplanten Open-Market-Trades bekannt |
Angepasster Preis ist der an den Split angepasste Preis. Angepasste Aktien ist die an den Split angepasste Anzahl der Aktien.
Insiderverkäufe NBND / NetBrands Corp. - Kurzfristige Verlustanalyse
In diesem Abschnitt analysieren wir die kurzfristige Verlustvermeidung jedes ungeplanten Insider-Verkaufs auf dem freien Markt in ANVV / Anvia Holdings Corporation. Ein konsistentes Muster der Verlustvermeidung kann darauf hindeuten, dass zukünftige Verkaufstransaktionen Kursrückgänge vorhersagen können. Diese Analyse bezieht sich auf ein Jahr nach jedem Handel und die Ergebnisse sind theoretisch.
Die folgende Tabelle zeigt die jüngsten Verkäufe am offenen Markt, die nicht Teil eines automatischen Handelsplans waren.
| Handelsdatum | Ticker | Insider | Berichtete Aktien |
Berichteter Preis |
Angepasste Aktien |
Angepasster Preis |
Kostenbasis | Tage bis Min |
Preis bei Min |
Max Verlust Vermieden ($) |
Max. Verlust Vermieden (%) |
|---|---|---|---|---|---|---|---|---|---|---|---|
| 2018-06-13 | none | CASSIDY JAMES M | 9.750.000 | 975,0000 | 9.750.000 | 975,0000 | 9.506.250.000 | 0 |
Angepasster Preis ist der an den Split angepasste Preis. Angepasste Aktien ist die an den Split angepasste Anzahl der Aktien.
Insiderkäufe SSOK / Sunstock, Inc. - Kurzfristige Gewinnanalyse
In diesem Abschnitt analysieren wir die Rentabilität jedes ungeplanten Insiderkaufs, der auf dem freien Markt in ANVV / Anvia Holdings Corporation getätigt wurde. Diese Analyse hilft zu verstehen, ob der Insider beständig abnormale Renditen erzielt und es sich lohnt, ihm zu folgen. Diese Analyse bezieht sich auf ein Jahr nach jedem Handel, und die Ergebnisse sind theoretisch.
Die folgende Tabelle zeigt die jüngsten Käufe am offenen Markt, die nicht Teil eines automatischen Handelsplans waren.
| Handelsdatum | Ticker | Insider | Berichtete Aktien |
Berichteter Preis |
Angepasste Aktien |
Angepasster Preis |
Kostenbasis | Tage bis Max |
Preis bei Max |
Max Gewinn ($) |
Max Rendite (%) |
|---|---|---|---|---|---|---|---|
| Für diese Insider- und Wertpapierkombination sind keine ungeplanten Open-Market-Trades bekannt |
Angepasster Preis ist der an den Split angepasste Preis. Angepasste Aktien ist die an den Split angepasste Anzahl der Aktien.
Insiderverkäufe SSOK / Sunstock, Inc. - Kurzfristige Verlustanalyse
In diesem Abschnitt analysieren wir die kurzfristige Verlustvermeidung jedes ungeplanten Insider-Verkaufs auf dem freien Markt in ANVV / Anvia Holdings Corporation. Ein konsistentes Muster der Verlustvermeidung kann darauf hindeuten, dass zukünftige Verkaufstransaktionen Kursrückgänge vorhersagen können. Diese Analyse bezieht sich auf ein Jahr nach jedem Handel und die Ergebnisse sind theoretisch.
Die folgende Tabelle zeigt die jüngsten Verkäufe am offenen Markt, die nicht Teil eines automatischen Handelsplans waren.
| Handelsdatum | Ticker | Insider | Berichtete Aktien |
Berichteter Preis |
Angepasste Aktien |
Angepasster Preis |
Kostenbasis | Tage bis Min |
Preis bei Min |
Max Verlust Vermieden ($) |
Max. Verlust Vermieden (%) |
|---|---|---|---|---|---|---|---|
| Für diese Insider- und Wertpapierkombination sind keine ungeplanten Open-Market-Trades bekannt |
Angepasster Preis ist der an den Split angepasste Preis. Angepasste Aktien ist die an den Split angepasste Anzahl der Aktien.
Insiderkäufe XESP / Electronic Servitor Publication Network, Inc. - Kurzfristige Gewinnanalyse
In diesem Abschnitt analysieren wir die Rentabilität jedes ungeplanten Insiderkaufs, der auf dem freien Markt in ANVV / Anvia Holdings Corporation getätigt wurde. Diese Analyse hilft zu verstehen, ob der Insider beständig abnormale Renditen erzielt und es sich lohnt, ihm zu folgen. Diese Analyse bezieht sich auf ein Jahr nach jedem Handel, und die Ergebnisse sind theoretisch.
Die folgende Tabelle zeigt die jüngsten Käufe am offenen Markt, die nicht Teil eines automatischen Handelsplans waren.
| Handelsdatum | Ticker | Insider | Berichtete Aktien |
Berichteter Preis |
Angepasste Aktien |
Angepasster Preis |
Kostenbasis | Tage bis Max |
Preis bei Max |
Max Gewinn ($) |
Max Rendite (%) |
|---|---|---|---|---|---|---|---|
| Für diese Insider- und Wertpapierkombination sind keine ungeplanten Open-Market-Trades bekannt |
Angepasster Preis ist der an den Split angepasste Preis. Angepasste Aktien ist die an den Split angepasste Anzahl der Aktien.
Insiderverkäufe XESP / Electronic Servitor Publication Network, Inc. - Kurzfristige Verlustanalyse
In diesem Abschnitt analysieren wir die kurzfristige Verlustvermeidung jedes ungeplanten Insider-Verkaufs auf dem freien Markt in ANVV / Anvia Holdings Corporation. Ein konsistentes Muster der Verlustvermeidung kann darauf hindeuten, dass zukünftige Verkaufstransaktionen Kursrückgänge vorhersagen können. Diese Analyse bezieht sich auf ein Jahr nach jedem Handel und die Ergebnisse sind theoretisch.
Die folgende Tabelle zeigt die jüngsten Verkäufe am offenen Markt, die nicht Teil eines automatischen Handelsplans waren.
| Handelsdatum | Ticker | Insider | Berichtete Aktien |
Berichteter Preis |
Angepasste Aktien |
Angepasster Preis |
Kostenbasis | Tage bis Min |
Preis bei Min |
Max Verlust Vermieden ($) |
Max. Verlust Vermieden (%) |
|---|---|---|---|---|---|---|---|---|---|---|---|
| 2018-06-17 | none | CASSIDY JAMES M | 10.000.000 | 1.000,0000 | 10.000.000 | 1.000,0000 | 10.000.000.000 | 731 |
Angepasster Preis ist der an den Split angepasste Preis. Angepasste Aktien ist die an den Split angepasste Anzahl der Aktien.
Geschichte des Insiderhandels
Diese Tabelle zeigt die vollständige Liste der von James M Cassidy getätigten Insidergeschäfte, die der Securities Exchange Commission (SEC) gemeldet wurden.
| Datum der Einreichung | Tran Datum | Form | Ticker | Wertpapier | Code | Aktien | Verbleibende Aktien | Prozent Änderung |
Aktie Preis |
Tran Wert |
Verbleibender Wert |
|
|---|---|---|---|---|---|---|---|---|---|---|---|---|
| 2018-09-07 |
|
4 | none |
Hidden Forest Acquisition Corp
common stock |
S - Sale | -9.800.000 | 200.000 | -98,00 | 980,00 | -9.604.000.000 | 196.000.000 | |
| 2018-08-27 |
|
4 | none |
Vivos Holdings Inc.
common stock |
S - Sale | -9.875.000 | 125.000 | -98,75 | 987,00 | -9.746.625.000 | 123.375.000 | |
| 2018-08-27 | 3 | none |
Comet Trail Acquisition Corp
common stock |
20.000.000 | ||||||||
| 2018-08-27 | 3 | none |
Comet Trail Acquisition Corp
common stock |
20.000.000 | ||||||||
| 2018-08-27 | 3 | none |
Comet Trail Acquisition Corp
common stock |
20.000.000 | ||||||||
| 2018-08-27 | 3 | none |
Mercury Trail Acquisition Corp
common stock |
20.000.000 | ||||||||
| 2018-08-27 | 3 | none |
Mercury Trail Acquisition Corp
common stock |
20.000.000 | ||||||||
| 2018-08-27 | 3 | none |
Mercury Trail Acquisition Corp
common stock |
20.000.000 | ||||||||
| 2018-08-27 | 3 | none |
Mars Trail Acquisition Corp
common stock |
20.000.000 | ||||||||
| 2018-08-27 | 3 | none |
Mars Trail Acquisition Corp
common stock |
20.000.000 | ||||||||
| 2018-08-27 | 3 | none |
Mars Trail Acquisition Corp
common stock |
20.000.000 | ||||||||
| 2018-08-27 | 3 | none |
Jupiter Trail Acquisition Corp
common stock |
20.000.000 | ||||||||
| 2018-08-27 | 3 | none |
Jupiter Trail Acquisition Corp
common stock |
20.000.000 | ||||||||
| 2018-08-27 | 3 | none |
Jupiter Trail Acquisition Corp
common stock |
20.000.000 | ||||||||
| 2018-08-27 | 3 | none |
Neptune Trail Acquisition Corp
common stock |
20.000.000 | ||||||||
| 2018-08-27 | 3 | none |
Neptune Trail Acquisition Corp
common stock |
20.000.000 | ||||||||
| 2018-08-27 | 3 | none |
Neptune Trail Acquisition Corp
common stock |
20.000.000 | ||||||||
| 2018-08-27 | 3 | none |
Pluto Trail Acquisition Corp
common stock |
20.000.000 | ||||||||
| 2018-08-27 | 3 | none |
Pluto Trail Acquisition Corp
common stock |
20.000.000 | ||||||||
| 2018-08-27 | 3 | none |
Pluto Trail Acquisition Corp
common stock |
20.000.000 | ||||||||
| 2018-08-27 | 3 | none |
Venus Trail Acquisition Corp
common stock |
20.000.000 | ||||||||
| 2018-08-27 | 3 | none |
Venus Trail Acquisition Corp
common stock |
20.000.000 | ||||||||
| 2018-08-27 | 3 | none |
Venus Trail Acquisition Corp
common stock |
20.000.000 | ||||||||
| 2018-08-27 | 3 | none |
Universe Trail Acquisition Corp
common stock |
20.000.000 | ||||||||
| 2018-08-27 | 3 | none |
Universe Trail Acquisition Corp
common stock |
20.000.000 | ||||||||
| 2018-08-27 | 3 | none |
Universe Trail Acquisition Corp
common stock |
20.000.000 | ||||||||
| 2018-08-27 | 3 | none |
Solar Trail Acquisition Corp
common stock |
20.000.000 | ||||||||
| 2018-08-27 | 3 | none |
Solar Trail Acquisition Corp
common stock |
20.000.000 | ||||||||
| 2018-08-27 | 3 | none |
Solar Trail Acquisition Corp
common stock |
20.000.000 | ||||||||
| 2018-08-27 | 3 | none |
Saturn Trail Acquisition Corp
common stock |
20.000.000 | ||||||||
| 2018-08-27 | 3 | none |
Saturn Trail Acquisition Corp
common stock |
20.000.000 | ||||||||
| 2018-08-27 | 3 | none |
Saturn Trail Acquisition Corp
common stock |
20.000.000 | ||||||||
| 2018-07-11 |
|
4 | none |
Emaginos Inc.
common stock |
S - Sale | -9.750.000 | 250.000 | -97,50 | 975,00 | -9.506.250.000 | 243.750.000 | |
| 2018-07-11 |
|
4 | none |
Bhatt Developers & Builders Inc.
common stock |
S - Sale | -9.750.000 | 250.000 | -97,50 | 975,00 | -9.506.250.000 | 243.750.000 | |
| 2018-07-09 |
|
4 | none |
BC Home Corp
common stock |
S - Sale | -9.750.000 | 250.000 | -97,50 | 975,00 | -9.506.250.000 | 243.750.000 | |
| 2018-06-21 |
|
4 | none |
CannAssist International Corp
common stock |
S - Sale | -10.000.000 | 0 | -100,00 | 1.000,00 | -10.000.000.000 | ||
| 2018-06-21 | 3 | none |
Global Diversified Marketing Group Inc.
common stock |
20.000.000 | ||||||||
| 2018-06-21 | 3 | none |
Global Diversified Marketing Group Inc.
common stock |
20.000.000 | ||||||||
| 2018-06-21 | 3 | none |
Global Diversified Marketing Group Inc.
common stock |
20.000.000 | ||||||||
| 2018-06-21 | 3 | none |
Willow Forest Acquisition Corp
common stock |
20.000.000 | ||||||||
| 2018-06-21 | 3 | none |
Willow Forest Acquisition Corp
common stock |
20.000.000 | ||||||||
| 2018-06-21 | 3 | none |
Willow Forest Acquisition Corp
common stock |
20.000.000 | ||||||||
| 2018-06-21 | 3 | none |
Walnut Forest Acquisition Corp
common stock |
20.000.000 | ||||||||
| 2018-06-21 | 3 | none |
Walnut Forest Acquisition Corp
common stock |
20.000.000 | ||||||||
| 2018-06-21 | 3 | none |
Walnut Forest Acquisition Corp
common stock |
20.000.000 | ||||||||
| 2018-06-21 | 3 | none |
Snowy Forest Acquisition Corp
common stock |
20.000.000 | ||||||||
| 2018-06-21 | 3 | none |
Snowy Forest Acquisition Corp
common stock |
20.000.000 | ||||||||
| 2018-06-21 | 3 | none |
Snowy Forest Acquisition Corp
common stock |
20.000.000 | ||||||||
| 2018-06-21 | 3 | none |
Bhatt Developers & Builders Inc.
common stock |
20.000.000 | ||||||||
| 2018-06-21 | 3 | none |
Bhatt Developers & Builders Inc.
common stock |
20.000.000 | ||||||||
| 2018-06-21 | 3 | none |
Bhatt Developers & Builders Inc.
common stock |
20.000.000 | ||||||||
| 2018-06-21 | 3 | none |
BC Home Corp
common stock |
20.000.000 | ||||||||
| 2018-06-21 | 3 | none |
BC Home Corp
common stock |
20.000.000 | ||||||||
| 2018-06-21 | 3 | none |
BC Home Corp
common stock |
20.000.000 | ||||||||
| 2018-06-21 | 3 | none |
Hickory Forest Acquisition Corp
common stock |
20.000.000 | ||||||||
| 2018-06-21 | 3 | none |
Hickory Forest Acquisition Corp
common stock |
20.000.000 | ||||||||
| 2018-06-21 | 3 | none |
Hickory Forest Acquisition Corp
common stock |
20.000.000 | ||||||||
| 2018-06-21 | 3 | none |
Hidden Forest Acquisition Corp
common stock |
20.000.000 | ||||||||
| 2018-06-21 | 3 | none |
Hidden Forest Acquisition Corp
common stock |
20.000.000 | ||||||||
| 2018-06-21 | 3 | none |
Hidden Forest Acquisition Corp
common stock |
20.000.000 | ||||||||
| 2018-06-14 |
|
4 | none |
Global Diversified Marketing Group Inc.
common stock |
S - Sale | -9.750.000 | 250.000 | -97,50 | 975,00 | -9.506.250.000 | 243.750.000 | |
| 2018-04-25 |
|
4 | none |
Nexe Blockchain Inc.
common stock |
S - Sale | -9.750.000 | 250.000 | -97,50 | 975,00 | -9.506.250.000 | 243.750.000 | |
| 2018-04-24 |
|
4 | none |
UNITED CAPITAL CONSULTANTS INC.
common stock |
S - Sale | -9.750.000 | 250.000 | -97,50 | 975,00 | -9.506.250.000 | 243.750.000 | |
| 2018-04-24 |
|
4 | none |
Aedan Financial Corp
common stock |
S - Sale | -9.750.000 | 250.000 | -97,50 | 975,00 | -9.506.250.000 | 243.750.000 | |
| 2018-04-24 |
|
4 | none |
Endless Charge, Inc.
common stock |
S - Sale | -9.750.000 | 250.000 | -97,50 | 975,00 | -9.506.250.000 | 243.750.000 | |
| 2018-04-11 |
|
4 | none |
American Blockchain Biochar Corp
common stock |
S - Sale | -9.750.000 | 250.000 | -97,50 | 975,00 | -9.506.250.000 | 243.750.000 | |
| 2018-03-15 |
|
4 | none |
Anutra Corp
common stock |
S - Sale | -9.750.000 | 250.000 | -97,50 | 975,00 | -9.506.250.000 | 243.750.000 | |
| 2018-02-15 |
|
4 | none |
United Restaurant Group International Inc.
common stock |
S - Sale | -9.750.000 | 250.000 | -97,50 | 975,00 | -9.506.250.000 | 243.750.000 | |
| 2018-02-09 |
|
4 | none |
AllyMe Holding Inc.
common stock |
S - Sale | -250.000 | 0 | -100,00 | 25,00 | -6.250.000 | ||
| 2018-02-08 |
|
4 | none |
Billion Holding Inc.
common stock |
S - Sale | -9.750.000 | 250.000 | -97,50 | 975,00 | -9.506.250.000 | 243.750.000 | |
| 2018-01-19 |
|
4 | none |
Biostar Angel Stem Cell Corp
common stock |
S - Sale | -9.750.000 | 250.000 | -97,50 | 975,00 | -9.506.250.000 | 243.750.000 | |
| 2017-11-22 |
|
4 | none |
Rain Sound Acquisition Corp
common stock |
S - Sale | -9.750.000 | 250.000 | -97,50 | 975,00 | -9.506.250.000 | 243.750.000 | |
| 2017-09-05 | 3 | none |
Iris Grove Acquisition Corp
common stock |
20.000.000 | ||||||||
| 2017-09-05 | 3 | none |
Iris Grove Acquisition Corp
common stock |
20.000.000 | ||||||||
| 2017-09-05 | 3 | none |
Lily Grove Acquisition Corp
common stock |
20.000.000 | ||||||||
| 2017-09-05 | 3 | none |
Lily Grove Acquisition Corp
common stock |
20.000.000 | ||||||||
| 2017-09-05 | 3 | none |
Peony Grove Acquisition Corp
common stock |
20.000.000 | ||||||||
| 2017-09-05 | 3 | none |
Peony Grove Acquisition Corp
common stock |
20.000.000 | ||||||||
| 2017-09-05 | 3 | none |
Calla Grove Acquisition Corp
common stock |
20.000.000 | ||||||||
| 2017-09-05 | 3 | none |
Calla Grove Acquisition Corp
common stock |
20.000.000 | ||||||||
| 2017-09-05 | 3 | none |
Orchid Grove Acquisition Corp
common stock |
20.000.000 | ||||||||
| 2017-09-05 | 3 | none |
Orchid Grove Acquisition Corp
common stock |
20.000.000 | ||||||||
| 2017-09-05 | 3 | none |
Tulip Grove Acquisition Corp
common stock |
20.000.000 | ||||||||
| 2017-09-05 | 3 | none |
Tulip Grove Acquisition Corp
common stock |
20.000.000 | ||||||||
| 2017-09-01 |
|
4 | none |
European CPG Acquisition Corp
common stock |
S - Sale | -9.875.000 | 125.000 | -98,75 | 987,00 | -9.746.625.000 | 123.375.000 | |
| 2017-08-31 |
|
4 | none |
Extreme Energy Solutions Inc.
common stock |
S - Sale | -9.750.000 | 250.000 | -97,50 | 975,00 | -9.506.250.000 | 243.750.000 | |
| 2017-06-22 |
|
4 | none |
Alife Corp
common stock |
S - Sale | -9.750.000 | 250.000 | -97,50 | 975,00 | -9.506.250.000 | 243.750.000 | |
| 2017-06-09 |
|
4 | none |
Ventura Sports & Entertainment Inc.
common stock |
S - Sale | -9.750.000 | 250.000 | -97,50 | 975,00 | -9.506.250.000 | 243.750.000 | |
| 2017-05-22 |
|
4 | none |
Golden Rush, Inc.
common stock |
S - Sale | -10.000.000 | 0 | -100,00 | 1.000,00 | -10.000.000.000 | ||
| 2017-05-05 |
|
4 | none |
CHINA BIOTECH HOLDINGS Ltd (del)
common stock |
S - Sale | -9.750.000 | 250.000 | -97,50 | 975,00 | -9.506.250.000 | 243.750.000 | |
| 2017-04-21 |
|
4 | none |
Celebiddy, Inc.
common stock |
S - Sale | -9.750.000 | 250.000 | -97,50 | 975,00 | -9.506.250.000 | 243.750.000 | |
| 2017-03-20 | 3 | none |
Rough Sound Acquisition Corp
common stock |
20.000.000 | ||||||||
| 2017-03-20 | 3 | none |
Rough Sound Acquisition Corp
common stock |
20.000.000 | ||||||||
| 2017-03-20 | 3 | none |
Still Sound Acquisition Corp
common stock |
20.000.000 | ||||||||
| 2017-03-20 | 3 | none |
Still Sound Acquisition Corp
common stock |
20.000.000 | ||||||||
| 2017-03-20 | 3 | none |
Rain Sound Acquisition Corp
common stock |
20.000.000 | ||||||||
| 2017-03-20 | 3 | none |
Rain Sound Acquisition Corp
common stock |
20.000.000 | ||||||||
| 2017-03-20 | 3 | none |
Forest Sound Acquisition Corp
common stock |
20.000.000 | ||||||||
| 2017-03-20 | 3 | none |
Forest Sound Acquisition Corp
common stock |
20.000.000 | ||||||||
| 2017-03-20 | 3 | none |
Echo Sound Acquisition Corp
common stock |
20.000.000 | ||||||||
| 2017-03-20 | 3 | none |
Echo Sound Acquisition Corp
common stock |
20.000.000 | ||||||||
| 2017-03-20 | 3 | none |
Thicket Sound Acquisition Corp
common stock |
20.000.000 | ||||||||
| 2017-03-20 | 3 | none |
Thicket Sound Acquisition Corp
common stock |
20.000.000 | ||||||||
| 2017-03-20 | 3 | none |
Park Sound Acquisition Corp
common stock |
20.000.000 | ||||||||
| 2017-03-20 | 3 | none |
Park Sound Acquisition Corp
common stock |
20.000.000 | ||||||||
| 2017-03-20 | 3 | none |
Timber Sound Acquisition Corp
common stock |
20.000.000 | ||||||||
| 2017-03-20 | 3 | none |
Timber Sound Acquisition Corp
common stock |
20.000.000 | ||||||||
| 2017-03-20 | 3 | none |
Bush Sound Acquisition Corp
common stock |
40.000.000 | ||||||||
| 2017-03-20 | 3 | none |
Bush Sound Acquisition Corp
common stock |
40.000.000 | ||||||||
| 2017-03-15 |
|
4 | none |
FAH MAI HOLDINGS, INC.
common stock |
S - Sale | -9.750.000 | 250.000 | -97,50 | 975,00 | -9.506.250.000 | 243.750.000 | |
| 2017-03-15 |
|
4 | none |
AMERICAN STANDARD WALLET, INC.
common stock |
S - Sale | -10.000.000 | 0 | -100,00 | 1.000,00 | -10.000.000.000 | ||
| 2017-03-02 |
|
4 | none |
Hawk Street Acquisition Corp
common stock |
S - Sale | -9.750.000 | 250.000 | -97,50 | 975,00 | -9.506.250.000 | 243.750.000 | |
| 2017-01-23 |
|
4 | none |
Anvia Holdings Corp
common stock |
S - Sale | 9.750.000 | 250.000 | -102,63 | ||||
| 2017-01-06 |
|
4 | none |
La Carte Charts Corp
common stock |
S - Sale | -9.750.000 | 250.000 | -97,50 | 975,00 | -9.506.250.000 | 243.750.000 | |
| 2017-01-06 |
|
4 | none |
Diverse Development Group Inc.
common stock |
S - Sale | -9.700.000 | 300.000 | -97,00 | 970,00 | -9.409.000.000 | 291.000.000 | |
| 2016-09-29 |
|
4 | none |
Garnet Island Acquisition Corp
common stock |
S - Sale | -9.750.000 | 250.000 | -97,50 | 975,00 | -9.506.250.000 | 243.750.000 | |
| 2016-08-25 |
|
4 | none |
Premier Hopkins International Corp
common stock |
S - Sale | -9.750.000 | 250.000 | -97,50 | 975,00 | -9.506.250.000 | 243.750.000 | |
| 2016-08-19 | 3 | none |
Starling Street Acquisition Corp
common stock |
20.000.000 | ||||||||
| 2016-08-19 | 3 | none |
Starling Street Acquisition Corp
common stock |
20.000.000 | ||||||||
| 2016-08-19 | 3 | none |
Dove Street Acquisition Corp
common stock |
20.000.000 | ||||||||
| 2016-08-19 | 3 | none |
Dove Street Acquisition Corp
common stock |
20.000.000 | ||||||||
| 2016-08-19 | 3 | none |
Robin Street Acquisition Corp
common stock |
20.000.000 | ||||||||
| 2016-08-19 | 3 | none |
Robin Street Acquisition Corp
common stock |
20.000.000 | ||||||||
| 2016-08-19 | 3 | none |
Crow Street Acquisition Corp
common stock |
20.000.000 | ||||||||
| 2016-08-19 | 3 | none |
Crow Street Acquisition Corp
common stock |
20.000.000 | ||||||||
| 2016-08-19 | 3 | none |
Wren Street Acquisition Corp
common stock |
20.000.000 | ||||||||
| 2016-08-19 | 3 | none |
Wren Street Acquisition Corp
common stock |
20.000.000 | ||||||||
| 2016-08-19 | 3 | none |
Finch Street Acquisition Corp
common stock |
20.000.000 | ||||||||
| 2016-08-19 | 3 | none |
Finch Street Acquisition Corp
common stock |
20.000.000 | ||||||||
| 2016-08-19 | 3 | none |
Lark Street Acquisition Corp
common stock |
20.000.000 | ||||||||
| 2016-08-19 | 3 | none |
Lark Street Acquisition Corp
common stock |
20.000.000 | ||||||||
| 2016-08-19 | 3 | none |
Heron Street Acquisition Corp
common stock |
20.000.000 | ||||||||
| 2016-08-19 | 3 | none |
Heron Street Acquisition Corp
common stock |
20.000.000 | ||||||||
| 2016-08-19 | 3 | none |
Sparrow Street Acquisition Corp
common stock |
20.000.000 | ||||||||
| 2016-08-19 | 3 | none |
Sparrow Street Acquisition Corp
common stock |
20.000.000 | ||||||||
| 2016-08-19 | 3 | none |
Hawk Street Acquisition Corp
Common Stock |
20.000.000 | ||||||||
| 2016-08-19 | 3 | none |
Hawk Street Acquisition Corp
Common Stock |
20.000.000 | ||||||||
| 2016-07-25 |
|
4 | none |
Collins Island Acquisition Corp
common stock |
S - Sale | -9.750.000 | 250.000 | -97,50 | 975,00 | -9.506.250.000 | 243.750.000 | |
| 2016-07-25 |
|
4 | none |
Collins Island Acquisition Corp
common stock |
S - Sale | -9.750.000 | 250.000 | -97,50 | 975,00 | -9.506.250.000 | 243.750.000 | |
| 2016-07-14 |
|
4 | none |
Sherman Hill Acquisition Corp
common stock |
S - Sale | -9.750.000 | 250.000 | -97,50 | 975,00 | -9.506.250.000 | 243.750.000 | |
| 2016-07-14 |
|
4 | none |
UNITY GLOBAL HOLDINGS LTD.
common stock |
S - Sale | -7.500.000 | 2.500.000 | -75,00 | 750,00 | -5.625.000.000 | 1.875.000.000 | |
| 2016-06-29 |
|
4 | none |
Finn Power Energy Corp
common stock |
S - Sale | -9.750.000 | 250.000 | -97,50 | 975,00 | -9.506.250.000 | 243.750.000 | |
| 2016-05-31 |
|
4 | none |
Lepora Holdings, Inc.
common stock |
S - Sale | -9.750.000 | 250.000 | -97,50 | 975,00 | -9.506.250.000 | 243.750.000 | |
| 2016-05-23 |
|
4 | none |
Franklin Hill Acquisition Corp
common stock |
S - Sale | 9.750.000 | 250.000 | -102,63 | 975,00 | 9.506.250.000 | 243.750.000 | |
| 2016-05-18 | 3 | none |
Ruby Island Acquisition Corp
common stock |
20.000.000 | ||||||||
| 2016-05-18 | 3 | none |
Ruby Island Acquisition Corp
common stock |
20.000.000 | ||||||||
| 2016-05-18 | 3 | none |
Topaz Island Acquisition Corp
common stock |
20.000.000 | ||||||||
| 2016-05-18 | 3 | none |
Topaz Island Acquisition Corp
common stock |
20.000.000 | ||||||||
| 2016-05-17 |
|
4 | none |
Global Marine Minerals, Inc.
common stock |
S - Sale | -9.750.000 | 250.000 | -97,50 | 975,00 | -9.506.250.000 | 243.750.000 | |
| 2016-05-17 |
|
4 | none |
Kayak Ridge Acquisition Corp
common stock |
S - Sale | -9.700.000 | 300.000 | -97,00 | 970,00 | -9.409.000.000 | 291.000.000 | |
| 2016-05-17 | 3 | none |
Garnet Island Acquisition Corp
common stock |
20.000.000 | ||||||||
| 2016-05-17 | 3 | none |
Garnet Island Acquisition Corp
common stock |
20.000.000 | ||||||||
| 2016-05-17 | 3 | none |
Diamond Island Acquisition Corp
common stock |
20.000.000 | ||||||||
| 2016-05-17 | 3 | none |
Diamond Island Acquisition Corp
common stock |
20.000.000 | ||||||||
| 2016-05-17 | 3 | none |
Opal Island Acquisition Corp
common stock |
20.000.000 | ||||||||
| 2016-05-17 | 3 | none |
Opal Island Acquisition Corp
common stock |
20.000.000 | ||||||||
| 2016-05-17 | 3 | none |
Jade Island Acquisition Corp
common stock |
20.000.000 | ||||||||
| 2016-05-17 | 3 | none |
Jade Island Acquisition Corp
common stock |
20.000.000 | ||||||||
| 2016-05-17 | 3 | none |
Agate Island Acquisition Corp
common stock |
20.000.000 | ||||||||
| 2016-05-17 | 3 | none |
Agate Island Acquisition Corp
common stock |
20.000.000 | ||||||||
| 2016-05-17 | 3 | none |
Collins Island Acquisition Corp
common stock |
20.000.000 | ||||||||
| 2016-05-17 | 3 | none |
Collins Island Acquisition Corp
common stock |
20.000.000 | ||||||||
| 2016-05-17 | 3 | none |
Pearl Island Acquisition Corp
common stock |
20.000.000 | ||||||||
| 2016-05-17 | 3 | none |
Pearl Island Acquisition Corp
common stock |
20.000.000 | ||||||||
| 2016-05-17 | 3 | none |
Coral Island Acquisition Corp
common stock |
20.000.000 | ||||||||
| 2016-05-17 | 3 | none |
Coral Island Acquisition Corp
common stock |
20.000.000 | ||||||||
| 2016-04-22 |
|
4 | none |
Sella Care, Inc.
common stock |
S - Sale | -9.750.000 | 250.000 | -97,50 | 975,00 | -9.506.250.000 | 243.750.000 | |
| 2016-04-22 |
|
4 | none |
Soft iCastle, Inc.
common stock |
S - Sale | -9.750.000 | 250.000 | -97,50 | 975,00 | -9.506.250.000 | 243.750.000 | |
| 2016-04-22 |
|
4 | none |
Midas Real Estate Ventures Inc.
common stock |
S - Sale | -9.750.000 | 250.000 | -97,50 | 975,00 | -9.506.250.000 | 243.750.000 | |
| 2016-04-20 |
|
4 | none |
KT High-Tech Marketing Inc.
common stock |
S - Sale | -970.000 | 300.000 | -76,38 | 970,00 | -940.900.000 | 291.000.000 | |
| 2016-04-20 |
|
4 | none |
BookCoins Inc.
common stock |
S - Sale | -9.750.000 | 250.000 | -97,50 | 975,00 | -9.506.250.000 | 243.750.000 | |
| 2016-04-19 | 3 | none |
Sherman Hill Acquisition Corp
common stock |
20.000.000 | ||||||||
| 2016-04-19 | 3 | none |
Sherman Hill Acquisition Corp
common stock |
20.000.000 | ||||||||
| 2016-04-19 | 3 | none |
Scott Hill Acquisition Corp
common stock |
20.000.000 | ||||||||
| 2016-04-19 | 3 | none |
Scott Hill Acquisition Corp
common stock |
20.000.000 | ||||||||
| 2016-04-19 | 3 | none |
Perry Hill Acquisition Corp
common stock |
20.000.000 | ||||||||
| 2016-04-19 | 3 | none |
Perry Hill Acquisition Corp
common stock |
20.000.000 | ||||||||
| 2016-04-19 | 3 | none |
Lincoln Hill Acquisition Corp
common stock |
20.000.000 | ||||||||
| 2016-04-19 | 3 | none |
Lincoln Hill Acquisition Corp
common stock |
20.000.000 | ||||||||
| 2016-04-19 | 3 | none |
Grant Hill Acquisition Corp
common stock |
20.000.000 | ||||||||
| 2016-04-19 | 3 | none |
Grant Hill Acquisition Corp
common stock |
20.000.000 | ||||||||
| 2016-04-19 | 3 | none |
Jackson Hill Acquisition Corp
common stock |
20.000.000 | ||||||||
| 2016-04-19 | 3 | none |
Jackson Hill Acquisition Corp
common stock |
20.000.000 | ||||||||
| 2016-04-19 | 3 | none |
Franklin Hill Acquisition Corp
common stock |
20.000.000 | ||||||||
| 2016-04-19 | 3 | none |
Franklin Hill Acquisition Corp
common stock |
20.000.000 | ||||||||
| 2016-04-19 | 3 | none |
Burney Hill Acquisition Corp
common stock |
20.000.000 | ||||||||
| 2016-04-19 | 3 | none |
Burney Hill Acquisition Corp
common stock |
20.000.000 | ||||||||
| 2016-02-16 |
|
4 | none |
Universal Holdings & Consulting, Inc.
common stock |
S - Sale | -9.750.000 | 250.000 | -97,50 | 975,00 | -9.506.250.000 | 243.750.000 | |
| 2016-01-22 |
|
4 | none |
Camping Ridge Acquisition Corp
common stock |
S - Sale | 9.750.000 | 250.000 | -102,63 | 975,00 | 9.506.250.000 | 243.750.000 | |
| 2016-01-08 |
|
4 | none |
Khang Gia Holding, Inc.
common stock |
S - Sale | -9.750.000 | 250.000 | -97,50 | 975,00 | -9.506.250.000 | 243.750.000 | |
| 2016-01-08 |
|
4 | none |
Digital Donations Technologies, Inc.
common stock |
S - Sale | -9.750.000 | 250.000 | -97,50 | 975,00 | -9.506.250.000 | 243.750.000 | |
| 2015-11-30 |
|
4 | none |
A2M Regenerative Technologies, Inc.
common stock |
S - Sale | -9.750.000 | 250.000 | -97,50 | 975,00 | -9.506.250.000 | 243.750.000 | |
| 2015-11-03 |
|
4 | none |
Randolph Acquisitions, Inc.
common stock |
S - Sale | -9.750.000 | 250.000 | -97,50 | 975,00 | -9.506.250.000 | 243.750.000 | |
| 2015-10-20 |
|
4 | none |
Amchi Gendynamy Science Corp
common stock |
S - Sale | -9.750.000 | 250.000 | -97,50 | 975,00 | -9.506.250.000 | 243.750.000 | |
| 2015-09-28 | 3 | none |
Western Ridge Acquisition Corp
common stock |
20.000.000 | ||||||||
| 2015-09-28 | 3 | none |
Western Ridge Acquisition Corp
common stock |
20.000.000 | ||||||||
| 2015-09-28 | 3 | none |
Northern Ridge Acquisition Corp
common stock |
20.000.000 | ||||||||
| 2015-09-28 | 3 | none |
Northern Ridge Acquisition Corp
common stock |
20.000.000 | ||||||||
| 2015-09-28 | 3 | none |
Southern Ridge Acquisition Corp
common stock |
20.000.000 | ||||||||
| 2015-09-28 | 3 | none |
Southern Ridge Acquisition Corp
common stock |
20.000.000 | ||||||||
| 2015-09-28 | 3 | none |
Fishing Ridge Acquisition Corp
common stock |
20.000.000 | ||||||||
| 2015-09-28 | 3 | none |
Fishing Ridge Acquisition Corp
common stock |
20.000.000 | ||||||||
| 2015-09-28 | 3 | none |
Hiking Ridge Acquisition Corp
common stock |
20.000.000 | ||||||||
| 2015-09-28 | 3 | none |
Hiking Ridge Acquisition Corp
common stock |
20.000.000 | ||||||||
| 2015-09-28 | 3 | none |
Eastern Ridge Acquisition Corp
common stock |
20.000.000 | ||||||||
| 2015-09-28 | 3 | none |
Eastern Ridge Acquisition Corp
common stock |
20.000.000 | ||||||||
| 2015-09-28 | 3 | none |
Camping Ridge Acquisition Corp
common stock |
20.000.000 | ||||||||
| 2015-09-28 | 3 | none |
Camping Ridge Acquisition Corp
common stock |
20.000.000 | ||||||||
| 2015-09-28 | 3 | none |
Kayak Ridge Acquisition Corp
common stock |
20.000.000 | ||||||||
| 2015-09-28 | 3 | none |
Kayak Ridge Acquisition Corp
common stock |
20.000.000 | ||||||||
| 2015-09-28 | 3 | none |
Hunting Ridge Acquisition Corp
common stock |
20.000.000 | ||||||||
| 2015-09-28 | 3 | none |
Hunting Ridge Acquisition Corp
common stock |
20.000.000 | ||||||||
| 2015-09-24 |
|
4 | none |
Bristol Rhace Natural Resource Corp
common stock |
S - Sale | -9.750.000 | 250.000 | -97,50 | 975,00 | -9.506.250.000 | 243.750.000 | |
| 2015-09-22 |
|
4 | none |
Greenpro Resources Corp
common stock |
S - Sale | -9.850.000 | 150.000 | -98,50 | 985,00 | -9.702.250.000 | 147.750.000 | |
| 2015-09-22 |
|
4 | none |
Moxian Corp
common stock |
S - Sale | -9.850.000 | 150.000 | -98,50 | 985,00 | -9.702.250.000 | 147.750.000 | |
| 2015-09-22 |
|
4 | none |
OGL Holdings Ltd.
common stock |
S - Sale | 9.750.000 | 250.000 | -102,63 | 975,00 | 9.506.250.000 | 243.750.000 | |
| 2015-09-22 | 3 | none |
HEYU DEVELOPMENT & MANAGEMENT Corp
common stock |
20.000.000 | ||||||||
| 2015-09-22 | 3 | none |
HEYU DEVELOPMENT & MANAGEMENT Corp
common stock |
20.000.000 | ||||||||
| 2015-09-21 | 3 | none |
Axis Research & Technologies, Inc. (Delaware)
common stock |
20.000.000 | ||||||||
| 2015-09-21 | 3 | none |
Axis Research & Technologies, Inc. (Delaware)
common stock |
20.000.000 | ||||||||
| 2015-09-21 | 3 | none |
Nexus Resources Corp
common stock |
20.000.000 | ||||||||
| 2015-09-21 | 3 | none |
Nexus Resources Corp
common stock |
20.000.000 | ||||||||
| 2015-09-21 | 3 | none |
Nexus Data Security Corp
common stock |
20.000.000 | ||||||||
| 2015-09-21 | 3 | none |
Nexus Data Security Corp
common stock |
20.000.000 | ||||||||
| 2015-09-21 | 3 | none |
Questrust Ventures Inc.
common stock |
20.000.000 | ||||||||
| 2015-09-21 | 3 | none |
Questrust Ventures Inc.
common stock |
20.000.000 | ||||||||
| 2015-09-21 | 3 | none |
Engage Eco Solutions, Inc.
common s tock |
20.000.000 | ||||||||
| 2015-09-21 | 3 | none |
Engage Eco Solutions, Inc.
common s tock |
20.000.000 | ||||||||
| 2015-09-21 | 3 | none |
WHOLELIFE COMPANIES, INC.
common stock |
20.000.000 | ||||||||
| 2015-09-21 | 3 | none |
WHOLELIFE COMPANIES, INC.
common stock |
20.000.000 | ||||||||
| 2015-09-21 | 3 | none |
Delverton Resorts International Inc.
common stock |
20.000.000 | ||||||||
| 2015-09-21 | 3 | none |
Delverton Resorts International Inc.
common stock |
20.000.000 | ||||||||
| 2015-09-21 | 3 | none |
Nexus Data Technologies Corp
common stock |
20.000.000 | ||||||||
| 2015-09-21 | 3 | none |
Nexus Data Technologies Corp
common stock |
20.000.000 | ||||||||
| 2015-09-16 |
|
4 | none |
PowerComm Holdings Inc.
common stock |
S - Sale | -9.750.000 | 250.000 | -97,50 | 975,00 | -9.506.250.000 | 243.750.000 | |
| 2015-09-16 |
|
4 | none |
Brown Grotto Acquisition Corp
common stock |
S - Sale | -9.750.000 | 250.000 | -97,50 | 975,00 | -9.506.250.000 | 243.750.000 | |
| 2015-08-26 |
|
4 | none |
Hoverink International Holdings Inc.
common stock |
S - Sale | -9.750.000 | 250.000 | -97,50 | 975,00 | -9.506.250.000 | 243.750.000 | |
| 2015-08-26 |
|
4 | none |
American-Swiss Capital, Inc.
common stock |
S - Sale | -9.750.000 | 250.000 | -97,50 | 975,00 | -9.506.250.000 | 243.750.000 | |
| 2015-08-26 |
|
4 | none |
CannaMED Enterprises, Inc.
common stock |
S - Sale | -9.750.000 | 250.000 | -97,50 | 975,00 | -9.506.250.000 | 243.750.000 | |
| 2015-08-26 |
|
4 | none |
South West Coast Senior Living Corp
common stock |
S - Sale | -9.750.000 | 250.000 | -97,50 | 975,00 | -9.506.250.000 | 243.750.000 | |
| 2015-08-05 |
|
4 | none |
ECI Canada, Inc.
common stock |
S - Sale | -9.750.000 | 250.000 | -97,50 | 975,00 | -9.506.250.000 | 243.750.000 | |
| 2015-08-05 |
|
4 | none |
Elm Valley Acquisition Corp
common stock |
S - Sale | -9.750.000 | 250.000 | -97,50 | 975,00 | -9.506.250.000 | 243.750.000 | |
| 2015-07-14 |
|
4 | none |
NextGlass Technologies Corp.
common stock |
S - Sale | 9.750.000 | 250.000 | -102,63 | 975,00 | 9.506.250.000 | 243.750.000 | |
| 2015-06-03 |
|
4 | none |
Montbriar, Inc.
common stock |
P - Purchase | -9.750.000 | 250.000 | -97,50 | 975,00 | -9.506.250.000 | 243.750.000 | |
| 2015-06-03 |
|
4 | none |
USA Capital Management Inc.
common stock |
S - Sale | -10.000.000 | 0 | -100,00 | 1.000,00 | -10.000.000.000 | ||
| 2015-06-03 |
|
4 | none |
Fuda Group (USA) Corp
common stock |
S - Sale | -9.750.000 | 250.000 | -97,50 | 975,00 | -9.506.250.000 | 243.750.000 | |
| 2015-06-03 |
|
4 | none |
Summer Valley Acquisition Corp
common stock |
S - Sale | -9.750.000 | 250.000 | -97,50 | 975,00 | -9.506.250.000 | 243.750.000 | |
| 2015-06-03 | 3 | none |
Yellow Grotto Acquisition Corp
common stock |
20.000.000 | ||||||||
| 2015-06-03 | 3 | none |
Yellow Grotto Acquisition Corp
common stock |
20.000.000 | ||||||||
| 2015-06-03 | 3 | none |
Brown Grotto Acquisition Corp
common stock |
20.000.000 | ||||||||
| 2015-06-03 | 3 | none |
Brown Grotto Acquisition Corp
common stock |
20.000.000 | ||||||||
| 2015-06-03 | 3 | none |
Red Grotto Acquisition Corp
common stock |
20.000.000 | ||||||||
| 2015-06-03 | 3 | none |
Red Grotto Acquisition Corp
common stock |
20.000.000 | ||||||||
| 2015-06-03 | 3 | none |
Black Grotto Acquisition Corp
common stock |
20.000.000 | ||||||||
| 2015-06-03 | 3 | none |
Black Grotto Acquisition Corp
common stock |
20.000.000 | ||||||||
| 2015-06-03 | 3 | none |
White Grotto Acquisition Corp
common stock |
20.000.000 | ||||||||
| 2015-06-03 | 3 | none |
White Grotto Acquisition Corp
common stock |
20.000.000 | ||||||||
| 2015-06-03 | 3 | none |
Purple Grotto Acquisition Corp
common stock |
20.000.000 | ||||||||
| 2015-06-03 | 3 | none |
Purple Grotto Acquisition Corp
common stock |
20.000.000 | ||||||||
| 2015-06-02 |
|
4 | none |
Aquilarts, Inc.
common stock |
S - Sale | 8.750.000 | 1.250.000 | -116,67 | 875,00 | 7.656.250.000 | 1.093.750.000 | |
| 2015-06-01 |
|
4 | none |
Axis Research & Technologies, Inc. (Delaware)
common stock |
S - Sale | -9.750.000 | 250.000 | -97,50 | 975,00 | -9.506.250.000 | 243.750.000 | |
| 2015-02-25 |
|
4 | none |
Fuda Group (USA) Corp
common stock |
S - Sale | -19.750.000 | 250.000 | -98,75 | 1.975,00 | -39.006.250.000 | 493.750.000 | |
| 2015-01-21 | 3 | none |
Greys Corp
common stock |
20.000.000 | ||||||||
| 2015-01-21 | 3 | none |
Greys Corp
common stock |
20.000.000 | ||||||||
| 2015-01-21 |
|
4 | none |
SkyWolf Wind Turbine Corp
common stock |
S - Sale | -9.875.000 | 125.000 | -98,75 | 987,00 | -9.746.625.000 | 123.375.000 | |
| 2015-01-21 |
|
4 | none |
SkyWolf Wind Turbine Corp
common stock |
S - Sale | -9.875.999 | 125.000 | -98,75 | 987,00 | -9.747.611.013 | 123.375.000 | |
| 2015-01-20 | 3 | none |
Redwood Valley Acquisition Corp
common stock |
20.000.000 | ||||||||
| 2015-01-20 | 3 | none |
Redwood Valley Acquisition Corp
common stock |
20.000.000 | ||||||||
| 2015-01-20 | 3 | none |
Green Field Energy, Inc.
common stock |
20.000.000 | ||||||||
| 2015-01-20 | 3 | none |
Green Field Energy, Inc.
common stock |
20.000.000 | ||||||||
| 2015-01-20 | 3 | none |
Sea Valley Acquisition Corp
common stock |
20.000.000 | ||||||||
| 2015-01-20 | 3 | none |
Sea Valley Acquisition Corp
common stock |
20.000.000 | ||||||||
| 2015-01-20 | 3 | none |
T.A.G. Acquisitions Ltd.
common stock |
20.000.000 | ||||||||
| 2015-01-20 | 3 | none |
T.A.G. Acquisitions Ltd.
common stock |
20.000.000 | ||||||||
| 2015-01-20 | 3 | none |
Crane Global Energy Co
common stock |
20.000.000 | ||||||||
| 2015-01-20 | 3 | none |
Crane Global Energy Co
common stock |
20.000.000 | ||||||||
| 2015-01-20 | 3 | none |
Fox Valley Acquisition Corp
common stock |
20.000.000 | ||||||||
| 2015-01-20 | 3 | none |
Fox Valley Acquisition Corp
common stock |
20.000.000 | ||||||||
| 2015-01-20 | 3 | none |
SkyWolf Wind Turbine Corp
common stock |
20.000.000 | ||||||||
| 2015-01-20 | 3 | none |
SkyWolf Wind Turbine Corp
common stock |
20.000.000 | ||||||||
| 2015-01-20 | 3 | none |
Summer Valley Acquisition Corp
common stock |
20.000.000 | ||||||||
| 2015-01-20 | 3 | none |
Summer Valley Acquisition Corp
common stock |
20.000.000 | ||||||||
| 2015-01-20 | 3 | none |
Oak Valley Acquisition Corp
common stock |
20.000.000 | ||||||||
| 2015-01-20 | 3 | none |
Oak Valley Acquisition Corp
common stock |
20.000.000 | ||||||||
| 2015-01-20 | 3 | none |
Spruce Valley Acquisition Corp
common stock |
20.000.000 | ||||||||
| 2015-01-20 | 3 | none |
Spruce Valley Acquisition Corp
common stock |
20.000.000 | ||||||||
| 2015-01-20 | 3 | non3 |
Deer Valley Acquisition Corp
common stock |
20.000.000 | ||||||||
| 2015-01-20 | 3 | non3 |
Deer Valley Acquisition Corp
common stock |
20.000.000 | ||||||||
| 2015-01-20 | 3 | none |
Owl Valley Acquisition Corp
common stock |
20.000.000 | ||||||||
| 2015-01-20 | 3 | none |
Owl Valley Acquisition Corp
common stock |
20.000.000 | ||||||||
| 2015-01-20 |
|
4 | none |
Crane Global Energy Co
common stock |
S - Sale | -9.900.000 | 100.000 | -99,00 | 990,00 | -9.801.000.000 | 99.000.000 | |
| 2015-01-20 |
|
4 | none |
T.A.G. Acquisitions Ltd.
common stock |
S - Sale | -9.750.000 | 250.000 | -97,50 | 975,00 | -9.506.250.000 | 243.750.000 | |
| 2015-01-20 |
|
4 | none |
Sea Valley Acquisition Corp
common stock |
S - Sale | -9.800.000 | 200.000 | -98,00 | 980,00 | -9.604.000.000 | 196.000.000 | |
| 2015-01-20 |
|
4 | none |
Fall Valley ACquisition Corp
common stock |
S - Sale | -9.875.000 | 125.000 | -98,75 | 987,00 | -9.746.625.000 | 123.375.000 | |
| 2015-01-09 | 3 | none |
Pretty Valley Acquisition Corp
common stock |
20.000.000 | ||||||||
| 2015-01-09 | 3 | none |
Pretty Valley Acquisition Corp
common stock |
20.000.000 | ||||||||
| 2014-07-24 |
|
4 | none |
Smarter App World International Corp
common stock |
S - Sale | 9.750.000 | 250.000 | -102,63 | 975,00 | 9.506.250.000 | 243.750.000 | |
| 2014-06-23 |
|
4 | none |
Aquarius Agriculture Inc.
common stock |
S - Sale | -9.750.000 | 250.000 | -97,50 | 975,00 | -9.506.250.000 | 243.750.000 | |
| 2014-06-05 |
|
4 | none |
Chess Supersite Corp
common stock |
S - Sale | 9.750.000 | 250.000 | -102,63 | 975,00 | 9.506.250.000 | 243.750.000 | |
| 2014-06-05 |
|
4 | none |
SGREP Inc.
common stock |
P - Purchase | -9.750.000 | 250.000 | -97,50 | 975,00 | -9.506.250.000 | 243.750.000 | |
| 2014-06-05 |
|
4 | none |
Trail Run Acquisition Corp
common stock |
S - Sale | -10.000.000 | 0 | -100,00 | 1.000,00 | -10.000.000.000 | ||
| 2014-06-05 |
|
4 | none |
Natural Resources Corp
common stock |
S - Sale | 9.950.000 | 50.000 | -100,51 | 995,00 | 9.900.250.000 | 49.750.000 | |
| 2014-06-05 |
|
4 | none |
Fig Run Acquisition Corp
common stock |
S - Sale | -9.750.000 | 250.000 | -97,50 | 975,00 | -9.506.250.000 | 243.750.000 | |
| 2014-06-05 |
|
4 | none |
RS Soda Holdings Inc.
common stock |
S - Sale | 9.750.000 | 250.000 | -102,63 | 975,00 | 9.506.250.000 | 243.750.000 | |
| 2014-06-05 |
|
4 | none |
Gold Mountain, Inc.
common stock |
S - Sale | -9.750.000 | 250.000 | -97,50 | 975,00 | -9.506.250.000 | 243.750.000 | |
| 2014-04-15 |
|
4 | none |
Southern Labs Inc.
common stock |
S - Sale | -9.750.000 | 250.000 | -97,50 | 975,00 | -9.506.250.000 | 243.750.000 | |
| 2014-02-20 | 3 | none |
Peach Run Acquisition Corp
common stock |
20.000.000 | ||||||||
| 2014-02-20 | 3 | none |
Peach Run Acquisition Corp
common stock |
20.000.000 | ||||||||
| 2014-02-20 |
|
4 | none |
Questrust Ventures Inc.
common stock |
S - Sale | -10.000.000 | 0 | -100,00 | 1.000,00 | -10.000.000.000 | ||
| 2014-02-20 |
|
4 | none |
Engage Eco Solutions, Inc.
common stock |
S - Sale | 9.750.000 | 250.000 | -102,63 | 975,00 | 9.506.250.000 | 243.750.000 | |
| 2014-02-20 |
|
4 | none |
WHOLELIFE COMPANIES, INC.
common stock |
S - Sale | -9.750.000 | 250.000 | -97,50 | 975,00 | -9.506.250.000 | 243.750.000 | |
| 2014-02-20 |
|
4 | none |
Delverton Resorts International Inc.
common stock |
S - Sale | -9.750.000 | 250.000 | -97,50 | 975,00 | -9.506.250.000 | 243.750.000 | |
| 2014-02-20 |
|
4 | none |
Corvus Technologies Corp.
common stock |
S - Sale | -9.950.000 | 50.000 | -99,50 | 995,00 | -9.900.250.000 | 49.750.000 | |
| 2014-02-20 |
|
4 | none |
Sunstock, Inc.
common stock |
S - Sale | -9.750.000 | 250.000 | -97,50 | 975,00 | -9.506.250.000 | 243.750.000 | |
| 2014-02-20 |
|
4 | none |
Solis Pharma US, Inc.
common stock |
S - Sale | -9.800.000 | 200.000 | -98,00 | 980,00 | -9.604.000.000 | 196.000.000 | |
| 2014-02-20 |
|
4 | none |
Live Brands, Inc.
common stock |
S - Sale | -9.800.000 | 200.000 | -98,00 | 980,00 | -9.604.000.000 | 196.000.000 | |
| 2014-02-20 |
|
4 | none |
Fordgate Acquisition Corp
common stock |
S - Sale | -9.750.000 | 250.000 | -97,50 | 975,00 | -9.506.250.000 | 243.750.000 | |
| 2014-02-20 |
|
4 | none |
UPOD INC
common stock |
S - Sale | -9.950.000 | 50.000 | -99,50 | 995,00 | -9.900.250.000 | 49.750.000 | |
| 2014-02-20 |
|
4 | none |
1701 Productions, Inc.
common stock |
S - Sale | -9.750.000 | 250.000 | -97,50 | 975,00 | -9.506.250.000 | 243.750.000 | |
| 2014-02-19 | 3 | none |
Rock Run Acquisition Corp
common stock |
20.000.000 | ||||||||
| 2014-02-19 | 3 | none |
Rock Run Acquisition Corp
common stock |
20.000.000 | ||||||||
| 2014-02-19 | 3 | none |
Pebble Run Acquisition Corp
common stock |
20.000.000 | ||||||||
| 2014-02-19 | 3 | none |
Pebble Run Acquisition Corp
common stock |
20.000.000 | ||||||||
| 2014-02-19 | 3 | none |
Thunder Run Acquisition Corp
common stock |
20.000.000 | ||||||||
| 2014-02-19 | 3 | none |
Thunder Run Acquisition Corp
common stock |
20.000.000 | ||||||||
| 2014-02-19 |
|
4 | none |
Heyu Leisure Holidays Corp
common stock |
S - Sale | -10.000.000 | 0 | -100,00 | 1.000,00 | -10.000.000.000 | ||
| 2014-02-19 |
|
4 | none |
Nexus Data Security Corp
common stock |
S - Sale | -9.750.000 | 250.000 | -97,50 | 975,00 | -9.506.250.000 | 243.750.000 | |
| 2014-02-19 | 3 | none |
River Run Acquisition Corp
common s tock |
20.000.000 | ||||||||
| 2014-02-19 | 3 | none |
River Run Acquisition Corp
common s tock |
20.000.000 | ||||||||
| 2014-02-19 | 3 | none |
Path Run Acquisition Corp
common stock |
20.000.000 | ||||||||
| 2014-02-19 | 3 | none |
Path Run Acquisition Corp
common stock |
20.000.000 | ||||||||
| 2014-02-19 | 3 | none |
Trail Run Acquisition Corp
common stock |
20.000.000 | ||||||||
| 2014-02-19 | 3 | none |
Trail Run Acquisition Corp
common stock |
20.000.000 | ||||||||
| 2014-02-19 |
|
4 | none |
Alife Inc.
common stock |
S - Sale | -9.750.000 | 250.000 | -97,50 | 975,00 | -9.506.250.000 | 243.750.000 | |
| 2014-02-19 | 3 | none |
Plum Run Acquisition Corp
common stock |
20.000.000 | ||||||||
| 2014-02-19 | 3 | none |
Plum Run Acquisition Corp
common stock |
20.000.000 | ||||||||
| 2014-02-19 | 3 | none |
Fig Run Acquisition Corp
Common Stock |
20.000.000 | ||||||||
| 2014-02-19 | 3 | none |
Fig Run Acquisition Corp
Common Stock |
20.000.000 | ||||||||
| 2014-02-19 | 3 | none |
Orange Run Acquisition Corp
common stock |
20.000.000 | ||||||||
| 2014-02-19 | 3 | none |
Orange Run Acquisition Corp
common stock |
20.000.000 | ||||||||
| 2014-02-19 |
|
4 | none |
Nexus Resources Corp
common stock |
S - Sale | -9.750.000 | 250.000 | -97,50 | 975,00 | -9.506.250.000 | 243.750.000 | |
| 2014-02-19 | 3 | none |
Quince Run Acquisition Corp
common stock |
20.000.000 | ||||||||
| 2014-02-19 | 3 | none |
Quince Run Acquisition Corp
common stock |
20.000.000 | ||||||||
| 2014-02-19 |
|
4 | none |
Blow & Drive Interlock Corp
common stock |
S - Sale | -9.850.000 | 150.000 | -98,50 | 985,00 | -9.702.250.000 | 147.750.000 | |
| 2014-02-19 | 3 | none |
Sky Run Acqusition Corp
common stock |
20.000.000 | ||||||||
| 2014-02-19 | 3 | none |
Sky Run Acqusition Corp
common stock |
20.000.000 | ||||||||
| 2014-02-19 | 3 | none |
Storm Run Acquisition Corp
common stock |
20.000.000 | ||||||||
| 2014-02-19 | 3 | none |
Storm Run Acquisition Corp
common stock |
20.000.000 | ||||||||
| 2014-02-19 | 3 | none |
Pear Run Acquisition Corp
common stock |
20.000.000 | ||||||||
| 2014-02-19 | 3 | none |
Pear Run Acquisition Corp
common stock |
20.000.000 | ||||||||
| 2014-02-19 |
|
4 | none |
Nexus Data Technologies Corp
common stock |
S - Sale | -9.750.000 | 250.000 | -97,50 | 975,00 | -9.506.250.000 | 243.750.000 | |
| 2013-06-26 |
|
4 | none |
Percipience Global Corp
common stock |
S - Sale | -9.750.000 | 250.000 | -97,50 | 975,00 | -9.506.250.000 | 243.750.000 | |
| 2013-06-26 |
|
4 | none |
Essential Telecommunications, Inc.
common stock |
S - Sale | -9.750.000 | 250.000 | -97,50 | 975,00 | -9.506.250.000 | 243.750.000 | |
| 2013-06-26 |
|
4 | none |
Woodgate Energy Corp
common stock |
S - Sale | -9.750.000 | 250.000 | -97,50 | 975,00 | -9.506.250.000 | 243.750.000 | |
| 2013-06-24 |
|
4 | none |
JMJP Partners, Inc.
common stock |
S - Sale | 9.750.000 | 250.000 | -102,63 | 975,00 | 9.506.250.000 | 243.750.000 | |
| 2013-03-01 |
|
5 | none |
IIM Global Corp
common stock |
S - Sale | -9.750.000 | 250.000 | -97,50 | 975,00 | -9.506.250.000 | 243.750.000 | |
| 2013-01-23 | 3 | none |
Sandgate Acquisition Corp
common stock |
10.000.000 | ||||||||
| 2013-01-23 | 3 | none |
Wallgate Acquisition Corp
common stock |
10.000.000 | ||||||||
| 2013-01-23 | 3 | none |
Treegate Acquisition Corp
common stock |
10.000.000 | ||||||||
| 2013-01-23 | 3 | none |
Harrogate Acquisition Corp
common stock |
10.000.000 | ||||||||
| 2013-01-23 | 3 | none |
Fordgate Acquisition Corp
common stock |
10.000.000 | ||||||||
| 2013-01-23 | 3 | none |
Beachgate Acquisition Corp
common stock |
10.000.000 | ||||||||
| 2013-01-23 | 3 | none |
Backgate Acquisition Corp
Common Stock |
10.000.000 | ||||||||
| 2013-01-23 | 3 | none |
Sidegate Acquisition Corp
common stock |
10.000.000 | ||||||||
| 2013-01-23 | 3 | none |
Tablegate Acquisition Corp
common stock |
10.000.000 | ||||||||
| 2013-01-23 | 3 | none |
Woodgate Acquisition Corp
common stock |
10.000.000 | ||||||||
| 2012-09-13 | 3 | none |
Whiffletree Acquisition Corp
common stock |
10.000.000 | ||||||||
| 2012-09-13 | 3 | none |
Sagetree Acquisition Corp
common stock |
10.000.000 | ||||||||
| 2012-09-13 | 3 | none |
Gumtree Acquisition Corp
common stock |
10.000.000 | ||||||||
| 2012-09-13 | 3 | none |
Entree Acquisition Corp
common stock |
10.000.000 | ||||||||
| 2012-07-31 | 3 | none |
Timberwood Acquisition Corp
common stock |
10.000.000 | ||||||||
| 2012-07-31 |
|
4 | none |
Timberwood Acquisition Corp
common stock |
S - Sale | -9.750.000 | 250.000 | -97,50 | 975,00 | -9.506.250.000 | 243.750.000 | |
| 2012-07-31 |
|
4 | none |
Bio Oil National Corp
common stock |
S - Sale | -9.750.000 | 250.000 | -97,50 | 975,00 | -9.506.250.000 | 243.750.000 | |
| 2012-07-31 | 3 | none |
Bio Oil National Corp
common stock |
10.000.000 | ||||||||
| 2012-07-31 | 3 | none |
Hardwood Acquisition Corp
common stock |
10.000.000 | ||||||||
| 2012-07-31 | 3 | none |
Lightwood Acquisition Corp
common stock |
10.000.000 | ||||||||
| 2012-07-31 |
|
4 | none |
Rezilient Direct Corp
common stock |
S - Sale | -9.750.000 | 250.000 | -97,50 | 975,00 | -9.506.250.000 | 243.750.000 | |
| 2012-07-31 | 3 | none |
Rezilient Direct Corp
common stock |
10.000.000 | ||||||||
| 2012-07-31 |
|
4 | none |
Yellowwood Acquisition Corp
common stock |
S - Sale | -9.750.000 | 250.000 | -97,50 | 975,00 | -9.506.250.000 | 243.750.000 | |
| 2012-07-31 | 3 | none |
Yellowwood Acquisition Corp
common stock |
10.000.000 | ||||||||
| 2012-07-31 | 3 | none |
Silverwood Acquisition Corp
common stock |
10.000.000 | ||||||||
| 2012-07-31 |
|
4 | none |
XTREME HEALTHCARE Corp
common stock |
S - Sale | -9.750.000 | 250.000 | -97,50 | 975,00 | -9.506.250.000 | 243.750.000 | |
| 2012-07-31 | 3 | none |
XTREME HEALTHCARE Corp
common stock |
10.000.000 | ||||||||
| 2012-07-31 |
|
4 | none |
AMERICAN LASER HEALTHCARE Corp
common stock |
S - Sale | -9.750.000 | 250.000 | -97,50 | 975,00 | -9.506.250.000 | 243.750.000 | |
| 2012-07-31 | 3 | none |
AMERICAN LASER HEALTHCARE Corp
common stock |
10.000.000 | ||||||||
| 2012-07-31 |
|
4 | none |
Rosewood Acquisition Corp
common stock |
S - Sale | -9.750.000 | 250.000 | -97,50 | 975,00 | -9.506.250.000 | 243.750.000 | |
| 2012-07-31 | 3 | none |
Rosewood Acquisition Corp
common stock |
10.000.000 | ||||||||
| 2012-07-31 |
|
4 | none |
MOOSEWOOD ACQUISITION Corp
common stock |
S - Sale | -9.750.000 | 250.000 | -97,50 | 975,00 | -9.506.250.000 | 243.750.000 |
P
Offener Markt oder privater Kauf von nicht-derivativen oder derivativen Wertpapieren
S
Freiverkauf oder privater Verkauf von nicht-derivativen oder derivativen Wertpapieren
A
Gewährung, Vergabe oder sonstiger Erwerb von Wertpapieren des Unternehmens (z. B. eine Option)
C
Umwandlung von Derivaten
D
Verkauf oder Rückübertragung von Wertpapieren an das Unternehmen
F
Zahlung des Ausübungspreises oder der Steuerschuld mit einem Teil der vom Unternehmen erhaltenen Wertpapiere
G
Schenkung von Wertpapieren durch oder an den Insider
K
Aktien-Swaps und ähnliche Absicherungstransaktionen
M
Ausübung oder Umwandlung eines vom Unternehmen erhaltenen derivativen Wertpapiers (z. B. einer Option)
V
Eine freiwillig auf Formular 4 gemeldete Transaktion
J
Sonstige (mit einer Fußnote zur Beschreibung der Transaktion)