General Motors Company
In portfolio
Einführung
Diese Seite bietet eine umfassende Analyse des bekannten Insiderhandels von Michael P Millikin. Insider sind leitende Angestellte, Direktoren oder bedeutende Investoren in einem Unternehmen. Es ist für Insider illegal, auf der Grundlage bestimmter, nicht öffentlicher Informationen mit ihren Unternehmen zu handeln. Das bedeutet nicht, dass es für sie illegal ist, irgendwelche Geschäfte in ihren eigenen Unternehmen zu tätigen. Sie müssen jedoch alle Geschäfte der SEC über ein Formular 4 melden. Trotz dieser Einschränkungen deuten akademische Untersuchungen darauf hin, dass Insider im Allgemeinen dazu neigen, den Markt in ihren eigenen Unternehmen zu übertreffen.
Durchschnittliche Handelsrentabilität
Die durchschnittliche Handelsrentabilität ist die durchschnittliche Rendite aller offenen Marktkäufe, die der Insider in den letzten drei Jahren getätigt hat. Um dies zu berechnen, untersuchen wir jeden ungeplanten Kauf, den der Insider auf dem offenen Markt getätigt hat, mit Ausnahme aller Geschäfte, die als Teil eines 10b5-1-Handelsplans gekennzeichnet waren. Anschließend berechnen wir die durchschnittliche Performance dieser Geschäfte über 3, 6 und 12 Monate, wobei wir für jeden dieser Zeiträume den Durchschnitt bilden, um eine endgültige Performance-Kennzahl für jedes Geschäft zu erhalten. Schließlich berechnen wir den Durchschnitt aller Performance-Metriken, um eine Performance-Metrik für den Insider zu ermitteln. Diese Liste enthält nur Insider, die in den letzten zwei Jahren mindestens drei Geschäfte getätigt haben.
Wenn die Rentabilität der Handelsgeschäfte dieses Insiders als „N/A“ (nicht verfügbar) ausgewiesen wird, hat der Insider entweder in den letzten drei Jahren keine Käufe am freien Markt getätigt, oder die durchgeführten Transaktionen liegen zu kurz zurück, um eine verlässliche Leistungskennzahl zu berechnen.
Aktualisierungshäufigkeit: Täglich
Sehen Sie sich die Liste der profitabelsten Insiderhändler an.
Unternehmen mit gemeldeten Insider-Positionen
Aus den SEC-Meldungen geht hervor, dass Michael P Millikin Bestände oder Transaktionen bei den folgenden Unternehmen gemeldet hat:
| Sicherheit | Titel | Zuletzt gemeldete Bestände |
|---|---|---|
| US:GM / General Motors Company | Senior Advisor | 8.017 |
So interpretieren Sie die Diagramme
Die folgenden Diagramme zeigen die Wertentwicklung von Wertpapieren im Anschluss an jeden am freien Markt getätigten, nicht geplanten Handel durch Michael P Millikin. Als nicht geplante Geschäfte gelten Transaktionen, die nicht im Rahmen eines 10b5-1-Handelsplans durchgeführt wurden. Die Wertentwicklung wird als kumulierte prozentuale Veränderung des Aktienkurses dargestellt. Wenn beispielsweise am 1. Januar 2019 ein Insidergeschäft stattfand, zeigt das Diagramm die tägliche prozentuale Veränderung des Wertpapiers bis zum heutigen Tag. Würde sich der Aktienkurs in diesem Zeitraum von 10 $ auf 15 $ verändern, läge die kumulierte prozentuale Kursänderung bei 50 %. Eine Kursänderung von 10 $ auf 20 $ entspräche 100 %, und eine Änderung von 10 $ auf 5 $ entspräche -50 %.
Letztendlich wollen wir ermitteln, wie stark die Handelsaktivitäten des Insiders mit Überrenditen (positiv oder negativ) beim Aktienkurs korrelieren, um festzustellen, ob der Insider seine Transaktionen so steuert, dass er von Insiderinformationen profitiert. Betrachten wir den Fall, dass ein Insider genau dies tut. In einer solchen Situation wären entweder (a) positive Renditen nach Käufen oder (b) negative Renditen nach Verkäufen zu erwarten. Im Fall (a) würde das Diagramm für Käufe eine Reihe von Kurvenverläufen mit Aufwärtstrend zeigen, was auf positive Renditen nach jeder Kauftransaktion hindeutet. Im Fall (b) würde das Diagramm für Verkäufe eine Reihe von Kurvenverläufen mit Abwärtstrend zeigen, was auf negative Renditen nach jeder Verkaufstransaktion hinweist.
Dies allein reicht jedoch nicht aus, um Schlussfolgerungen zu ziehen. Wenn sich der Aktienkurs des Unternehmens beispielsweise über viele Jahre hinweg in einem nicht-zyklischen Aufwärtstrend befand, dann würden wir erwarten, dass alle Nach-Kauf-Kurven aufwärts gerichtet sind. Ebenso würden nicht-zyklische Rückgänge über viele Jahre hinweg zu abwärts geneigten Nachhandelsdiagrammen führen. Keines dieser Diagramme würde auf Insiderhandel hindeuten.
Der stärkste Indikator wäre eine Situation, in der der Aktienkurs extrem zyklisch verläuft und sowohl positive Signale im Kauf-Chart als auch negative Ausschläge im Verkaufs-Chart zu verzeichnen sind. Ein solches Szenario würde stark auf einen Insider hindeuten, der seine Transaktionen zu seinem finanziellen Vorteil zeitlich steuert.
Insiderkäufe GM / General Motors Company – Analyse kurzfristiger Gewinne
In diesem Abschnitt analysieren wir die Rentabilität jedes ungeplanten Insiderkaufs am freien Markt, der in GM / General Motors Company getätigt wurde. Diese Analyse hilft zu verstehen, ob der Insider beständig Überrenditen erzielt und ob es sich lohnt, seinen Aktivitäten zu folgen. Die Analyse bezieht sich auf den Zeitraum von einem Jahr nach jedem Handel, und die Ergebnisse sind theoretischer Natur.
Die folgende Tabelle zeigt die jüngsten Käufe am freien Markt, die nicht Teil eines automatischen Handelsplans waren.
| Handelstag | Ticker | Insider | Berichtete Aktien |
Berichteter Preis |
Angepasste Aktien |
Angepasster Preis |
Anschaffungskostenbasis | Tage bis Max |
Preis bei Max |
Max Gewinn ($) |
Maximale Rendite (%) |
|---|---|---|---|---|---|---|---|
| Es sind keine ungeplanten Börsengeschäfte für diese Kombination aus Insider und Wertpapier bekannt. |
Angepasster Preis ist der an den Split angepasste Preis. Angepasste Aktien ist die an den Split angepasste Anzahl der Aktien.
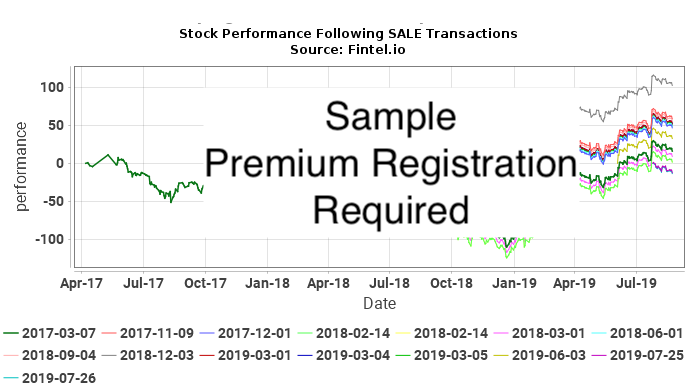
Insiderverkäufe GM / General Motors Company – Analyse kurzfristiger Verluste
In diesem Abschnitt analysieren wir die kurzfristige Vermeidung von Verlusten bei jedem ungeplanten Insiderverkauf am freien Markt, der in GM / General Motors Company getätigt wurde. Ein konsistentes Muster bei der Vermeidung von Verlusten könnte darauf hindeuten, dass zukünftige Verkäufe Kursrückgänge vorhersagen können. Diese Analyse bezieht sich auf den Zeitraum von einem Jahr nach jeder Transaktion, und die Ergebnisse sind theoretischer Natur.
Die folgende Tabelle zeigt die jüngsten Verkäufe am freien Markt, die nicht Teil eines automatischen Handelsplans waren.
| Handelstag | Ticker | Insider | Berichtete Aktien |
Berichteter Preis |
Angepasste Aktien |
Angepasster Preis |
Anschaffungskostenbasis | Tage bis Min. |
Preis bei Min. |
Maximaler Verlust Vermieden ($) |
Maximaler Verlust Vermieden (%) |
|---|---|---|---|---|---|---|---|---|---|---|---|
| 2013-05-15 | GM | Millikin Michael P | 7.924 | 32,3100 | 7.924 | 32,3100 | 256.024 | 40 | 31.42 | -7.052 | -2,75 |
Angepasster Preis ist der an den Split angepasste Preis. Angepasste Aktien ist die an den Split angepasste Anzahl der Aktien.
Geschichte des Insiderhandels
Diese Tabelle zeigt die vollständige Liste der von Michael P Millikin getätigten Insidergeschäfte, wie sie der Securities and Exchange Commission (SEC) gemeldet wurden.
| Dateidatum | Transaktionsdatum | Formular | Ticker | Sicherheit | Code | Aktien | Verbleibende Aktien | Prozent Änderung |
Aktie Preis |
Tran Wert |
Verbleibender Wert |
|
|---|---|---|---|---|---|---|---|---|---|---|---|---|
| 2015-04-02 |
|
4 | GM |
General Motors Co
Salary Stock Units |
M - Exercise | -8.018 | 8.017 | -50,00 | ||||
| 2015-04-02 |
|
4 | GM |
General Motors Co
Salary Stock Units |
M - Exercise | -8.322 | 0 | -100,00 | ||||
| 2015-04-02 |
|
4 | GM |
General Motors Co
Common Stock |
F - Taxes | -3.804 | 84.242 | -4,32 | 37,75 | -143.601 | 3.180.136 | |
| 2015-04-02 |
|
4 | GM |
General Motors Co
Common Stock |
D - Sale to Issuer | -4.214 | 88.046 | -4,57 | 37,75 | -159.078 | 3.323.736 | |
| 2015-04-02 |
|
4 | GM |
General Motors Co
Common Stock |
M - Exercise | 8.018 | 92.260 | 9,52 | ||||
| 2015-04-02 |
|
4 | GM |
General Motors Co
Common Stock |
F - Taxes | -3.948 | 84.242 | -4,48 | 37,75 | -149.037 | 3.180.136 | |
| 2015-04-02 |
|
4 | GM |
General Motors Co
Common Stock |
D - Sale to Issuer | -4.374 | 88.190 | -4,73 | 37,75 | -165.118 | 3.329.172 | |
| 2015-04-02 |
|
4 | GM |
General Motors Co
Common Stock |
M - Exercise | 8.322 | 92.564 | 9,88 | ||||
| 2015-02-17 |
|
4 | GM |
General Motors Co
Restricted Stock Units |
M - Exercise | -4.903 | 9.805 | -33,34 | ||||
| 2015-02-17 |
|
4 | GM |
General Motors Co
Common Stock |
F - Taxes | -2.325 | 84.242 | -2,69 | 37,62 | -87.466 | 3.169.184 | |
| 2015-02-17 |
|
4 | GM |
General Motors Co
Common Stock |
M - Exercise | 4.903 | 86.567 | 6,00 | ||||
| 2015-02-13 |
|
4 | GM |
General Motors Co
Restricted Stock Units |
A - Award | 14.103 | 14.103 | |||||
| 2015-01-05 |
|
4 | GM |
General Motors Co
Restricted Stock Units |
M - Exercise | -58.191 | 0 | -100,00 | ||||
| 2015-01-05 |
|
4 | GM |
General Motors Co
Salary Stock Units |
M - Exercise | -8.473 | 0 | -100,00 | ||||
| 2015-01-05 |
|
4 | GM |
General Motors Co
Salary Stock Units |
M - Exercise | -7.166 | 7.165 | -50,00 | ||||
| 2015-01-05 |
|
4 | GM |
General Motors Co
Salary Stock Units |
M - Exercise | -5.575 | 11.149 | -33,34 | ||||
| 2015-01-05 |
|
4 | GM |
General Motors Co
Common Stock |
F - Taxes | -23.543 | 81.664 | -22,38 | 35,17 | -828.007 | 2.872.123 | |
| 2015-01-05 |
|
4 | GM |
General Motors Co
Common Stock |
D - Sale to Issuer | -34.648 | 105.207 | -24,77 | 35,17 | -1.218.570 | 3.700.130 | |
| 2015-01-05 |
|
4 | GM |
General Motors Co
Common Stock |
M - Exercise | 58.191 | 139.855 | 71,26 | ||||
| 2015-01-05 |
|
4 | GM |
General Motors Co
Common Stock |
F - Taxes | -4.017 | 81.664 | -4,69 | 35,17 | -141.278 | 2.872.123 | |
| 2015-01-05 |
|
4 | GM |
General Motors Co
Common Stock |
D - Sale to Issuer | -4.456 | 85.681 | -4,94 | 35,17 | -156.718 | 3.013.401 | |
| 2015-01-05 |
|
4 | GM |
General Motors Co
Common Stock |
M - Exercise | 8.473 | 90.137 | 10,38 | ||||
| 2015-01-05 |
|
4 | GM |
General Motors Co
Common Stock |
F - Taxes | -3.397 | 81.664 | -3,99 | 35,17 | -119.472 | 2.872.123 | |
| 2015-01-05 |
|
4 | GM |
General Motors Co
Common Stock |
D - Sale to Issuer | -3.769 | 85.061 | -4,24 | 35,17 | -132.556 | 2.991.595 | |
| 2015-01-05 |
|
4 | GM |
General Motors Co
Common Stock |
M - Exercise | 7.166 | 88.830 | 8,77 | ||||
| 2015-01-05 |
|
4 | GM |
General Motors Co
Common Stock |
F - Taxes | -2.643 | 81.664 | -3,13 | 35,17 | -92.954 | 2.872.123 | |
| 2015-01-05 |
|
4 | GM |
General Motors Co
Common Stock |
D - Sale to Issuer | -2.932 | 84.307 | -3,36 | 35,17 | -103.118 | 2.965.077 | |
| 2015-01-05 |
|
4 | GM |
General Motors Co
Common Stock |
M - Exercise | 5.575 | 87.239 | 6,83 | ||||
| 2014-10-02 |
|
4 | GM |
General Motors Co
Salary Stock Units |
M - Exercise | -8.436 | 0 | -100,00 | ||||
| 2014-10-02 |
|
4 | GM |
General Motors Co
Salary Stock Units |
M - Exercise | -8.839 | 8.839 | -50,00 | ||||
| 2014-10-02 |
|
4 | GM |
General Motors Co
Salary Stock Units |
M - Exercise | -6.325 | 12.650 | -33,33 | ||||
| 2014-10-02 |
|
4 | GM |
General Motors Co
Common Stock |
F - Taxes | -3.999 | 81.664 | -4,67 | 32,11 | -128.408 | 2.622.231 | |
| 2014-10-02 |
|
4 | GM |
General Motors Co
Common Stock |
D - Sale to Issuer | -4.437 | 85.663 | -4,92 | 32,11 | -142.472 | 2.750.639 | |
| 2014-10-02 |
|
4 | GM |
General Motors Co
Common Stock |
M - Exercise | 8.436 | 90.100 | 10,33 | ||||
| 2014-10-02 |
|
4 | GM |
General Motors Co
Common Stock |
F - Taxes | -4.190 | 81.664 | -4,88 | 32,11 | -134.541 | 2.622.231 | |
| 2014-10-02 |
|
4 | GM |
General Motors Co
Common Stock |
D - Sale to Issuer | -4.649 | 85.854 | -5,14 | 32,11 | -149.279 | 2.756.772 | |
| 2014-10-02 |
|
4 | GM |
General Motors Co
Common Stock |
M - Exercise | 8.839 | 90.503 | 10,82 | ||||
| 2014-10-02 |
|
4 | GM |
General Motors Co
Common Stock |
F - Taxes | -2.998 | 81.664 | -3,54 | 32,11 | -96.266 | 2.622.231 | |
| 2014-10-02 |
|
4 | GM |
General Motors Co
Common Stock |
D - Sale to Issuer | -3.327 | 84.662 | -3,78 | 32,11 | -106.830 | 2.718.497 | |
| 2014-10-02 |
|
4 | GM |
General Motors Co
Common Stock |
M - Exercise | 6.325 | 87.989 | 7,75 | ||||
| 2014-07-02 |
|
4 | GM |
General Motors Co
Salary Stock Units |
M - Exercise | -5.635 | 0 | -100,00 | ||||
| 2014-07-02 |
|
4 | GM |
General Motors Co
Salary Stock Units |
M - Exercise | -10.321 | 10.321 | -50,00 | ||||
| 2014-07-02 |
|
4 | GM |
General Motors Co
Salary Stock Units |
M - Exercise | -6.841 | 13.680 | -33,34 | ||||
| 2014-07-02 |
|
4 | GM |
General Motors Co
Common Stock |
F - Taxes | -2.671 | 81.664 | -3,17 | 36,44 | -97.331 | 2.975.836 | |
| 2014-07-02 |
|
4 | GM |
General Motors Co
Common Stock |
D - Sale to Issuer | -2.964 | 84.335 | -3,40 | 36,44 | -108.008 | 3.073.167 | |
| 2014-07-02 |
|
4 | GM |
General Motors Co
Common Stock |
M - Exercise | 5.635 | 87.299 | 6,90 | ||||
| 2014-07-02 |
|
4 | GM |
General Motors Co
Common Stock |
F - Taxes | -4.892 | 81.664 | -5,65 | 36,44 | -178.264 | 2.975.836 | |
| 2014-07-02 |
|
4 | GM |
General Motors Co
Common Stock |
D - Sale to Issuer | -5.429 | 86.556 | -5,90 | 36,44 | -197.833 | 3.154.101 | |
| 2014-07-02 |
|
4 | GM |
General Motors Co
Common Stock |
M - Exercise | 10.321 | 91.985 | 12,64 | ||||
| 2014-07-02 |
|
4 | GM |
General Motors Co
Common Stock |
F - Taxes | -3.243 | 81.664 | -3,82 | 36,44 | -118.175 | 2.975.836 | |
| 2014-07-02 |
|
4 | GM |
General Motors Co
Common Stock |
D - Sale to Issuer | -3.598 | 84.907 | -4,07 | 36,44 | -131.111 | 3.094.011 | |
| 2014-07-02 |
|
4 | GM |
General Motors Co
Common Stock |
M - Exercise | 6.841 | 88.505 | 8,38 | ||||
| 2014-06-13 |
|
4 | GM |
General Motors Co
Restricted Stock Units |
A - Award | 14.708 | 14.708 | |||||
| 2014-04-02 |
|
4 | GM |
General Motors Co
Restricted Stock Units |
A - Award | 58.191 | 58.191 | |||||
| 2014-04-02 |
|
4 | GM |
General Motors Co
Salary Stock Units |
M - Exercise | -5.475 | 0 | -100,00 | ||||
| 2014-04-02 |
|
4 | GM |
General Motors Co
Salary Stock Units |
M - Exercise | -8.322 | 8.322 | -50,00 | ||||
| 2014-04-02 |
|
4 | GM |
General Motors Co
Salary Stock Units |
M - Exercise | -8.018 | 16.035 | -33,33 | ||||
| 2014-04-02 |
|
4 | GM |
General Motors Co
Common Stock |
F - Taxes | -2.597 | 81.664 | -3,08 | 34,37 | -89.259 | 2.806.792 | |
| 2014-04-02 |
|
4 | GM |
General Motors Co
Common Stock |
D - Sale to Issuer | -2.878 | 84.261 | -3,30 | 34,37 | -98.917 | 2.896.051 | |
| 2014-04-02 |
|
4 | GM |
General Motors Co
Common Stock |
M - Exercise | 5.475 | 87.139 | 6,70 | ||||
| 2014-04-02 |
|
4 | GM |
General Motors Co
Common Stock |
F - Taxes | -3.948 | 81.664 | -4,61 | 34,37 | -135.693 | 2.806.792 | |
| 2014-04-02 |
|
4 | GM |
General Motors Co
Common Stock |
D - Sale to Issuer | -4.374 | 85.612 | -4,86 | 34,37 | -150.334 | 2.942.484 | |
| 2014-04-02 |
|
4 | GM |
General Motors Co
Common Stock |
M - Exercise | 8.322 | 89.986 | 10,19 | ||||
| 2014-04-02 |
|
4 | GM |
General Motors Co
Common Stock |
F - Taxes | -3.804 | 81.664 | -4,45 | 34,37 | -130.743 | 2.806.792 | |
| 2014-04-02 |
|
4 | GM |
General Motors Co
Common Stock |
D - Sale to Issuer | -4.214 | 85.468 | -4,70 | 34,37 | -144.835 | 2.937.535 | |
| 2014-04-02 |
|
4 | GM |
General Motors Co
Common Stock |
M - Exercise | 8.018 | 89.682 | 9,82 | ||||
| 2014-02-12 |
|
4 | GM |
General Motors Co
Restricted Stock Units |
M - Exercise | -13.858 | 4.620 | -75,00 | ||||
| 2014-02-12 |
|
4 | GM |
General Motors Co
Common Stock |
F - Taxes | -5.442 | 81.664 | -6,25 | 35,27 | -191.939 | 2.880.289 | |
| 2014-02-12 |
|
4 | GM |
General Motors Co
Common Stock |
M - Exercise | 13.858 | 87.106 | 18,92 | ||||
| 2014-01-03 |
|
4 | GM |
General Motors Co
Salary Stock Units |
A - Award | 16.724 | 16.724 | |||||
| 2014-01-03 |
|
4 | GM |
General Motors Co
Salary Stock Units |
M - Exercise | -2.169 | 0 | -100,00 | ||||
| 2014-01-03 |
|
4 | GM |
General Motors Co
Salary Stock Units |
M - Exercise | -8.474 | 8.473 | -50,00 | ||||
| 2014-01-03 |
|
4 | GM |
General Motors Co
Salary Stock Units |
M - Exercise | -7.166 | 14.331 | -33,33 | ||||
| 2014-01-03 |
|
4 | GM |
General Motors Co
Common Stock |
F - Taxes | -711 | 73.248 | -0,96 | 40,81 | -29.016 | 2.989.251 | |
| 2014-01-03 |
|
4 | GM |
General Motors Co
Common Stock |
D - Sale to Issuer | -1.458 | 73.959 | -1,93 | 40,81 | -59.501 | 3.018.267 | |
| 2014-01-03 |
|
4 | GM |
General Motors Co
Common Stock |
M - Exercise | 2.169 | 75.417 | 2,96 | ||||
| 2014-01-03 |
|
4 | GM |
General Motors Co
Common Stock |
F - Taxes | -2.885 | 73.248 | -3,79 | 40,81 | -117.737 | 2.989.251 | |
| 2014-01-03 |
|
4 | GM |
General Motors Co
Common Stock |
D - Sale to Issuer | -5.589 | 76.133 | -6,84 | 40,81 | -228.087 | 3.106.988 | |
| 2014-01-03 |
|
4 | GM |
General Motors Co
Common Stock |
M - Exercise | 8.474 | 81.722 | 11,57 | ||||
| 2014-01-03 |
|
4 | GM |
General Motors Co
Common Stock |
F - Taxes | -2.350 | 73.248 | -3,11 | 40,81 | -95.904 | 2.989.251 | |
| 2014-01-03 |
|
4 | GM |
General Motors Co
Common Stock |
D - Sale to Issuer | -4.816 | 75.598 | -5,99 | 40,81 | -196.541 | 3.085.154 | |
| 2014-01-03 |
|
4 | GM |
General Motors Co
Common Stock |
M - Exercise | 7.166 | 80.414 | 9,78 | ||||
| 2013-11-12 |
|
4 | GM |
General Motors Co
Restricted Stock Units |
D - Sale to Issuer | -5.900 | 5.900 | -50,00 | ||||
| 2013-11-12 |
|
4 | GM |
General Motors Co
Common Stock |
F - Taxes | -2.797 | 73.248 | -3,68 | 36,33 | -101.615 | 2.661.100 | |
| 2013-11-12 |
|
4 | GM |
General Motors Co
Common Stock |
M - Exercise | 5.900 | 76.045 | 8,41 | ||||
| 2013-10-01 |
|
4 | GM |
General Motors Co
Salary Stock Units |
A - Award | 18.975 | 18.975 | |||||
| 2013-10-01 |
|
4 | GM |
General Motors Co
Salary Stock Units |
M - Exercise | -4.431 | 0 | -100,00 | ||||
| 2013-10-01 |
|
4 | GM |
General Motors Co
Salary Stock Units |
M - Exercise | -8.436 | 8.436 | -50,00 | ||||
| 2013-10-01 |
|
4 | GM |
General Motors Co
Salary Stock Units |
M - Exercise | -8.839 | 17.678 | -33,33 | ||||
| 2013-10-01 |
|
4 | GM |
General Motors Co
Common Stock |
F - Taxes | -2.331 | 70.145 | -3,22 | 35,97 | -83.846 | 2.523.116 | |
| 2013-10-01 |
|
4 | GM |
General Motors Co
Common Stock |
D - Sale to Issuer | -2.100 | 72.476 | -2,82 | 35,97 | -75.537 | 2.606.962 | |
| 2013-10-01 |
|
4 | GM |
General Motors Co
Common Stock |
M - Exercise | 4.431 | 74.576 | 6,32 | ||||
| 2013-10-01 |
|
4 | GM |
General Motors Co
Common Stock |
F - Taxes | -4.437 | 70.145 | -5,95 | 35,97 | -159.599 | 2.523.116 | |
| 2013-10-01 |
|
4 | GM |
General Motors Co
Common Stock |
D - Sale to Issuer | -3.999 | 74.582 | -5,09 | 35,97 | -143.844 | 2.682.715 | |
| 2013-10-01 |
|
4 | GM |
General Motors Co
Common Stock |
M - Exercise | 8.436 | 78.581 | 12,03 | ||||
| 2013-10-01 |
|
4 | GM |
General Motors Co
Common Stock |
F - Taxes | -4.649 | 70.145 | -6,22 | 35,97 | -167.225 | 2.523.116 | |
| 2013-10-01 |
|
4 | GM |
General Motors Co
Common Stock |
D - Sale to Issuer | -4.190 | 74.794 | -5,30 | 35,97 | -150.714 | 2.690.340 | |
| 2013-10-01 |
|
4 | GM |
General Motors Co
Common Stock |
M - Exercise | 8.839 | 78.984 | 12,60 | ||||
| 2013-07-02 |
|
4 | GM |
General Motors Co
Salary Stock Units |
A - Award | 2.255 | 2.255 | |||||
| 2013-07-02 |
|
4 | GM |
General Motors Co
Salary Stock Units |
A - Award | 20.521 | 20.521 | |||||
| 2013-07-02 |
|
4 | GM |
General Motors Co
Salary Stock Units |
M - Exercise | -4.431 | 0 | -100,00 | ||||
| 2013-07-02 |
|
4 | GM |
General Motors Co
Salary Stock Units |
M - Exercise | -5.635 | 5.635 | -50,00 | ||||
| 2013-07-02 |
|
4 | GM |
General Motors Co
Salary Stock Units |
M - Exercise | -10.322 | 20.642 | -33,34 | ||||
| 2013-07-02 |
|
4 | GM |
General Motors Co
Common Stock |
F - Taxes | -2.330 | 70.145 | -3,21 | 33,26 | -77.496 | 2.333.023 | |
| 2013-07-02 |
|
4 | GM |
General Motors Co
Common Stock |
D - Sale to Issuer | -2.101 | 72.475 | -2,82 | 33,26 | -69.879 | 2.410.518 | |
| 2013-07-02 |
|
4 | GM |
General Motors Co
Common Stock |
M - Exercise | 4.431 | 74.576 | 6,32 | ||||
| 2013-07-02 |
|
4 | GM |
General Motors Co
Common Stock |
F - Taxes | -2.964 | 70.145 | -4,05 | 33,26 | -98.583 | 2.333.023 | |
| 2013-07-02 |
|
4 | GM |
General Motors Co
Common Stock |
D - Sale to Issuer | -2.671 | 73.109 | -3,52 | 33,26 | -88.837 | 2.431.605 | |
| 2013-07-02 |
|
4 | GM |
General Motors Co
Common Stock |
M - Exercise | 5.635 | 75.780 | 8,03 | ||||
| 2013-07-02 |
|
4 | GM |
General Motors Co
Common Stock |
F - Taxes | -5.429 | 70.145 | -7,18 | 33,26 | -180.569 | 2.333.023 | |
| 2013-07-02 |
|
4 | GM |
General Motors Co
Common Stock |
D - Sale to Issuer | -4.893 | 75.574 | -6,08 | 33,26 | -162.741 | 2.513.591 | |
| 2013-07-02 |
|
4 | GM |
General Motors Co
Common Stock |
M - Exercise | 10.322 | 80.467 | 14,72 | ||||
| 2013-05-17 |
|
4 | GM |
General Motors Co
Common Stock |
S - Sale | -7.924 | 70.145 | -10,15 | 32,31 | -256.024 | 2.266.385 | |
| 2013-05-17 |
|
4/A | GM |
General Motors Co
Salary Stock Units |
A - Award | 21.798 | 21.798 | |||||
| 2013-05-17 |
|
4/A | GM |
General Motors Co
Salary Stock Units |
M - Exercise | -4.431 | 0 | -100,00 | ||||
| 2013-05-17 |
|
4/A | GM |
General Motors Co
Salary Stock Units |
M - Exercise | -5.475 | 5.475 | -50,00 | ||||
| 2013-05-17 |
|
4/A | GM |
General Motors Co
Salary Stock Units |
M - Exercise | -8.322 | 16.644 | -33,33 | ||||
| 2013-05-17 |
|
4/A | GM |
General Motors Co
Common Stock |
F - Taxes | -2.977 | 78.069 | -3,67 | 27,87 | -82.969 | 2.175.783 | |
| 2013-05-17 |
|
4/A | GM |
General Motors Co
Common Stock |
D - Sale to Issuer | -1.454 | 81.046 | -1,76 | 27,87 | -40.523 | 2.258.752 | |
| 2013-05-17 |
|
4/A | GM |
General Motors Co
Common Stock |
M - Exercise | 4.431 | 82.500 | 5,68 | ||||
| 2013-05-17 |
|
4/A | GM |
General Motors Co
Common Stock |
F - Taxes | -3.679 | 78.069 | -4,50 | 27,87 | -102.534 | 2.175.783 | |
| 2013-05-17 |
|
4/A | GM |
General Motors Co
Common Stock |
D - Sale to Issuer | -1.796 | 81.748 | -2,15 | 27,87 | -50.055 | 2.278.317 | |
| 2013-05-17 |
|
4/A | GM |
General Motors Co
Common Stock |
M - Exercise | 5.475 | 83.544 | 7,01 | ||||
| 2013-05-17 |
|
4/A | GM |
General Motors Co
Common Stock |
F - Taxes | -5.591 | 78.069 | -6,68 | 27,87 | -155.821 | 2.175.783 | |
| 2013-05-17 |
|
4/A | GM |
General Motors Co
Common Stock |
D - Sale to Issuer | -2.731 | 83.660 | -3,16 | 27,87 | -76.113 | 2.331.604 | |
| 2013-05-17 |
|
4/A | GM |
General Motors Co
Common Stock |
M - Exercise | 8.322 | 86.391 | 10,66 | ||||
| 2013-04-02 |
|
4 | GM |
General Motors Co
Salary Stock Units |
A - Award | 21.798 | 21.798 | |||||
| 2013-04-02 |
|
4 | GM |
General Motors Co
Salary Stock Units |
M - Exercise | -4.431 | 0 | -100,00 | ||||
| 2013-04-02 |
|
4 | GM |
General Motors Co
Salary Stock Units |
M - Exercise | -5.475 | 5.475 | -50,00 | ||||
| 2013-04-02 |
|
4 | GM |
General Motors Co
Salary Stock Units |
M - Exercise | -8.322 | 16.644 | -33,33 | ||||
| 2013-04-02 |
|
4 | GM |
General Motors Co
Common Stock |
F - Taxes | -2.977 | 70.145 | -4,07 | 27,87 | -82.969 | 1.954.941 | |
| 2013-04-02 |
|
4 | GM |
General Motors Co
Common Stock |
D - Sale to Issuer | -1.454 | 73.122 | -1,95 | 27,87 | -40.523 | 2.037.910 | |
| 2013-04-02 |
|
4 | GM |
General Motors Co
Common Stock |
M - Exercise | 4.431 | 74.576 | 6,32 | ||||
| 2013-04-02 |
|
4 | GM |
General Motors Co
Common Stock |
F - Taxes | -3.679 | 70.145 | -4,98 | 27,87 | -102.534 | 1.954.941 | |
| 2013-04-02 |
|
4 | GM |
General Motors Co
Common Stock |
D - Sale to Issuer | -1.796 | 73.824 | -2,38 | 27,87 | -50.055 | 2.057.475 | |
| 2013-04-02 |
|
4 | GM |
General Motors Co
Common Stock |
M - Exercise | 5.475 | 75.620 | 7,81 | ||||
| 2013-04-02 |
|
4 | GM |
General Motors Co
Common Stock |
F - Taxes | -5.591 | 70.145 | -7,38 | 27,87 | -155.821 | 1.954.941 | |
| 2013-04-02 |
|
4 | GM |
General Motors Co
Common Stock |
D - Sale to Issuer | -2.731 | 75.736 | -3,48 | 27,87 | -76.113 | 2.110.762 | |
| 2013-04-02 |
|
4 | GM |
General Motors Co
Common Stock |
M - Exercise | 8.322 | 78.467 | 11,86 | ||||
| 2013-03-19 |
|
4 | GM |
General Motors Co
Restricted Stock Units |
D - Sale to Issuer | -11.801 | 11.800 | -50,00 | ||||
| 2013-03-19 |
|
4 | GM |
General Motors Co
Common Stock |
D - Sale to Issuer | -3.877 | 78.069 | -4,73 | 28,03 | -108.672 | 2.188.274 | |
| 2013-03-19 |
|
4 | GM |
General Motors Co
Common Stock |
M - Exercise | 11.801 | 81.946 | 16,82 | ||||
| 2013-01-03 |
|
4 | GM |
General Motors Co
Salary Stock Units |
A - Award | 21.497 | 21.497 | |||||
| 2013-01-03 |
|
4 | GM |
General Motors Co
Salary Stock Units |
M - Exercise | -1.866 | 0 | -100,00 | ||||
| 2013-01-03 |
|
4 | GM |
General Motors Co
Salary Stock Units |
M - Exercise | -2.169 | 2.169 | -50,00 | ||||
| 2013-01-03 |
|
4 | GM |
General Motors Co
Salary Stock Units |
M - Exercise | -8.474 | 16.947 | -33,33 | ||||
| 2013-01-03 |
|
4 | GM |
General Motors Co
Common Stock |
F - Taxes | -613 | 70.145 | -0,87 | 28,26 | -17.323 | 1.982.298 | |
| 2013-01-03 |
|
4 | GM |
General Motors Co
Common Stock |
D - Sale to Issuer | -1.253 | 70.758 | -1,74 | 28,26 | -35.410 | 1.999.621 | |
| 2013-01-03 |
|
4 | GM |
General Motors Co
Common Stock |
M - Exercise | 1.866 | 72.011 | 2,66 | ||||
| 2013-01-03 |
|
4 | GM |
General Motors Co
Common Stock |
F - Taxes | -713 | 70.145 | -1,01 | 28,26 | -20.149 | 1.982.298 | |
| 2013-01-03 |
|
4 | GM |
General Motors Co
Common Stock |
D - Sale to Issuer | -1.456 | 70.858 | -2,01 | 28,26 | -41.147 | 2.002.447 | |
| 2013-01-03 |
|
4 | GM |
General Motors Co
Common Stock |
M - Exercise | 2.169 | 72.314 | 3,09 | ||||
| 2013-01-03 |
|
4 | GM |
General Motors Co
Common Stock |
F - Taxes | -2.721 | 70.145 | -3,73 | 28,26 | -76.895 | 1.982.298 | |
| 2013-01-03 |
|
4 | GM |
General Motors Co
Common Stock |
D - Sale to Issuer | -5.753 | 72.866 | -7,32 | 28,26 | -162.580 | 2.059.193 | |
| 2013-01-03 |
|
4 | GM |
General Motors Co
Common Stock |
M - Exercise | 8.474 | 78.619 | 12,08 | ||||
| 2012-10-02 |
|
4 | GM |
General Motors Co
Salary Stock Units |
A - Award | 26.517 | 26.517 | |||||
| 2012-10-02 |
|
4 | GM |
General Motors Co
Salary Stock Units |
M - Exercise | -1.866 | 0 | -100,00 | ||||
| 2012-10-02 |
|
4 | GM |
General Motors Co
Salary Stock Units |
D - Sale to Issuer | -4.434 | 4.431 | -50,02 | 22,91 | -101.583 | 101.514 | |
| 2012-10-02 |
|
4 | GM |
General Motors Co
Salary Stock Units |
M - Exercise | -8.436 | 16.872 | -33,33 | ||||
| 2012-10-02 |
|
4 | GM |
General Motors Co
Common Stock |
F - Taxes | -597 | 70.145 | -0,84 | 22,91 | -13.677 | 1.607.022 | |
| 2012-10-02 |
|
4 | GM |
General Motors Co
Common Stock |
D - Sale to Issuer | -1.269 | 70.742 | -1,76 | 22,91 | -29.073 | 1.620.699 | |
| 2012-10-02 |
|
4 | GM |
General Motors Co
Common Stock |
M - Exercise | 1.866 | 72.011 | 2,66 | ||||
| 2012-10-02 |
|
4 | GM |
General Motors Co
Common Stock |
F - Taxes | -1.417 | 70.145 | -1,98 | 22,91 | -32.463 | 1.607.022 | |
| 2012-10-02 |
|
4 | GM |
General Motors Co
Common Stock |
D - Sale to Issuer | -3.017 | 71.562 | -4,05 | 22,91 | -69.119 | 1.639.485 | |
| 2012-10-02 |
|
4 | GM |
General Motors Co
Common Stock |
M - Exercise | 4.434 | 74.579 | 6,32 | ||||
| 2012-10-02 |
|
4 | GM |
General Motors Co
Common Stock |
F - Taxes | -2.696 | 70.145 | -3,70 | 22,91 | -61.765 | 1.607.022 | |
| 2012-10-02 |
|
4 | GM |
General Motors Co
Common Stock |
D - Sale to Issuer | -5.740 | 72.841 | -7,30 | 22,91 | -131.503 | 1.668.787 | |
| 2012-10-02 |
|
4 | GM |
General Motors Co
Common Stock |
M - Exercise | 8.436 | 78.581 | 12,03 | ||||
| 2012-07-03 |
|
4 | GM |
General Motors Co
Salary Stock Units |
A - Award | 4.779 | 4.779 | |||||
| 2012-07-03 |
|
4 | GM |
General Motors Co
Salary Stock Units |
A - Award | 30.964 | 30.964 | |||||
| 2012-07-03 |
|
4 | GM |
General Motors Co
Salary Stock Units |
M - Exercise | -1.866 | 0 | -100,00 | ||||
| 2012-07-03 |
|
4 | GM |
General Motors Co
Salary Stock Units |
M - Exercise | -4.434 | 4.431 | -50,02 | ||||
| 2012-07-03 |
|
4 | GM |
General Motors Co
Salary Stock Units |
M - Exercise | -5.636 | 11.270 | -33,34 | ||||
| 2012-07-03 |
|
4 | GM |
General Motors Co
Common Stock |
F - Taxes | -599 | 70.145 | -0,85 | 19,62 | -11.752 | 1.376.245 | |
| 2012-07-03 |
|
4 | GM |
General Motors Co
Common Stock |
D - Sale to Issuer | -1.267 | 70.744 | -1,76 | 19,62 | -24.859 | 1.387.997 | |
| 2012-07-03 |
|
4 | GM |
General Motors Co
Common Stock |
M - Exercise | 1.866 | 72.011 | 2,66 | ||||
| 2012-07-03 |
|
4 | GM |
General Motors Co
Common Stock |
F - Taxes | -1.422 | 70.145 | -1,99 | 19,62 | -27.900 | 1.376.245 | |
| 2012-07-03 |
|
4 | GM |
General Motors Co
Common Stock |
D - Sale to Issuer | -3.012 | 71.567 | -4,04 | 19,62 | -59.095 | 1.404.145 | |
| 2012-07-03 |
|
4 | GM |
General Motors Co
Common Stock |
M - Exercise | 4.434 | 74.579 | 6,32 | ||||
| 2012-07-03 |
|
4 | GM |
General Motors Co
Common Stock |
F - Taxes | -1.807 | 70.145 | -2,51 | 19,62 | -35.453 | 1.376.245 | |
| 2012-07-03 |
|
4 | GM |
General Motors Co
Common Stock |
D - Sale to Issuer | -3.829 | 71.952 | -5,05 | 19,62 | -75.125 | 1.411.698 | |
| 2012-07-03 |
|
4 | GM |
General Motors Co
Common Stock |
M - Exercise | 5.636 | 75.781 | 8,03 | ||||
| 2012-04-03 |
|
4 | GM |
General Motors Co
Salary Stock Units |
A - Award | 20.187 | 20.187 | |||||
| 2012-04-03 |
|
4 | GM |
General Motors Co
Salary Stock Units |
M - Exercise | -1.866 | 0 | -100,00 | ||||
| 2012-04-03 |
|
4 | GM |
General Motors Co
Salary Stock Units |
M - Exercise | -4.434 | 4.431 | -50,02 | ||||
| 2012-04-03 |
|
4 | GM |
General Motors Co
Salary Stock Units |
M - Exercise | -5.475 | 10.950 | -33,33 | ||||
| 2012-04-03 |
|
4 | GM |
General Motors Co
Common Stock |
F - Taxes | -599 | 70.145 | -0,85 | 25,45 | -15.245 | 1.785.190 | |
| 2012-04-03 |
|
4 | GM |
General Motors Co
Common Stock |
D - Sale to Issuer | -1.267 | 70.744 | -1,76 | 25,45 | -32.245 | 1.800.435 | |
| 2012-04-03 |
|
4 | GM |
General Motors Co
Common Stock |
M - Exercise | 1.866 | 72.011 | 2,66 | ||||
| 2012-04-03 |
|
4 | GM |
General Motors Co
Common Stock |
F - Taxes | -1.422 | 70.145 | -1,99 | 25,45 | -36.190 | 1.785.190 | |
| 2012-04-03 |
|
4 | GM |
General Motors Co
Common Stock |
D - Sale to Issuer | -3.012 | 71.567 | -4,04 | 25,45 | -76.655 | 1.821.380 | |
| 2012-04-03 |
|
4 | GM |
General Motors Co
Common Stock |
M - Exercise | 4.434 | 74.579 | 6,32 | ||||
| 2012-04-03 |
|
4 | GM |
General Motors Co
Common Stock |
F - Taxes | -1.755 | 70.145 | -2,44 | 25,45 | -44.665 | 1.785.190 | |
| 2012-04-03 |
|
4 | GM |
General Motors Co
Common Stock |
D - Sale to Issuer | -3.720 | 71.900 | -4,92 | 25,45 | -94.674 | 1.829.855 | |
| 2012-04-03 |
|
4 | GM |
General Motors Co
Common Stock |
M - Exercise | 5.475 | 75.620 | 7,81 | ||||
| 2012-03-07 |
|
4 | GM |
General Motors Co
Common Stock |
D - Sale to Issuer | -2.656 | 70.145 | -3,65 | 26,25 | -69.720 | 1.841.306 | |
| 2012-03-07 |
|
4 | GM |
General Motors Co
Common Stock |
D - Sale to Issuer | -6.344 | 72.801 | -8,02 | 26,24 | -166.467 | 1.910.298 | |
| 2012-01-04 |
|
4 | GM |
General Motors Co
Salary Stock Units |
D - Sale to Issuer | -2.170 | 4.338 | -33,34 | ||||
| 2012-01-04 |
|
4 | GM |
General Motors Co
Salary Stock Units |
D - Sale to Issuer | -1.866 | 1.866 | -50,00 | ||||
| 2012-01-04 |
|
4 | GM |
General Motors Co
Common Stock |
M - Exercise | 25.421 | 79.145 | 47,32 | ||||
| 2012-01-04 |
|
4 | GM |
General Motors Co
Common Stock |
F - Taxes | -787 | 53.724 | -1,44 | 20,21 | -15.905 | 1.085.762 | |
| 2012-01-04 |
|
4 | GM |
General Motors Co
Common Stock |
M - Exercise | 2.170 | 54.511 | 4,15 | ||||
| 2012-01-04 |
|
4 | GM |
General Motors Co
Common Stock |
F - Taxes | -677 | 52.341 | -1,28 | 20,21 | -13.682 | 1.057.812 | |
| 2012-01-04 |
|
4 | GM |
General Motors Co
Common Stock |
M - Exercise | 1.866 | 53.018 | 3,65 |
P
Erwerb eines Nicht-Derivats oder Derivats am freien Markt oder im Wege eines Privatkaufs
S
Verkauf eines Nicht-Derivats oder Derivats am freien Markt oder im Wege einer Privatplatzierung
A
Gewährung, Zuteilung oder sonstiger Erwerb von Wertpapieren von der Gesellschaft (wie etwa einer Option)
C
Umwandlung eines Derivats
D
Verkauf oder Übertragung von Wertpapieren an das Unternehmen
F
Begleichung des Ausübungspreises oder der Steuerschuld unter Verwendung eines Teils der vom Unternehmen erhaltenen Wertpapiere
G
Schenkung von Wertpapieren durch den Insider oder an den Insider
K
Aktienswaps und ähnliche Absicherungsgeschäfte
M
Ausübung oder Wandlung eines von der Gesellschaft erhaltenen derivativen Wertpapiers (wie etwa einer Option)
V
Eine auf Formular 4 freiwillig gemeldete Transaktion
J
Sonstiges (versehen mit einer Fußnote, die die Transaktion beschreibt)


