| Ausstehende Aktien | 2,807,986 shares |
| Insider-Aktien | 1.444.904 shares |
| Insider-Besitz | 51,46 % |
| Insider gesamt | 44 |
Insider-Stimmungswert
Der Insider-Stimmungswert ermittelt die Unternehmen, die von Unternehmensinsidern gekauft werden.
Es ist das Ergebnis eines ausgeklügelten quantitativen Multifaktormodells, das die Unternehmen mit der höchsten Insiderakkumulation identifiziert. Das Scoring-Modell verwendet eine Kombination aus der Nettozahl der Insiderkäufe der letzten 90 Tage, der Gesamtzahl der gekauften Aktien als Prozentsatz des Streubesitzes und der Gesamtzahl der von Insidern gehaltenen Aktien. Die Zahl reicht von 0 bis 100, wobei höhere Zahlen ein höheres Maß an Insiderkäufen anzeigen als bei anderen Unternehmen und 50 den Durchschnitt darstellt.
Aktualisierungshäufigkeit: Täglich
Führungskräfte-Stimmungswert
Der Führungskräfte-Stimmungswert findet Unternehmen, die von Führungskräften des Unternehmens gekauft werden.
Per Definition sind Führungskräfte des Unternehmens Insider, aber im Gegensatz zu anderen Insidern (10%ige Aktionäre und Vorstandsmitglieder) arbeiten Führungskräfte täglich für das Unternehmen und verwenden beim Handel ihr eigenes Geld. (10%ige Aktionäre und Vorstandsmitglieder sind oft Fondsmanager, die das Geld anderer Leute verwalten.) Daher sind Insider-Geschäfte, die von Führungskräften getätigt werden, viel bedeutender und sollten entsprechend behandelt werden.
Wie der Insider-Stimmungswert ist auch der Führungskräfte-Stimmungswert das Ergebnis eines ausgeklügelten quantitativen Multifaktormodells, das die Unternehmen mit der höchsten Führungskräftekonzentration identifiziert.
Aktualisierungshäufigkeit: Täglich
Wichtige Insider-Kennzahlen
Diese Karte zeigt, wie das Unternehmen bei verschiedenen Insider-Kennzahlen abschneidet. Der Perzentil-Rang zeigt, wie dieses Unternehmen im Vergleich zu anderen Unternehmen auf den US-Märkten abschneidet. Höhere Ränge deuten auf eine bessere Situation hin.
Es ist beispielsweise allgemein anerkannt, dass Insiderkäufe ein positiver Indikator sind, so dass Unternehmen mit mehr Insiderkäufen besser abschneiden würden als Unternehmen mit weniger Insiderkäufen (oder sogar Insiderverkäufen).
Prozent des Streubesitzes von Insidern gekauft (Rang)
8735 out of 10752
Prozent des von Insidern gekauften Streubesitzes ist die Gesamtzahl der von Insidern gekauften Aktien abzüglich der Gesamtzahl der von Insidern in den letzten 90 Tagen verkauften Aktien, geteilt durch den gesamten Streubesitz und multipliziert mit 100.
Diagramm zum Insiderhandel
SeaChange International, Inc. Insider-Trades sind in der folgenden Grafik dargestellt. Insider sind leitende Angestellte, Direktoren oder bedeutende Investoren in einem Unternehmen. Im Allgemeinen ist es für Insider illegal, auf der Grundlage von wesentlichen, nicht-öffentlichen Informationen mit Aktien ihrer Unternehmen zu handeln. Das bedeutet nicht, dass es für sie illegal ist, irgendwelche Geschäfte in ihren eigenen Unternehmen zu tätigen. Sie müssen jedoch alle Geschäfte der SEC über ein Formular 4 melden.
Kennzahlen zu Insiderlisten und Rentabilität
Diese Tabelle zeigt die Liste der bekannten Insider und wird automatisch aus den bei der SEC eingereichten Unterlagen erstellt. Zusätzlich zu den Namen, dem letzten Titel und der Bezeichnung als Direktor, leitender Angestellter oder 10%-iger Anteilseigner geben wir die zuletzt veröffentlichten Bestände an. Zusätzlich stellen wir, wenn möglich, die historische Handelsperformance für den Insider zur Verfügung. Die historische Handelsperformance ist ein gewichteter Durchschnitt der Performance tatsächlicher offener Kauftransaktionen, die von dem Insider getätigt wurden. Weitere Informationen zur Berechnung dieses Wertes finden Sie in diesem YouTube-Webinar.
See our leaderboard of most profitable insider traders.
| Insider | Durchschnittlicher Gewinn (%) | Aktien in Besitz |
Split Angepasst |
|---|---|---|---|
| Peter D Aquino C.E.O. & Chairman of the Board, Director - [D] [O] | 1.481.937 | 74.097 | |
| Yosef Aloni President & C.E.O., Director - [D] [O] | 82.953 | 4.148 | |
|
Wayne Jr Barr
10% Owner -
|
2.569.820 | 128.491 | |
| Mark J Bonney Director - [D] | 304.866 | 15.243 | |
| Michael D Bornak Chief Financial Officer - [O] | 12.987 | 649 | |
|
CCUR Holdings, Inc.
10% Owner -
|
2.569.820 | 128.491 | |
| Steven Craddock Director - [D] | 149.926 | 7.496 | |
| Mary Palermo Cotton Director - [D] | 248.676 | 12.434 | |
| Steven M Davi CTO,SVP,Advanced Technologies - [O] | 61.185 | 3.059 | |
| Anthony Dias Chief Financial Officer - [O] | 108.597 | 5.430 | |
| Faubert Peter R. Chief Financial Officer - [O] | 61.952 | 3.098 | |
| Peter A Feld Director - [D] | 22.650 | 1.132 | |
| Ira Goldfarb Exec VP, WW Sales & Services - [O] | 146.102 | 7.305 | |
| Hassler Chad A. Chief Commercial Officer - [O] | 18.571 | 929 |
| Insider | Durchschnittlicher Gewinn (%) | Aktien in Besitz |
Split Angepasst |
|---|---|---|---|
| Anthony W Kelly CEO of ODG - [O] | 5.424 | 271 | |
| Marek Kielczewski Chief Technology Officer - [O] | 456.116 | 22.806 | |
| Christoph Klimmer President & C.E.O., Director - [D] [O] | 39.616 | 39.616 | |
| William Francis III Markey Director - [D] | 194.632 | 9.732 | |
| David McEvoy SVP, General Counsel & Sec. - [O] | 115.854 | 5.793 | |
| Kathleen Mosher Chief Financial Officer - [O] | 120.174 | 6.009 | |
| David J Nicol Director - [D] | 626.253 | 31.313 | |
| Thomas F Olson Director - [D] | 196.972 | 9.849 | |
| Robert M Pons Executive Chairman, Director - [D] [O] | 744.772 | 37.239 | |
| Michael Prinn Chief Financial Officer - [O] | 10.971 | 549 | |
| Raghavendra Rau Chief Executive Officer - [O] | 203.710 | 10.186 | |
| Rider Jonathan W. Chief Operating Officer - [O] | 46.062 | 2.303 | |
| Jay A Samit Chief Executive Officer, Director - [D] [O] | 214.871 | 10.744 | |
| Singer Julian D. Director - [D] | 353.801 | 17.690 | |
|
Karen Singer
10% Owner -
|
739.985 | 739.985 |
| Insider | Durchschnittlicher Gewinn (%) | Aktien in Besitz |
Split Angepasst |
|---|---|---|---|
| Steven G Singer Director - [D] | 583.355 | 29.168 | |
| Eric Singer - | 1.603.783 | 80.189 | |
| Andrew Sriubas Director - [D] | 262.188 | 13.109 | |
| Matthew Stecker Director - [D] | 592.885 | 29.644 | |
| Mark Paul Szynkowski SVP, CFO and Treasurer - [O] | 120.000 | 6.000 | |
| Edward Terino Chief Executive Officer, Director - [D] [O] | 405.909 | 20.295 | |
| Jeffrey Tuder Director - [D] | 310.815 | 15.541 | |
|
VIEX Capital Advisors, LLC
10% Owner -
|
1.603.783 | 80.189 | |
|
Viex Gp, Llc
10% Owner -
|
1.603.783 | 80.189 | |
|
VIEX Opportunities Fund, LP Series One
10% Owner -
|
1.603.783 | 80.189 | |
|
VIEX Special Opportunities Fund II, LP
10% Owner -
|
1.603.783 | 80.189 | |
|
VIEX Special Opportunities GP II, LLC
10% Owner -
|
1.603.783 | 80.189 | |
| Carmine Vona Director - [D] | 146.610 | 7.330 | |
| Igor Volshteyn Director - [D] | 560.320 | 28.016 | |
| Wilson Royce E. Director - [D] | 160.360 | 8.018 |
Report errors via our new Insider Auditing Tool
Erfolgsbilanz der Insiderkäufe - Kurzfristige Gewinnanalyse
In diesem Abschnitt analysieren wir die Rentabilität jedes ungeplanten Insiderkaufs, der auf dem freien Markt in SEAC / SeaChange International, Inc. getätigt wurde. Diese Analyse hilft zu verstehen, ob der Insider beständig abnormale Renditen erzielt und es sich lohnt, ihm zu folgen. Diese Analyse bezieht sich auf ein Jahr nach jedem Handel, und die Ergebnisse sind theoretisch .
Die folgende Tabelle zeigt die jüngsten Käufe am offenen Markt, die nicht Teil eines automatischen Handelsplans waren.
Bereinigter Preis ist der splitbereinigte Preis. Bereinigte Aktien sind die um den Split bereinigten Aktien.
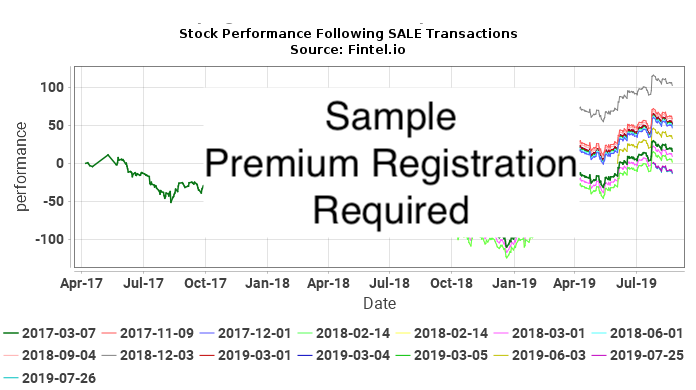
Erfolgsbilanz von Insiderverkäufen - Kurzfristige Verlustanalyse
In diesem Abschnitt analysieren wir die kurzfristige Verlustvermeidung jedes ungeplanten Insider-Verkaufs auf dem freien Markt in SEAC / SeaChange International, Inc.. Ein konsistentes Muster der Verlustvermeidung kann darauf hindeuten, dass zukünftige Verkaufstransaktionen Kursrückgänge vorhersagen können. Diese Analyse bezieht sich auf ein Jahr nach jedem Handel, und die Ergebnisse sind theoretisch .
Die folgende Tabelle zeigt die jüngsten Verkäufe am offenen Markt, die nicht Teil eines automatischen Handelsplans waren.
Bereinigter Preis ist der splitbereinigte Preis. Bereinigte Aktien sind die um den Split bereinigten Aktien.
Transaktionshistorie
Klicken Sie auf das Link-Symbol, um den vollständigen Transaktionsverlauf anzuzeigen. Transaktionen, die im Rahmen eines automatischen Handelsplans 10b5-1 gemeldet werden, sind in der Spalte 10b-5 mit einem X gekennzeichnet.
| Datei Datum |
Handel Datum |
Form | Insider | Ticker | Wertpapier-Titel | Code | Direkt | Ausführung Preis |
Einheit Preis |
Eimheiten Verändert |
Wert Geändert (1K) |
Verbleibende Optionen |
Verbleibende Aktien |
|
|---|---|---|---|---|---|---|---|---|---|---|---|---|---|---|
| 2023-09-29 | 2023-09-27 | 4 | Klimmer Christoph | SEAC | Common Stock | D | 21.689 | 39.616 | ||||||
| 2023-08-28 | 2023-08-25 | 4 | SINGER KAREN LLC managing member | SEAC | Common Stock | I | 4,8900 | 15.000 | 73 | 739.985 | ||||
| 2023-08-28 | 2023-08-24 | 4 | SINGER KAREN LLC managing member | SEAC | Common Stock | I | 4,9500 | 7.281 | 36 | 724.985 | ||||
| 2023-08-28 | 2023-08-24 | 4 | SINGER KAREN LLC managing member | SEAC | Common Stock | I | 4,9483 | 7.608 | 38 | 717.704 | ||||
| 2023-08-25 | 2023-08-23 | 4 | Klimmer Christoph | SEAC | Common Stock | D | 4,9800 | -1.611 | -8 | 16.316 | ||||
| 2023-08-23 | 2023-08-23 | 4 | SINGER KAREN LLC managing member | SEAC | Common Stock | I | 4,9500 | 687 | 3 | 710.096 | ||||
| 2023-08-23 | 2023-08-22 | 4 | SINGER KAREN LLC managing member | SEAC | Common Stock | I | 4,9605 | 6.224 | 31 | 709.409 | ||||
| 2023-08-23 | 2023-08-21 | 4 | SINGER KAREN LLC managing member | SEAC | Common Stock | I | 4,9483 | 8.233 | 41 | 703.185 | ||||
| 2023-08-18 | 2023-08-18 | 4 | SINGER KAREN LLC managing member | SEAC | Common Stock | I | 4,8600 | 7.907 | 38 | 694.952 | ||||
| 2023-08-18 | 2023-08-18 | 4 | SINGER KAREN LLC managing member | SEAC | Common Stock | I | 4,8600 | 3.459 | 17 | 687.045 | ||||
| 2023-08-18 | 2023-08-17 | 4 | SINGER KAREN LLC managing member | SEAC | Common Stock | I | 4,8600 | 7.205 | 35 | 683.586 | ||||
| 2023-08-18 | 2023-08-16 | 4 | SINGER KAREN LLC managing member | SEAC | Common Stock | I | 4,9200 | 3.174 | 16 | 676.381 | ||||
| 2023-08-18 | 2023-08-16 | 4 | SINGER KAREN LLC managing member | SEAC | Common Stock | I | 4,9227 | 25.000 | 123 | 673.207 | ||||
| 2023-08-18 | 2023-08-16 | 4 | SINGER KAREN LLC managing member | SEAC | Common Stock | I | 4,9200 | 25.000 | 123 | 648.207 | ||||
| 2023-08-15 | 2023-08-15 | 4 | SINGER KAREN LLC managing member | SEAC | Common Stock | I | 4,9200 | 4.044 | 20 | 623.207 | ||||
| 2023-08-15 | 2023-08-15 | 4 | SINGER KAREN LLC managing member | SEAC | Common Stock | I | 4,9200 | 673 | 3 | 619.163 | ||||
| 2023-08-15 | 2023-08-14 | 4 | SINGER KAREN LLC managing member | SEAC | Common Stock | I | 4,9300 | 1.759 | 9 | 618.490 | ||||
| 2023-08-15 | 2023-08-14 | 4 | SINGER KAREN LLC managing member | SEAC | Common Stock | I | 4,9174 | 349 | 2 | 616.731 | ||||
| 2023-08-15 | 2023-08-11 | 4 | SINGER KAREN LLC managing member | SEAC | Common Stock | I | 4,8575 | 7.587 | 37 | 616.382 | ||||
| 2023-08-10 | 2023-08-10 | 4 | SINGER KAREN LLC managing member | SEAC | Common Stock | I | 4,5990 | 5.850 | 27 | 608.795 | ||||
| 2023-08-10 | 2023-08-10 | 4 | SINGER KAREN LLC managing member | SEAC | Common Stock | I | 4,6495 | 2.805 | 13 | 602.945 | ||||
| 2023-08-10 | 2023-08-09 | 4 | SINGER KAREN LLC managing member | SEAC | Common Stock | I | 4,5443 | 9.150 | 42 | 600.140 | ||||
| 2023-08-10 | 2023-08-09 | 4 | SINGER KAREN LLC managing member | SEAC | Common Stock | I | 4,6200 | 25 | 0 | 590.990 | ||||
| 2023-08-10 | 2023-08-08 | 4 | SINGER KAREN LLC managing member | SEAC | Common Stock | I | 4,6961 | 25.000 | 117 | 590.965 | ||||
| 2023-08-10 | 2023-08-08 | 4 | SINGER KAREN LLC managing member | SEAC | Common Stock | I | 4,7321 | 50.000 | 237 | 565.965 | ||||
| 2023-08-10 | 2023-08-08 | 4 | SINGER KAREN LLC managing member | SEAC | Common Stock | I | 4,9021 | 75.000 | 368 | 515.965 | ||||
| 2023-05-22 | 2023-05-19 | 4 | NICOL DAVID J | SEAC | Common Stock | D | 232.558 | 626.253 | ||||||
| 2023-05-22 | 2023-05-19 | 4 | Stecker Matthew | SEAC | Common Stock | D | 232.558 | 592.885 | ||||||
| 2023-05-22 | 2023-05-19 | 4 | SINGER STEVEN G | SEAC | Common Stock | D | 232.558 | 583.355 | ||||||
| 2023-05-22 | 2023-05-19 | 4 | Volshteyn Igor | SEAC | Common Stock | D | 232.558 | 560.320 | ||||||
| 2023-05-22 | 2023-04-06 | 4 | Klimmer Christoph | SEAC | Common Stock | D | 0,4100 | -18.302 | -8 | 358.533 | ||||
| 2023-05-22 | 2023-03-29 | 4 | Klimmer Christoph | SEAC | Common Stock | D | 0,3600 | -18.910 | -7 | 376.835 | ||||
| 2023-04-07 | 2023-04-06 | 4 | AQUINO PETER D | SEAC | Common Stock | D | 27.660 | 1.481.937 | ||||||
| 2023-04-07 | 2023-04-06 | 4 | Klimmer Christoph | SEAC | Common Stock | D | 95.745 | 395.745 | ||||||
| 2023-03-31 | 2023-03-30 | 4 | Szynkowski Mark Paul | SEAC | Common Stock | D | 60.000 | 120.000 | ||||||
| 2023-03-31 | 2023-03-30 | 4 | Szynkowski Mark Paul | SEAC | Common Stock | D | 60.000 | 120.000 | ||||||
| 2023-01-09 | 2023-01-06 | 4 | SINGER KAREN LLC managing member | SEAC | Common Stock | I | 0,4898 | 2.064 | 1 | 8.819.311 | ||||
| 2023-01-09 | 2023-01-05 | 4 | SINGER KAREN LLC managing member | SEAC | Common Stock | I | 0,4889 | 150.000 | 73 | 8.817.247 | ||||
| 2023-01-09 | 2023-01-05 | 4 | SINGER KAREN LLC managing member | SEAC | Common Stock | I | 0,4897 | 26.051 | 13 | 8.667.247 | ||||
| 2022-12-29 | 2022-12-28 | 4 | SINGER KAREN LLC managing member | SEAC | Common Stock | I | 0,4398 | 75.400 | 33 | 8.641.196 | ||||
| 2022-12-29 | 2022-12-27 | 4 | SINGER KAREN LLC managing member | SEAC | Common Stock | I | 0,4400 | 8.361 | 4 | 8.565.796 | ||||
| 2022-12-27 | 2022-12-22 | 4 | SINGER KAREN LLC managing member | SEAC | Common Stock | I | 0,4400 | 2.900 | 1 | 8.557.435 | ||||
| 2022-12-22 | 2022-12-21 | 4 | SINGER KAREN LLC managing member | SEAC | Common Stock | I | 0,4399 | 21.292 | 9 | 8.554.535 | ||||
| 2022-12-22 | 2022-12-20 | 4 | SINGER KAREN LLC managing member | SEAC | Common Stock | I | 0,4399 | 5.143 | 2 | 8.533.243 | ||||
| 2022-12-22 | 2022-12-20 | 4 | SINGER KAREN LLC managing member | SEAC | Common Stock | I | 0,4400 | 15.676 | 7 | 8.528.100 | ||||
| 2022-12-19 | 2022-12-16 | 4 | SINGER KAREN LLC managing member | SEAC | Common Stock | I | 0,4400 | 1.671 | 1 | 8.512.424 | ||||
| 2022-12-19 | 2022-12-16 | 4 | SINGER KAREN LLC managing member | SEAC | Common Stock | I | 0,4400 | 27.592 | 12 | 8.510.753 | ||||
| 2022-12-19 | 2022-12-15 | 4 | SINGER KAREN LLC managing member | SEAC | Common Stock | I | 0,4500 | 13.500 | 6 | 8.483.161 | ||||
| 2022-12-19 | 2022-12-15 | 4 | SINGER KAREN LLC managing member | SEAC | Common Stock | I | 0,4500 | 50 | 0 | 8.469.661 | ||||
| 2022-12-15 | 2022-12-13 | 4 | SINGER KAREN LLC managing member | SEAC | Common Stock | I | 0,4444 | 37.641 | 17 | 8.469.611 | ||||
| 2022-10-24 | 2022-10-21 | 4 | SINGER KAREN LLC managing member | SEAC | Common Stock | I | 1,0000 | 204.400 | 204 | 8.431.970 | ||||
| 2022-10-19 | 2022-10-17 | 4 | SINGER KAREN LLC managing member | SEAC | Common Stock | I | 1,0000 | 8.100 | 8 | 8.227.570 | ||||
| 2022-10-03 | 2022-09-29 | 4 | AQUINO PETER D | SEAC | Common Stock | D | 350.000 | 1.466.777 | ||||||
| 2022-10-03 | 2022-09-29 | 4 | AQUINO PETER D | SEAC | Common Stock | D | 350.000 | 1.466.777 | ||||||
| 2022-10-03 | 2022-09-29 | 4 | Mosher Kathleen | SEAC | Common Stock | D | 60.000 | 120.174 | ||||||
| 2022-10-03 | 2022-09-29 | 4 | Mosher Kathleen | SEAC | Common Stock | D | 60.000 | 120.174 | ||||||
| 2022-10-03 | 2022-09-29 | 4 | Klimmer Christoph | SEAC | Common Stock | D | 150.000 | 300.000 | ||||||
| 2022-10-03 | 2022-09-29 | 4 | Klimmer Christoph | SEAC | Common Stock | D | 150.000 | 300.000 | ||||||
| 2022-09-28 | 2022-09-26 | 4 | SINGER KAREN LLC managing member | SEAC | Common Stock | I | 1,0000 | 10.000 | 10 | 8.219.470 | ||||
| 2022-09-20 | 2022-09-16 | 4 | SINGER KAREN LLC managing member | SEAC | Common Stock | I | 1,0000 | 12.500 | 12 | 8.209.470 | ||||
| 2022-09-16 | 2022-09-14 | 4 | SINGER KAREN LLC managing member | SEAC | Common Stock | I | 1,0000 | 40.000 | 40 | 8.196.970 | ||||
| 2022-08-10 | 3 | Mosher Kathleen | SEAC | Common Stock | D | 174 | ||||||||
| 2022-08-09 | 2022-08-05 | 4 | NICOL DAVID J | SEAC | Common Stock | D | 163.881 | 393.695 | ||||||
| 2022-08-09 | 2022-08-05 | 4 | SINGER STEVEN G | SEAC | Common Stock | D | 163.881 | 350.797 | ||||||
| 2022-08-09 | 2022-08-05 | 4 | Stecker Matthew | SEAC | Common Stock | D | 163.881 | 360.327 | ||||||
| 2022-08-09 | 2022-08-05 | 4 | Volshteyn Igor | SEAC | Common Stock | D | 163.881 | 327.762 | ||||||
| 2022-08-09 | 2022-08-05 | 4 | Volshteyn Igor | SEAC | Common Stock | D | 163.881 | 163.881 | ||||||
| 2022-07-18 | 2022-07-15 | 4 | SINGER KAREN LLC Managing Member | SEAC | Common Stock | I | 1,0000 | 200 | 0 | 8.156.970 | ||||
| 2022-07-18 | 2022-07-15 | 4 | SINGER KAREN LLC Managing Member | SEAC | Common Stock | I | 0,5800 | 100.000 | 58 | 8.156.770 | ||||
| 2022-07-18 | 2022-07-15 | 4 | SINGER KAREN LLC Managing Member | SEAC | Common Stock | I | 0,5819 | 241.000 | 140 | 8.056.770 | ||||
| 2022-07-18 | 2022-07-14 | 4 | SINGER KAREN LLC Managing Member | SEAC | Common Stock | I | 0,5266 | 33.658 | 18 | 7.815.770 | ||||
| 2022-07-18 | 2022-07-14 | 4 | SINGER KAREN LLC managing member | SEAC | Common Stock | I | 0,5554 | 144.620 | 80 | 7.782.112 | ||||
| 2022-07-13 | 2022-07-13 | 4 | SINGER KAREN LLC managing member | SEAC | Common Stock | I | 0,5192 | 166.342 | 86 | 7.637.492 | ||||
| 2022-07-13 | 2022-07-12 | 4 | SINGER KAREN LLC managing member | SEAC | Common Stock | I | 0,5391 | 100.000 | 54 | 7.471.150 | ||||
| 2022-07-13 | 2022-07-11 | 4 | SINGER KAREN LLC managing member | SEAC | Common Stock | I | 0,5671 | 158.600 | 90 | 7.371.150 | ||||
| 2022-07-08 | 2022-07-08 | 4 | SINGER KAREN LLC managing member | SEAC | Common Stock | I | 0,5650 | 5.907 | 3 | 7.212.550 | ||||
| 2022-07-08 | 2022-07-07 | 4 | SINGER KAREN LLC managing member | SEAC | Common Stock | I | 0,5700 | 96.071 | 55 | 7.206.643 | ||||
| 2022-07-08 | 2022-07-06 | 4 | SINGER KAREN LLC managing member | SEAC | Common Stock | I | 0,5700 | 100.000 | 57 | 7.110.572 | ||||
| 2022-07-05 | 2022-07-05 | 4 | SINGER KAREN LLC managing member | SEAC | Common Stock | I | 0,5700 | 4.134 | 2 | 7.010.572 | ||||
| 2022-07-05 | 2022-07-01 | 4 | SINGER KAREN LLC managing member | SEAC | Common Stock | I | 0,5899 | 96.276 | 57 | 7.006.438 | ||||
| 2022-07-05 | 2022-06-30 | 4 | SINGER KAREN LLC managing member | SEAC | Common Stock | I | 0,5900 | 34.546 | 20 | 6.910.162 | ||||
| 2022-06-29 | 2022-06-29 | 4 | SINGER KAREN LLC managing member | SEAC | Common Stock | I | 0,5954 | 98.262 | 59 | 6.875.616 | ||||
| 2022-06-29 | 2022-06-28 | 4 | SINGER KAREN LLC managing member | SEAC | Common Stock | I | 0,5901 | 9.340 | 6 | 6.777.354 | ||||
| 2022-06-29 | 2022-06-27 | 4 | SINGER KAREN LLC managing member | SEAC | Common Stock | I | 0,5997 | 142.398 | 85 | 6.768.014 | ||||
| 2022-06-23 | 2022-06-22 | 4 | SINGER KAREN LLC managing member | SEAC | Common Stock | I | 0,5451 | 10.201 | 6 | 6.625.616 | ||||
| 2022-06-23 | 2022-06-21 | 4 | SINGER KAREN LLC managing member | SEAC | Common Stock | I | 0,5458 | 176.249 | 96 | 6.615.415 | ||||
| 2022-06-23 | 2022-06-21 | 4 | SINGER KAREN LLC managing member | SEAC | Common Stock | I | 0,5400 | 3.933 | 2 | 6.439.166 | ||||
| 2022-06-23 | 2022-06-21 | 4 | SINGER KAREN LLC managing member | SEAC | Common Stock | I | 0,5406 | 100.000 | 54 | 6.435.233 | ||||
| 2022-06-21 | 2022-06-16 | 4 | AQUINO PETER D | SEAC | Common Stock | D | 0,5300 | 189.000 | 100 | 766.777 | ||||
| 2022-06-21 | 2022-06-16 | 4 | SINGER KAREN LLC managing member | SEAC | Common Stock | I | 0,4800 | 50.000 | 24 | 6.335.233 | ||||
| 2022-06-21 | 2022-06-16 | 4 | SINGER KAREN LLC managing member | SEAC | Common Stock | I | 0,5448 | 217.617 | 119 | 6.285.233 | ||||
| 2022-05-31 | 2022-05-27 | 4 | Prinn Michael | SEAC | Common Stock | D | 0,8000 | -1.509 | -1 | 10.971 | ||||
| 2022-03-31 | 2022-03-29 | 4 | AQUINO PETER D | SEAC | Common Stock | D | 1,2100 | -9.723 | -12 | 577.777 | ||||
| 2021-09-29 | 2021-09-27 | 4 | AQUINO PETER D | SEAC | Common Stock | D | 300.000 | 600.000 | ||||||
| 2021-09-29 | 2021-09-27 | 4 | AQUINO PETER D | SEAC | Common Stock | D | 300.000 | 600.000 | ||||||
| 2021-08-05 | 2021-08-03 | 4 | SINGER STEVEN G | SEAC | Common Stock | D | 93.458 | 186.916 | ||||||
| 2021-08-05 | 2021-08-03 | 4 | SINGER STEVEN G | SEAC | Common Stock | D | 93.458 | 186.916 | ||||||
| 2021-07-29 | 2021-07-28 | 4 | PONS ROBERT M | SEAC | Common Stock | D | 150.000 | 744.772 | ||||||
| 2021-07-22 | 2021-07-20 | 4 | SINGER JULIAN D. | SEAC | Common Stock | D | 125.000 | 353.801 | ||||||
| 2021-07-12 | 2021-07-08 | 4 | PONS ROBERT M | SEAC | Common Stock | D | 86.957 | 594.772 | ||||||
| 2021-07-12 | 2021-07-08 | 4 | NICOL DAVID J | SEAC | Common Stock | D | 86.957 | 229.814 | ||||||
| 2021-07-12 | 2021-07-08 | 4 | SINGER JULIAN D. | SEAC | Common Stock | D | 86.957 | 228.801 | ||||||
| 2021-07-12 | 2021-07-08 | 4 | Stecker Matthew | SEAC | Common Stock | D | 86.957 | 196.446 | ||||||
| 2021-06-28 | 2021-06-24 | 4 | Stecker Matthew | SEAC | Stock option (right to buy) | D | 1,33 | 50.000 | 50.000 | |||||
| 2021-06-28 | 2021-06-24 | 4 | Prinn Michael | SEAC | Performance Rights Stock Option | D | 1,33 | 75.000 | 75.000 | |||||
| 2021-06-22 | 2021-06-21 | 4 | PONS ROBERT M | SEAC | Common Stock | D | 1,0600 | 100.000 | 106 | 507.815 | ||||
| 2021-06-01 | 2021-05-27 | 4 | Prinn Michael | SEAC | Common Stock | D | 1,1500 | -1.806 | -2 | 12.480 | ||||
| 2021-05-18 | 2021-05-14 | 4 | NICOL DAVID J | SEAC | Common Stock | D | 47.619 | 142.857 | ||||||
| 2021-05-18 | 2021-05-14 | 4 | NICOL DAVID J | SEAC | Common Stock | D | 95.238 | 95.238 | ||||||
| 2021-04-21 | 2021-04-19 | 4 | PONS ROBERT M | SEAC | Common Stock | D | 1,0400 | 100.000 | 104 | 407.815 | ||||
| 2021-03-24 | 2021-02-01 | 4 | Kielczewski Marek | SEAC | Common Stock | D | 1,1700 | -1.565 | -2 | 456.116 | ||||
| 2021-03-24 | 2021-02-01 | 4 | Kielczewski Marek | SEAC | Common Stock | D | 1,1700 | -6.261 | -7 | 457.681 | ||||
| 2021-03-24 | 2021-01-04 | 4 | Aloni Yosef | SEAC | Common Stock | D | 1,4300 | -6.163 | -9 | 82.953 | ||||
| 2021-02-12 | 2021-02-10 | 4 | Stecker Matthew | SEAC | Common Stock | D | 36.496 | 36.496 | ||||||
| 2021-02-12 | 2021-02-10 | 4 | Stecker Matthew | SEAC | Common Stock | D | 72.993 | 72.993 | ||||||
| 2021-02-12 | 2021-02-10 | 4 | Prinn Michael | SEAC | Employee Stock Option (right to buy) | D | 1,38 | 200.000 | 200.000 | |||||
| 2021-02-12 | 2021-02-10 | 4 | Kielczewski Marek | SEAC | Employee Stock Option (right to buy) | D | 1,38 | 200.000 | 200.000 | |||||
| 2020-07-29 | 2020-07-27 | 4 | SINGER JULIAN D. | SEAC | Common Stock | D | 70.922 | 141.844 | ||||||
| 2020-07-29 | 2020-07-27 | 4 | SINGER JULIAN D. | SEAC | Common Stock | D | 70.922 | 141.844 | ||||||
| 2020-07-13 | 2020-07-09 | 4 | PONS ROBERT M | SEAC | Common Stock | D | 72.464 | 307.815 | ||||||
| 2020-07-13 | 2020-07-09 | 4 | Sriubas Andrew | SEAC | Common Stock | D | 72.464 | 262.188 | ||||||
| 2020-07-13 | 2020-07-09 | 4 | TUDER JEFFREY | SEAC | Common Stock | D | 72.464 | 310.815 | ||||||
| 2020-07-02 | 2020-06-30 | 4 | Prinn Michael | SEAC | Employee Stock Option (right to buy) | D | 1,51 | 25.006 | 25.006 | |||||
| 2020-07-02 | 2020-06-30 | 4 | Aloni Yosef | SEAC | Employee Stock Option (right to buy) | D | 1,51 | 38.600 | 38.600 | |||||
| 2020-07-02 | 2020-06-30 | 4 | Hassler Chad A. | SEAC | Employee Stock Option (right to buy) | D | 1,51 | 25.006 | 25.006 | |||||
| 2020-07-02 | 2020-06-30 | 4 | Kielczewski Marek | SEAC | Employee Stock Option (right to buy) | D | 1,51 | 26.672 | 26.672 | |||||
| 2020-06-05 | 2020-05-26 | 4/A | Hassler Chad A. | SEAC | Performance rights | D | 55.714 | 55.714 | ||||||
| 2020-06-05 | 2020-05-26 | 4/A | Hassler Chad A. | SEAC | Common Stock | D | 18.571 | 18.571 | ||||||
| 2020-06-05 | 2020-05-26 | 4/A | Kielczewski Marek | SEAC | Performance rights | D | 87.857 | 87.857 | ||||||
| 2020-06-05 | 2020-05-26 | 4/A | Kielczewski Marek | SEAC | Common Stock | D | 29.286 | 463.942 | ||||||
| 2020-06-05 | 2020-05-26 | 4/A | Prinn Michael | SEAC | Performance rights | D | 42.857 | 42.857 | ||||||
| 2020-06-05 | 2020-05-26 | 4/A | Prinn Michael | SEAC | Common Stock | D | 14.286 | 14.286 | ||||||
| 2020-06-05 | 2020-05-26 | 4/A | Aloni Yosef | SEAC | Performance rights stock option | D | 3,50 | 3,5000 | 185.714 | 650 | 185.714 | |||
| 2020-05-28 | 2020-05-26 | 4 | Aloni Yosef | SEAC | Performance rights stock option | D | 1,77 | 681.842 | 681.842 | |||||
| 2020-05-28 | 2020-05-26 | 4 | Hassler Chad A. | SEAC | Performance Rights | D | 110.169 | 110.169 | ||||||
| 2020-05-28 | 2020-05-26 | 4 | Hassler Chad A. | SEAC | Common Stock | D | 36.723 | 36.723 | ||||||
| 2020-05-28 | 2020-05-26 | 4 | Kielczewski Marek | SEAC | Performance rights | D | 173.729 | 173.729 | ||||||
| 2020-05-28 | 2020-05-26 | 4 | Kielczewski Marek | SEAC | Common Stock | D | 57.910 | 492.566 | ||||||
| 2020-05-28 | 2020-05-26 | 4 | Prinn Michael | SEAC | Performance rights | D | 84.746 | 84.746 | ||||||
| 2020-05-28 | 2020-05-26 | 4 | Prinn Michael | SEAC | Common Stock | D | 28.249 | 28.249 | ||||||
| 2020-05-07 | 2020-05-05 | 4 | Kielczewski Marek | SEAC | Common Stock | D | 2,6800 | -13.869 | -37 | 434.656 | ||||
| 2020-05-07 | 2020-04-28 | 4 | Kielczewski Marek | SEAC | Common Stock | D | 43.438 | 448.525 | ||||||
| 2020-02-05 | 2020-02-03 | 4 | Aloni Yosef | SEAC | Common Stock | D | 4,4400 | -4.923 | -22 | 89.116 | ||||
| 2020-02-05 | 2020-02-04 | 4 | Kielczewski Marek | SEAC | Common Stock | D | 4,4100 | -1.760 | -8 | 405.087 | ||||
| 2020-02-05 | 2020-02-04 | 4 | Kielczewski Marek | SEAC | Common Stock | D | 4,2660 | -1.560 | -7 | 406.847 | ||||
| 2020-02-05 | 2020-02-03 | 4 | Kielczewski Marek | SEAC | Common Stock | D | 4,4400 | -5.769 | -26 | 408.407 | ||||
| 2020-01-06 | 2020-01-03 | 4 | Aloni Yosef | SEAC | Common Stock | D | 3,8200 | -5.961 | -23 | 94.039 | ||||
| 2019-12-20 | 2019-12-18 | 4 | Sriubas Andrew | SEAC | Common Stock | D | 23.256 | 189.724 | ||||||
| 2019-12-20 | 2019-12-18 | 4 | TUDER JEFFREY | SEAC | Common Stock | D | 58.140 | 238.351 | ||||||
| 2019-12-20 | 2019-12-18 | 4 | PONS ROBERT M | SEAC | Common Stock | D | 58.140 | 235.351 | ||||||
| 2019-12-05 | 2019-12-03 | 4 | BONNEY MARK J | SEAC | Common Stock | D | 70.821 | 304.866 | ||||||
| 2019-10-09 | 2019-10-08 | 4 | Prinn Michael | SEAC | Stock Option (right to buy) | D | 2,80 | 2,8000 | 100.000 | 280 | 100.000 | |||
| 2019-09-05 | 2019-09-04 | 4 | Hassler Chad A. | SEAC | Stock Option (right to buy) | D | 2,70 | 2,7000 | 75.000 | 202 | 75.000 | |||
| 2019-09-05 | 2019-09-04 | 4 | Aloni Yosef | SEAC | Stock Option (right to buy) | D | 2,70 | 2,7000 | 200.000 | 540 | 200.000 | |||
| 2019-07-12 | 2019-07-11 | 4 | TUDER JEFFREY | SEAC | Common Stock | D | 59.172 | 180.211 | ||||||
| 2019-07-12 | 2019-07-11 | 4 | Sriubas Andrew | SEAC | Common Stock | D | 59.172 | 166.468 | ||||||
| 2019-07-12 | 2019-07-11 | 4 | PONS ROBERT M | SEAC | Common Stock | D | 59.172 | 177.211 | ||||||
| 2019-07-12 | 2019-07-11 | 4 | Markey William Francis III | SEAC | Common Stock | D | 59.172 | 194.632 | ||||||
| 2019-06-27 | 2019-06-25 | 4 | Kielczewski Marek | SEAC | Non-Qualfied Stock Option (right to buy) | D | 1,35 | 1,3500 | 50.000 | 68 | 50.000 | |||
| 2019-06-27 | 2019-06-25 | 4 | Faubert Peter R. | SEAC | Stock Option (right to buy) | D | 1,35 | 1,3500 | 50.000 | 68 | 50.000 | |||
| 2019-06-27 | 2019-06-25 | 4 | Aloni Yosef | SEAC | Non-Qualified Stock Option (right to buy) | D | 1,35 | 1,3500 | 50.000 | 68 | 50.000 | |||
| 2019-06-13 | 2019-06-11 | 4 | Aloni Yosef | SEAC | Non-Qualified Stock Option (right to buy) | D | 1,43 | 1,4300 | 125.000 | 179 | 125.000 | |||
| 2019-06-13 | 2019-06-11 | 4 | Kielczewski Marek | SEAC | Stock Option (right to buy) | D | 1,43 | 1,4300 | 100.000 | 143 | 100.000 | |||
| 2019-06-13 | 2019-06-12 | 4 | PONS ROBERT M | SEAC | Common Stock | D | 1,4700 | 20.000 | 29 | 118.039 | ||||
| 2019-06-13 | 2019-06-12 | 4 | BONNEY MARK J | SEAC | Common Stock | D | 1,5400 | 50.000 | 77 | 464.814 | ||||
| 2019-06-13 | 2019-06-12 | 4 | BONNEY MARK J | SEAC | Common Stock | D | 1,5400 | 40.000 | 62 | 414.814 | ||||
| 2019-06-13 | 2019-06-12 | 4 | BONNEY MARK J | SEAC | Common Stock | D | 1,4500 | 4.764 | 7 | 374.814 | ||||
| 2019-06-13 | 2019-06-11 | 4 | BONNEY MARK J | SEAC | Common Stock | D | 1,3900 | 18.523 | 26 | 370.050 | ||||
| 2019-06-13 | 2019-06-11 | 4 | BONNEY MARK J | SEAC | Common Stock | D | 1,3800 | 13.462 | 19 | 351.527 | ||||
| 2019-04-08 | 2019-04-04 | 4 | BONNEY MARK J | SEAC | Common Stock | D | 230.769 | 338.065 | ||||||
| 2019-03-11 | 3 | BARR WAYNE JR | SEAC | Common stock, $0.01 par value | D | 2.569.820 | ||||||||
| 2019-03-11 | 3 | BARR WAYNE JR | SEAC | Common stock, $0.01 par value | D | 2.569.820 | ||||||||
| 2019-03-11 | 3 | BARR WAYNE JR | SEAC | Common stock, $0.01 par value | D | 2.569.820 | ||||||||
| 2019-03-11 | 3 | BARR WAYNE JR | SEAC | Common stock, $0.01 par value | D | 2.569.820 | ||||||||
| 2019-03-04 | 3 | TUDER JEFFREY | SEAC | Common Stock | D | 46.000 | ||||||||
| 2019-03-04 | 3 | TUDER JEFFREY | SEAC | Common Stock | D | 46.000 | ||||||||
| 2019-03-04 | 3 | TUDER JEFFREY | SEAC | Common Stock | D | 46.000 | ||||||||
| 2019-03-04 | 2019-02-28 | 4 | PONS ROBERT M | SEAC | Common Stock | D | 32.680 | 98.039 | ||||||
| 2019-03-04 | 2019-02-28 | 4 | PONS ROBERT M | SEAC | Common Stock | D | 65.359 | 65.359 | ||||||
| 2019-03-04 | 2019-02-28 | 4 | TUDER JEFFREY | SEAC | Common Stock | D | 32.680 | 121.039 | ||||||
| 2019-03-04 | 2019-02-28 | 4 | TUDER JEFFREY | SEAC | Common Stock | D | 65.359 | 88.359 | ||||||
| 2019-03-01 | 2019-02-27 | 4 | SINGER KAREN As managing member of TAR Holdings LLC | SEAC | Common Stock | I | 1,5526 | 955.987 | 1.484 | 6.067.616 | ||||
| 2019-02-20 | 2019-02-15 | 4 | SINGER KAREN As managing member of TAR Holdings LLC | SEAC | Put Option (obligation to buy) | I | 2,50 | -750 | 0 | |||||
| 2019-02-20 | 2019-02-15 | 4 | SINGER KAREN As managing member of TAR Holdings LLC | SEAC | Common Stock | I | 2,5000 | 75.000 | 188 | 5.111.629 | ||||
| 2019-02-11 | 2019-02-08 | 4 | SINGER KAREN As managing member of TAR Holdings LLC | SEAC | Common Stock | I | 1,6460 | 7.320 | 12 | 5.036.629 | ||||
| 2019-02-11 | 2019-02-08 | 4 | SINGER KAREN As managing member of TAR Holdings LLC | SEAC | Common Stock | I | 1,6267 | 15.400 | 25 | 5.029.309 | ||||
| 2019-02-11 | 2019-02-07 | 4 | SINGER KAREN As managing member of TAR Holdings LLC | SEAC | Common Stock | I | 1,6300 | 27.784 | 45 | 5.013.909 | ||||
| 2019-02-06 | 2019-02-04 | 4 | SINGER KAREN As managing member of TAR Holdings LLC | SEAC | Common Stock | I | 1,5700 | 85.908 | 135 | 4.986.125 | ||||
| 2019-02-04 | 2019-01-31 | 4 | Aloni Yosef | SEAC | Stock Option (right to buy) | D | 1,59 | 1,5900 | 150.000 | 238 | 150.000 | |||
| 2019-02-04 | 2019-01-31 | 4 | Aloni Yosef | SEAC | Performance Rights | D | 50.000 | 50.000 | ||||||
| 2019-02-04 | 2019-01-31 | 4 | Aloni Yosef | SEAC | Common Stock | D | 50.000 | 100.000 | ||||||
| 2019-02-04 | 2019-02-01 | 4 | Kielczewski Marek | SEAC | Common Stock | D | 1,5128 | -1.595 | -2 | 414.176 | ||||
| 2019-02-04 | 2019-02-01 | 4 | Kielczewski Marek | SEAC | Common Stock | D | 1,5127 | -1.847 | -3 | 415.771 | ||||
| 2019-02-04 | 2019-01-31 | 4 | Kielczewski Marek | SEAC | Stock Option (right to buy) | D | 1,59 | 1,5900 | 150.000 | 238 | 150.000 | |||
| 2019-02-04 | 2019-01-31 | 4 | Kielczewski Marek | SEAC | Performance Rights | D | 50.000 | 50.000 | ||||||
| 2019-02-04 | 2019-01-31 | 4 | Kielczewski Marek | SEAC | Common Stock | D | 50.000 | 417.618 | ||||||
| 2019-02-04 | 2019-02-01 | 4 | McEvoy David | SEAC | Common Stock | D | 1,5126 | -3.189 | -5 | 115.854 | ||||
| 2019-02-04 | 2019-02-01 | 4 | McEvoy David | SEAC | Common Stock | D | 1,5127 | -1.010 | -2 | 119.043 | ||||
| 2019-02-04 | 2019-02-01 | 4 | McEvoy David | SEAC | Common Stock | D | 1,5114 | -1.627 | -2 | 120.053 | ||||
| 2019-02-04 | 2019-01-31 | 4 | McEvoy David | SEAC | Stock Option (right to buy) | D | 1,59 | 1,5900 | 100.000 | 159 | 100.000 | |||
| 2019-02-04 | 2019-01-31 | 4 | McEvoy David | SEAC | Performance Rights | D | 25.000 | 25.000 | ||||||
| 2019-02-04 | 2019-01-31 | 4 | McEvoy David | SEAC | Common Stock | D | 25.000 | 121.680 | ||||||
| 2019-02-04 | 2019-02-01 | 4 | Faubert Peter R. | SEAC | Common Stock | D | 1,5114 | -3.189 | -5 | 61.952 | ||||
| 2019-02-04 | 2019-02-01 | 4 | Faubert Peter R. | SEAC | Common Stock | D | 1,5127 | -2.562 | -4 | 65.141 | ||||
| 2019-02-04 | 2019-01-31 | 4 | Faubert Peter R. | SEAC | Stock Option (right to buy) | D | 1,59 | 1,5900 | 100.000 | 159 | 100.000 | |||
| 2019-02-04 | 2019-01-31 | 4 | Faubert Peter R. | SEAC | Performance Rights | D | 25.000 | 25.000 | ||||||
| 2019-02-04 | 2019-01-31 | 4 | Faubert Peter R. | SEAC | Common Stock | D | 25.000 | 67.703 | ||||||
| 2019-02-04 | 2019-02-01 | 4 | TERINO EDWARD | SEAC | Comon Stock | D | 1,5126 | -6.377 | -10 | 405.909 | ||||
| 2019-02-04 | 2019-02-01 | 4 | TERINO EDWARD | SEAC | Common Stock | D | 1,5113 | -5.834 | -9 | 412.286 | ||||
| 2019-02-04 | 2019-02-01 | 4 | TERINO EDWARD | SEAC | Common Stock | D | 1,5127 | -2.923 | -4 | 418.120 | ||||
| 2019-02-04 | 2019-01-31 | 4 | TERINO EDWARD | SEAC | Stock Option (right to buy) | D | 1,59 | 1,5900 | 200.000 | 318 | 200.000 | |||
| 2019-02-04 | 2019-01-31 | 4 | TERINO EDWARD | SEAC | Performance Rights | D | 50.000 | 50.000 | ||||||
| 2019-02-04 | 2019-01-31 | 4 | TERINO EDWARD | SEAC | Common Stock | D | 50.000 | 421.043 | ||||||
| 2019-01-31 | 2019-01-29 | 4 | McEvoy David | SEAC | Common Stock | D | 1,6500 | -6.069 | -10 | 96.680 | ||||
| 2019-01-22 | 2019-01-18 | 4 | SINGER KAREN As managing member of TAR Holdings LLC | SEAC | Put Option (obligation to buy) | I | 2,50 | -100 | 0 | |||||
| 2019-01-22 | 2019-01-18 | 4 | SINGER KAREN As managing member of TAR Holdings LLC | SEAC | Common Stock | I | 2,5000 | 10.000 | 25 | 4.900.217 | ||||
| 2019-01-22 | 2019-01-18 | 4 | SINGER KAREN As managing member of TAR Holdings LLC | SEAC | Common Stock | I | 1,6500 | 50.000 | 82 | 4.890.217 | ||||
| 2019-01-22 | 2019-01-18 | 4 | SINGER KAREN As managing member of TAR Holdings LLC | SEAC | Common Stock | I | 1,6395 | 11.200 | 18 | 4.840.217 | ||||
| 2019-01-22 | 2019-01-17 | 4 | SINGER KAREN As managing member of TAR Holdings LLC | SEAC | Common Stock | I | 1,6300 | 30.000 | 49 | 4.829.017 | ||||
| 2019-01-22 | 2019-01-17 | 4 | SINGER KAREN As managing member of TAR Holdings LLC | SEAC | Common Stock | I | 1,6200 | 70.000 | 113 | 4.799.017 | ||||
| 2019-01-22 | 2019-01-17 | 4 | SINGER KAREN As managing member of TAR Holdings LLC | SEAC | Common Stock | I | 1,6800 | 200.000 | 336 | 4.729.017 | ||||
| 2019-01-16 | 2019-01-15 | 4 | SINGER KAREN As managing member of TAR Holdings LLC | SEAC | Common Stock | I | 1,6175 | 800 | 1 | 4.529.017 | ||||
| 2019-01-10 | 2019-01-09 | 4 | SINGER KAREN As managing member of TAR Holdings LLC | SEAC | Common Stock | I | 1,6000 | 25.000 | 40 | 4.528.217 | ||||
| 2019-01-10 | 2019-01-08 | 4 | SINGER KAREN As managing member of TAR Holdings LLC | SEAC | Common Stock | I | 1,5721 | 79.840 | 126 | 4.503.217 | ||||
| 2019-01-09 | 2019-01-08 | 4 | SINGER KAREN As managing member of TAR Holdings LLC | SEAC | Put Option (obligation to buy) | I | 2,50 | 0,9500 | -750 | -1 | 750 | |||
| 2019-01-09 | 2019-01-08 | 4 | SINGER KAREN As managing member of TAR Holdings LLC | SEAC | Put Option (obligation to buy) | I | 2,50 | 0,9000 | -100 | -0 | 100 | |||
| 2019-01-09 | 2019-01-08 | 4 | SINGER KAREN As managing member of TAR Holdings LLC | SEAC | Common Stock | I | 1,5050 | 5.000 | 8 | 4.423.377 | ||||
| 2019-01-08 | 2019-01-07 | 4 | SINGER KAREN As managing member of TAR Holdings LLC | SEAC | Common Stock | I | 1,4568 | 45.660 | 67 | 4.418.377 | ||||
| 2019-01-07 | 2019-01-04 | 4 | SINGER KAREN As managing member of TAR Holdings LLC | SEAC | Common Stock | I | 1,4200 | 45.000 | 64 | 4.372.717 | ||||
| 2019-01-03 | 2019-01-02 | 4 | Aloni Yosef | SEAC | Stock Option (right to buy) | D | 1,43 | 1,4300 | 200.000 | 286 | 200.000 | |||
| 2019-01-03 | 2019-01-02 | 4 | Aloni Yosef | SEAC | Common Stock | D | 50.000 | 50.000 | ||||||
| 2019-01-02 | 2018-12-28 | 4 | SINGER KAREN As managing member of TAR Holdings LLC | SEAC | Common Stock | I | 1,2392 | 1.300 | 2 | 4.327.717 | ||||
| 2018-12-28 | 2018-12-27 | 4 | SINGER KAREN As managing member of TAR Holdings LLC | SEAC | Common Stock | I | 1,2290 | 11.090 | 14 | 4.326.417 | ||||
| 2018-12-26 | 2018-12-24 | 4 | SINGER KAREN As managing member of TAR Holdings LLC | SEAC | Common Stock | I | 1,1992 | 598 | 1 | 4.315.327 | ||||
| 2018-12-26 | 2018-12-21 | 4 | SINGER KAREN As managing member of TAR Holdings LLC | SEAC | Common Stock | I | 1,1790 | 1.998 | 2 | 4.314.729 | ||||
| 2018-12-21 | 2018-12-20 | 4 | SINGER KAREN As managing member of TAR Holdings LLC | SEAC | Common Stock | I | 1,2000 | 163.235 | 196 | 4.312.731 | ||||
| 2018-12-21 | 2018-12-20 | 4 | SINGER KAREN As managing member of TAR Holdings LLC | SEAC | Common Stock | I | 1,2100 | 25.000 | 30 | 4.149.496 | ||||
| 2018-12-20 | 2018-12-19 | 4 | SINGER KAREN As managing member of TAR Holdings LLC | SEAC | Common Stock | I | 1,2300 | 25.656 | 32 | 4.124.496 | ||||
| 2018-12-19 | 2018-12-18 | 4 | SINGER KAREN As managing member of TAR Holdings LLC | SEAC | Common Stock | I | 1,2293 | 27.385 | 34 | 4.098.840 | ||||
| 2018-12-18 | 2018-12-17 | 4 | SINGER KAREN As managing member of TAR Holdings LLC | SEAC | Common Stock | I | 1,3059 | 35.235 | 46 | 4.071.455 | ||||
| 2018-12-18 | 2018-12-17 | 4 | SINGER KAREN As managing member of TAR Holdings LLC | SEAC | Common Stock | I | 1,2818 | 17.768 | 23 | 4.036.220 | ||||
| 2018-12-14 | 2018-12-13 | 4 | SINGER KAREN as managing member of TAR Holdings LLC | SEAC | Common Stock | I | 1,3277 | 167.330 | 222 | 4.018.452 | ||||
| 2018-12-14 | 2018-12-12 | 4 | SINGER KAREN as managing member of TAR Holdings LLC | SEAC | Common Stock | I | 1,3600 | 55.133 | 75 | 3.851.122 | ||||
| 2018-12-13 | 3 | SINGER KAREN As managing member of Tar Holdings LLC | SEAC | Common Stock | I | 7.591.978 | ||||||||
| 2018-12-13 | 3 | SINGER KAREN As managing member of Tar Holdings LLC | SEAC | Common Stock | I | 7.591.978 | ||||||||
| 2018-12-13 | 3 | SINGER KAREN As managing member of Tar Holdings LLC | SEAC | Common Stock | I | 7.591.978 | ||||||||
| 2018-12-03 | 3 | Kielczewski Marek | SEAC | Common Stock | D | 735.236 | ||||||||
| 2018-12-03 | 3 | Kielczewski Marek | SEAC | Common Stock | D | 735.236 | ||||||||
| 2018-12-03 | 3 | Kielczewski Marek | SEAC | Common Stock | D | 735.236 | ||||||||
| 2018-12-03 | 2018-11-29 | 4 | Kielczewski Marek | SEAC | Non-Qualified Stock Option (right to buy) | D | 1,68 | 1,6800 | 100.000 | 168 | 100.000 | |||
| 2018-09-14 | 2018-09-14 | 4 | Markey William Francis III | SEAC | Common Stock | D | 1,7700 | 10.000 | 18 | 135.460 | ||||
| 2018-09-12 | 2018-09-10 | 4 | Wilson Royce E. | SEAC | Common Stock | D | 1,7100 | 28.500 | 49 | 160.360 | ||||
| 2018-09-12 | 2018-09-11 | 4 | TERINO EDWARD | SEAC | Common Stock | D | 1,7250 | 50.000 | 86 | 371.043 | ||||
| 2018-08-29 | 2018-07-12 | 4 | Wilson Royce E. | SEAC | Common Stock | D | 31.250 | 131.860 | ||||||
| 2018-08-29 | 2018-07-12 | 4 | Sriubas Andrew | SEAC | Common Stock | D | 31.250 | 107.296 | ||||||
| 2018-08-29 | 2018-07-12 | 4 | Markey William Francis III | SEAC | Common Stock | D | 31.250 | 125.460 | ||||||
| 2018-08-29 | 2018-07-12 | 4 | Cotton Mary Palermo | SEAC | Common Stock | D | 31.250 | 248.676 | ||||||
| 2018-08-29 | 2018-07-12 | 4 | BONNEY MARK J | SEAC | Common Stock | D | 31.250 | 107.296 | ||||||
| 2018-02-02 | 2018-02-01 | 4 | McEvoy David | SEAC | Common Stock | D | 3,3100 | -1.519 | -5 | 87.020 | ||||
| 2018-02-02 | 2018-02-01 | 4 | McEvoy David | SEAC | Common Stock | D | 3,3100 | -943 | -3 | 88.539 | ||||
| 2018-02-02 | 2018-01-31 | 4 | McEvoy David | SEAC | Stock Opion (right to buy) | D | 3,33 | 3,3300 | 100.000 | 333 | 100.000 | |||
| 2018-02-02 | 2018-01-31 | 4 | McEvoy David | SEAC | Performance Rights | D | 25.000 | 25.000 | ||||||
| 2018-02-02 | 2018-01-31 | 4 | McEvoy David | SEAC | Common Stock | D | 25.000 | 112.020 | ||||||
| 2018-02-02 | 2018-01-31 | 4 | McEvoy David | SEAC | Common Stock | D | 3,3200 | -6.536 | -22 | 89.482 | ||||
| 2018-02-02 | 2018-02-01 | 4 | Rider Jonathan W. | SEAC | Common Stock | D | 3,3100 | -1.836 | -6 | 21.062 | ||||
| 2018-02-02 | 2018-02-01 | 4 | Rider Jonathan W. | SEAC | Common Stock | D | 3,3100 | -1.187 | -4 | 22.898 | ||||
| 2018-02-02 | 2018-01-31 | 4 | Rider Jonathan W. | SEAC | Stock Option (right to buy) | D | 3,33 | 3,3300 | 100.000 | 333 | 100.000 | |||
| 2018-02-02 | 2018-01-31 | 4 | Rider Jonathan W. | SEAC | Performance Rights | D | 25.000 | 25.000 | ||||||
| 2018-02-02 | 2018-01-31 | 4 | Rider Jonathan W. | SEAC | Common Stock | D | 25.000 | 46.062 | ||||||
| 2018-02-02 | 2018-02-01 | 4 | Faubert Peter R. | SEAC | Common Stock | D | 3,3100 | -2.385 | -8 | 17.703 | ||||
| 2018-02-02 | 2018-01-31 | 4 | Faubert Peter R. | SEAC | Stock Option (right to buy) | D | 3,33 | 3,3300 | 100.000 | 333 | 100.000 | |||
| 2018-02-02 | 2018-01-31 | 4 | Faubert Peter R. | SEAC | Performance RIghts | D | 25.000 | 25.000 | ||||||
| 2018-02-02 | 2018-01-31 | 4 | Faubert Peter R. | SEAC | Common Stock | D | 25.000 | 42.703 | ||||||
| 2018-02-02 | 2018-02-01 | 4 | TERINO EDWARD | SEAC | Common Stock | D | 3,3100 | -3.448 | -11 | 271.043 | ||||
| 2018-02-02 | 2018-02-01 | 4 | TERINO EDWARD | SEAC | Common Stock | D | 3,3100 | -1.728 | -6 | 274.491 | ||||
| 2018-02-02 | 2018-01-31 | 4 | TERINO EDWARD | SEAC | Stock Options (right to buy) | D | 3,33 | 3,3300 | 200.000 | 666 | 200.000 | |||
| 2018-02-02 | 2018-01-31 | 4 | TERINO EDWARD | SEAC | Performance Rights | D | 50.000 | 50.000 | ||||||
| 2018-02-02 | 2018-01-31 | 4 | TERINO EDWARD | SEAC | Common Stock | D | 50.000 | 321.043 | ||||||
| 2017-12-08 | 2017-12-07 | 4 | Singer Eric By: VIEX Special Opportunities Fund II, LP | SEAC | Common Stock, $0.01 par value | I | 3,5048 | -205.209 | -719 | 1.603.783 | ||||
| 2017-12-08 | 2017-12-07 | 4 | Singer Eric By: VIEX Special Opportunities Fund II, LP | SEAC | Common Stock, $0.01 par value | I | 3,4968 | -117.183 | -410 | 1.808.992 | ||||
| 2017-12-08 | 2017-12-07 | 4 | Singer Eric By: VIEX Opportunities Fund, LP - Series One | SEAC | Common Stock, $0.01 par value | I | 3,5048 | -207.724 | -728 | 1.623.438 | ||||
| 2017-12-08 | 2017-12-07 | 4 | Singer Eric By: VIEX Opportunities Fund, LP - Series One | SEAC | Common Stock, $0.01 par value | I | 3,4968 | -118.619 | -415 | 1.831.162 | ||||
| 2017-08-28 | 3 | Sriubas Andrew By Self as Trustee of The Andy R Sriubas 2003 Trust | SEAC | Common Stock | I | 28.098 | ||||||||
| 2017-08-28 | 3 | Sriubas Andrew By Self as Trustee of The Andy R Sriubas 2003 Trust | SEAC | Common Stock | I | 28.098 | ||||||||
| 2017-08-28 | 2017-08-24 | 4 | BONNEY MARK J | SEAC | Common Stock | D | 38.023 | 76.046 | ||||||
| 2017-08-28 | 2017-08-24 | 4 | BONNEY MARK J | SEAC | Common Stock | D | 38.023 | 76.046 | ||||||
| 2017-08-28 | 2017-08-24 | 4 | Sriubas Andrew | SEAC | Common Stock | D | 38.023 | 104.144 | ||||||
| 2017-08-28 | 2017-08-24 | 4 | Sriubas Andrew | SEAC | Common Stock | D | 38.023 | 76.046 | ||||||
| 2017-07-17 | 2017-07-13 | 4 | CRADDOCK STEVEN | SEAC | Common Stock | D | 35.842 | 149.926 | ||||||
| 2017-07-17 | 2017-07-13 | 4 | Cotton Mary Palermo | SEAC | Common Stock | D | 35.842 | 217.426 | ||||||
| 2017-07-17 | 2017-07-13 | 4 | Wilson Royce E. | SEAC | Common Stock | D | 35.842 | 100.610 | ||||||
| 2017-07-17 | 2017-07-13 | 4 | Markey William Francis III | SEAC | Common Stock | D | 35.842 | 94.210 | ||||||
| 2017-02-28 | 3 | VIEX Capital Advisors, LLC By: VIEX Special Opportunities Fund II, LP | SEAC | Common Stock, $0.01 par value | I | 5.802.131 | ||||||||
| 2017-02-28 | 3 | VIEX Capital Advisors, LLC By: VIEX Opportunities Fund, LP - Series One | SEAC | Common Stock, $0.01 par value | I | 5.825.737 | ||||||||
| 2017-02-28 | 3 | VIEX Capital Advisors, LLC By: VIEX Special Opportunities Fund II, LP | SEAC | Common Stock, $0.01 par value | I | 5.802.131 | ||||||||
| 2017-02-28 | 3 | VIEX Capital Advisors, LLC By: VIEX Special Opportunities Fund II, LP | SEAC | Common Stock, $0.01 par value | I | 5.802.131 | ||||||||
| 2017-02-28 | 3 | VIEX Capital Advisors, LLC By: VIEX Special Opportunities Fund II, LP | SEAC | Common Stock, $0.01 par value | I | 5.802.131 | ||||||||
| 2017-02-28 | 3 | VIEX Capital Advisors, LLC By: VIEX Opportunities Fund, LP - Series One | SEAC | Common Stock, $0.01 par value | I | 5.825.737 | ||||||||
| 2017-02-28 | 3 | VIEX Capital Advisors, LLC By: VIEX Special Opportunities Fund II, LP | SEAC | Common Stock, $0.01 par value | I | 5.802.131 | ||||||||
| 2017-02-28 | 3 | VIEX Capital Advisors, LLC By: VIEX Opportunities Fund, LP - Series One | SEAC | Common Stock, $0.01 par value | I | 5.825.737 | ||||||||
| 2017-02-28 | 3 | VIEX Capital Advisors, LLC By: VIEX Opportunities Fund, LP - Series One | SEAC | Common Stock, $0.01 par value | I | 5.825.737 | ||||||||
| 2017-02-28 | 3 | VIEX Capital Advisors, LLC By: VIEX Special Opportunities Fund II, LP | SEAC | Common Stock, $0.01 par value | I | 5.802.131 | ||||||||
| 2017-02-28 | 3 | VIEX Capital Advisors, LLC By: VIEX Opportunities Fund, LP - Series One | SEAC | Common Stock, $0.01 par value | I | 5.825.737 | ||||||||
| 2017-02-28 | 3 | VIEX Capital Advisors, LLC By: VIEX Opportunities Fund, LP - Series One | SEAC | Common Stock, $0.01 par value | I | 5.825.737 | ||||||||
| 2017-02-02 | 3 | Rider Jonathan W. | SEAC | Common Stock | D | 19.930 | ||||||||
| 2017-02-02 | 3 | Rider Jonathan W. | SEAC | Common Stock | D | 19.930 | ||||||||
| 2017-02-02 | 2017-01-31 | 4 | TERINO EDWARD | SEAC | Incentive Stock Option (right to buy) | D | 2,42 | 2,4200 | 96.710 | 234 | 96.710 | |||
| 2017-02-02 | 2017-01-31 | 4 | TERINO EDWARD | SEAC | Performance Rights | D | 91.488 | 91.488 | ||||||
| 2017-02-02 | 2017-01-31 | 4 | TERINO EDWARD | SEAC | Common Stock | D | 45.744 | 276.219 | ||||||
| 2017-02-02 | 2017-02-01 | 4 | McEvoy David | SEAC | Common Stock | D | 2,4000 | -1.667 | -4 | 96.018 | ||||
| 2017-02-02 | 2017-02-01 | 4 | McEvoy David | SEAC | Common Stock | D | 2,4000 | -2.958 | -7 | 97.685 | ||||
| 2017-02-02 | 2017-01-31 | 4 | McEvoy David | SEAC | Incentive Stock Option (right to buy) | D | 2,42 | 2,4200 | 16.743 | 41 | 16.743 | |||
| 2017-02-02 | 2017-01-31 | 4 | McEvoy David | SEAC | Performance Rights | D | 15.838 | 15.838 | ||||||
| 2017-02-02 | 2017-01-31 | 4 | McEvoy David | SEAC | Common Stock | D | 2,3800 | -6.668 | -16 | 100.643 | ||||
| 2017-02-02 | 2017-01-31 | 4 | McEvoy David | SEAC | Common Stock | D | 7.919 | 107.311 | ||||||
| 2017-02-02 | 2017-01-31 | 4 | Faubert Peter R. | SEAC | Incentive Stock Option (right to buy) | D | 2,42 | 2,4200 | 42.469 | 103 | 42.469 | |||
| 2017-02-02 | 2017-01-31 | 4 | Faubert Peter R. | SEAC | Performance Rights | D | 40.175 | 40.175 | ||||||
| 2017-02-02 | 2017-01-31 | 4 | Faubert Peter R. | SEAC | Common Stock | D | 20.088 | 20.088 | ||||||
| 2017-02-02 | 2017-02-01 | 4 | Rider Jonathan W. | SEAC | Common Stock | D | 2,4000 | -1.302 | -3 | 24.085 | ||||
| 2017-02-02 | 2017-01-31 | 4 | Rider Jonathan W. | SEAC | Incentive Stock Option (right to buy) | D | 2,42 | 2,4200 | 32.604 | 79 | 32.604 | |||
| 2017-02-02 | 2017-01-31 | 4 | Rider Jonathan W. | SEAC | Performance Rights | D | 30.843 | 30.843 | ||||||
| 2017-02-02 | 2017-01-31 | 4 | Rider Jonathan W. | SEAC | Incentive Stock Option (right to buy) | D | 2,42 | 2,4200 | 100.000 | 242 | 100.000 | |||
| 2017-02-02 | 2017-01-31 | 4 | Rider Jonathan W. | SEAC | Common Stock | D | 15.422 | 25.387 | ||||||
| 2016-12-20 | 2016-12-19 | 4 | Wilson Royce E. | SEAC | Common Stock | D | 2,5200 | -53.561 | -135 | 64.768 | ||||
| 2016-12-14 | 2016-12-14 | 4 | Wilson Royce E. | SEAC | Common Stock | D | 2,4500 | -87.793 | -215 | 118.329 | ||||
| 2016-12-14 | 2016-12-13 | 4 | Wilson Royce E. | SEAC | Common Stock | D | 2,5300 | -28.988 | -73 | 206.122 | ||||
| 2016-12-14 | 2016-12-12 | 4 | Wilson Royce E. | SEAC | Common Stock | D | 2,6200 | -67.098 | -176 | 235.110 | ||||
| 2016-07-15 | 2016-07-13 | 4 | OLSON THOMAS F | SEAC | Common Stock | D | 29.851 | 196.972 | ||||||
| 2016-07-15 | 2016-07-13 | 4 | CRADDOCK STEVEN | SEAC | Common Stock | D | 29.851 | 114.084 | ||||||
| 2016-07-15 | 2016-07-13 | 4 | Cotton Mary Palermo | SEAC | Common Stock | D | 29.851 | 181.584 | ||||||
| 2016-07-15 | 2016-07-13 | 4 | Wilson Royce E. | SEAC | Common Stock | D | 29.851 | 302.208 | ||||||
| 2016-07-15 | 2016-07-13 | 4 | Markey William Francis III | SEAC | Common Stock | D | 29.851 | 58.368 | ||||||
| 2016-07-08 | 2016-07-06 | 4 | Faubert Peter R. | SEAC | Non-Qualified Stock Option (right to buy) | D | 3,30 | 100.000 | 100.000 | |||||
| 2016-06-22 | 2016-06-17 | 4 | McEvoy David | SEAC | Common Stock | D | 3,5000 | -5.458 | -19 | 99.392 | ||||
| 2016-06-20 | 2016-06-16 | 4 | OLSON THOMAS F | SEAC | Common Stock | D | 3,3982 | 10.000 | 34 | 167.121 | ||||
| 2016-06-14 | 2016-06-10 | 4 | Cotton Mary Palermo | SEAC | Common Stock | D | 3,3597 | 25.000 | 84 | 151.733 | ||||
| 2016-05-10 | 2016-05-10 | 4 | McEvoy David | SEAC | Common Stock | D | 3,4200 | -1.610 | -6 | 104.850 | ||||
| 2016-05-10 | 2016-05-06 | 4 | Wilson Royce E. | SEAC | Common Stock | D | 53.561 | 272.357 | ||||||
| 2016-05-10 | 2016-02-02 | 4 | Wilson Royce E. | SEAC | Common Stock | D | 124.783 | 218.796 | ||||||
| 2016-04-13 | 2016-04-12 | 4 | TERINO EDWARD | SEAC | Common Stock | D | 3,8250 | 40.000 | 153 | 230.475 | ||||
| 2016-04-13 | 2016-04-12 | 4 | CRADDOCK STEVEN | SEAC | Common Stock | D | 3,9000 | 25.000 | 98 | 84.233 | ||||
| 2016-04-08 | 2016-04-06 | 4 | TERINO EDWARD | SEAC | Non-Qualified Stock Option (right to buy) | D | 5,56 | 600.000 | 0 | |||||
| 2016-04-08 | 2016-04-06 | 4 | McEvoy David | SEAC | Common Stock | D | 7.543 | 106.460 | ||||||
| 2016-03-22 | 2016-03-18 | 4 | Markey William Francis III | SEAC | Common Stock | D | 9.506 | 28.517 | ||||||
| 2016-03-22 | 2016-03-18 | 4 | Markey William Francis III | SEAC | Common Stock | D | 19.011 | 19.011 | ||||||
| 2016-01-28 | 2016-01-26 | 4 | SAMIT JAY A | SEAC | Performance Rights | D | 100.000 | 100.000 | ||||||
| 2016-01-28 | 2016-01-26 | 4 | SAMIT JAY A | SEAC | Common Stock | D | 50.000 | 214.871 | ||||||
| 2016-01-28 | 2016-01-26 | 4 | TERINO EDWARD | SEAC | Incentive Stock Option (right to buy) | D | 6,05 | 6,0500 | 48.456 | 293 | 48.456 | |||
| 2016-01-28 | 2016-01-26 | 4 | TERINO EDWARD | SEAC | Performance Rights | D | 45.839 | 45.839 | ||||||
| 2016-01-28 | 2016-01-26 | 4 | TERINO EDWARD | SEAC | Common Stock | D | 22.920 | 190.475 | ||||||
| 2016-01-28 | 2016-01-26 | 4 | McEvoy David | SEAC | Incentive Stock Option (right to buy) | D | 6,05 | 6,0500 | 26.967 | 163 | 26.967 | |||
| 2016-01-28 | 2016-01-26 | 4 | McEvoy David | SEAC | Performance Rights | D | 25.510 | 25.510 | ||||||
| 2016-01-28 | 2016-01-26 | 4 | McEvoy David | SEAC | Common Stock | D | 50.000 | 98.917 | ||||||
| 2016-01-28 | 2016-01-26 | 4 | McEvoy David | SEAC | Common Stock | D | 12.755 | 48.917 | ||||||
| 2016-01-28 | 2016-01-26 | 4 | Dias Anthony | SEAC | Incentive Stock Option (right to buy) | D | 6,05 | 6,0500 | 37.922 | 229 | 37.922 | |||
| 2016-01-28 | 2016-01-26 | 4 | Dias Anthony | SEAC | Performance Rights | D | 35.874 | 35.874 | ||||||
| 2016-01-28 | 2016-01-26 | 4 | Dias Anthony | SEAC | Common Stock | D | 50.000 | 108.597 | ||||||
| 2016-01-28 | 2016-01-26 | 4 | Dias Anthony | SEAC | Common Stock | D | 17.937 | 58.597 | ||||||
| 2015-08-04 | 2015-08-03 | 4 | Wilson Royce E. | SEAC | Common Stock | D | 5.283 | 94.013 | ||||||
| 2015-07-17 | 2015-07-15 | 4 | Wilson Royce E. | SEAC | Common Stock | D | 13.850 | 88.730 | ||||||
| 2015-07-17 | 2015-07-15 | 4 | VONA CARMINE | SEAC | Common Stock | D | 13.850 | 146.610 | ||||||
| 2015-07-17 | 2015-07-15 | 4 | OLSON THOMAS F | SEAC | Common Stock | D | 13.850 | 157.121 | ||||||
| 2015-07-17 | 2015-07-15 | 4 | CRADDOCK STEVEN | SEAC | Common Stock | D | 13.850 | 59.233 | ||||||
| 2015-07-17 | 2015-07-15 | 4 | Cotton Mary Palermo | SEAC | Common Stock | D | 13.850 | 126.733 | ||||||
| 2015-06-25 | 2015-02-02 | 4/A | Wilson Royce E. | SEAC | Common Stock | D | 83.813 | 104.880 | ||||||
| 2015-06-25 | 2015-02-02 | 4/A | Wilson Royce E. | SEAC | Common Stock | D | 7.022 | 21.067 | ||||||
| 2015-06-25 | 2015-02-02 | 4/A | Wilson Royce E. | SEAC | Common Stock | D | 14.045 | 14.045 | ||||||
| 2015-06-25 | 2015-06-23 | 4 | Wilson Royce E. | SEAC | Common Stock | D | 7,5550 | -10.794 | -82 | 74.880 | ||||
| 2015-06-22 | 2015-06-22 | 4 | Wilson Royce E. | SEAC | Common Stock | D | 7,5900 | -5.000 | -38 | 85.674 | ||||
| 2015-06-22 | 2015-06-19 | 4 | Wilson Royce E. | SEAC | Common Stock | D | 7,5400 | -5.706 | -43 | 90.674 | ||||
| 2015-06-22 | 2015-06-18 | 4 | Wilson Royce E. | SEAC | Common Stock | D | 7,7450 | -8.500 | -66 | 96.300 | ||||
| 2015-06-04 | 2015-06-03 | 4 | TERINO EDWARD | SEAC | Non-Qualified Stock Option (right to buy) | D | 7,25 | 200.000 | 0 | |||||
| 2015-06-04 | 2015-06-03 | 4 | TERINO EDWARD | SEAC | Common Stock | D | 55.172 | 160.533 | ||||||
| 2015-04-16 | 2015-04-15 | 4 | TERINO EDWARD | SEAC | Common Stock | D | 6,7300 | 10.000 | 67 | 105.361 | ||||
| 2015-04-03 | 2015-04-01 | 4 | SAMIT JAY A | SEAC | Common Stock | D | 26.558 | 164.871 | ||||||
| 2015-04-03 | 2015-04-01 | 4 | McEvoy David | SEAC | Common Stock | D | 1.892 | 36.162 | ||||||
| 2015-04-03 | 2015-04-01 | 4 | Dias Anthony | SEAC | Common Stock | D | 3.138 | 40.660 | ||||||
| 2015-02-04 | 2015-02-02 | 4 | Wilson Royce E. | SEAC | Common Stock | D | -83.813 | 104.880 | ||||||
| 2015-02-04 | 2015-02-02 | 4 | Wilson Royce E. | SEAC | Common Stock | D | 7.022 | 21.067 | ||||||
| 2015-02-04 | 2015-02-02 | 4 | Wilson Royce E. | SEAC | Common Stock | D | 14.045 | 14.045 | ||||||
| 2015-02-03 | 2015-02-02 | 4 | CRADDOCK STEVEN | SEAC | Common Stock | D | 7.022 | 45.383 | ||||||
| 2015-02-03 | 2015-02-02 | 4 | VONA CARMINE | SEAC | Common Stock | D | 7.022 | 132.760 | ||||||
| 2015-02-03 | 2015-02-02 | 4 | Cotton Mary Palermo | SEAC | Common Stock | D | 7.022 | 112.883 | ||||||
| 2015-02-03 | 2015-02-02 | 4 | TERINO EDWARD | SEAC | Common Stock | D | 7.022 | 102.383 | ||||||
| 2015-02-03 | 2015-01-30 | 4 | McEvoy David | SEAC | Common Stock | D | 14.164 | 34.270 | ||||||
| 2015-02-03 | 2015-01-30 | 4 | Dias Anthony | SEAC | Common Stock | D | 14.164 | 37.522 | ||||||
| 2015-02-03 | 2015-02-02 | 4 | OLSON THOMAS F | SEAC | Common Stock | D | 7.022 | 143.271 | ||||||
| 2014-10-22 | 2014-10-20 | 4 | SAMIT JAY A | SEAC | Non-Qualified Stock Option (right to buy) | D | 7,23 | 500.000 | 0 | |||||
| 2014-10-22 | 2014-10-20 | 4 | SAMIT JAY A | SEAC | Common Stock | D | 138.313 | 138.313 | ||||||
| 2014-07-16 | 2014-07-15 | 4 | McEvoy David | SEAC | Common Stock | D | 8,0000 | -2.639 | -21 | 20.106 | ||||
| 2014-04-23 | 2014-04-21 | 4 | McEvoy David | SEAC | Common Stock | D | 368 | 22.745 | ||||||
| 2014-04-23 | 2014-04-21 | 4 | RAU RAGHAVENDRA | SEAC | Common Stock | D | 25.943 | 203.710 | ||||||
| 2014-04-23 | 2014-04-21 | 4 | Dias Anthony | SEAC | Common Stock | D | 3.347 | 23.358 | ||||||
| 2014-02-11 | 2014-02-10 | 4 | Dias Anthony | SEAC | Common Stock | D | 11,5640 | -750 | -9 | 20.011 | ||||
| 2014-02-04 | 2014-02-01 | 4 | TERINO EDWARD | SEAC | Common Stock | D | 8.361 | 95.361 | ||||||
| 2014-02-04 | 2014-02-01 | 4 | VONA CARMINE | SEAC | Common Stock | D | 8.361 | 125.738 | ||||||
| 2014-02-04 | 2014-02-01 | 4 | OLSON THOMAS F | SEAC | Common Stock | D | 8.361 | 136.249 | ||||||
| 2014-02-04 | 2014-02-01 | 4 | CRADDOCK STEVEN | SEAC | Common Stock | D | 8.361 | 38.361 | ||||||
| 2014-02-04 | 2014-02-01 | 4 | Cotton Mary Palermo | SEAC | Common Stock | D | 8.361 | 105.861 | ||||||
| 2014-01-13 | 2014-01-10 | 4 | McEvoy David | SEAC | Common Stock | D | 12,0985 | -631 | -8 | 22.377 | ||||
| 2013-07-18 | 2013-07-16 | 4 | McEvoy David | SEAC | Common Stock | D | 12,3670 | -753 | -9 | 23.008 | ||||
| 2013-05-17 | 2013-05-08 | 4 | McEvoy David | SEAC | Common Stock | D | 10.000 | 23.761 | ||||||
| 2013-05-17 | 2013-05-08 | 4 | Dias Anthony | SEAC | Common Stock | D | 10.000 | 20.761 | ||||||
| 2013-05-15 | 2013-05-13 | 4 | VONA CARMINE | SEAC | Non-Qualified Option (right to buy) | D | 10,72 | -2.500 | 0 | |||||
| 2013-05-15 | 2013-05-13 | 4 | VONA CARMINE | SEAC | Common Stock | D | 10,7200 | 2.500 | 27 | 117.377 | ||||
| 2013-05-15 | 2013-05-14 | 4 | OLSON THOMAS F | SEAC | Non-Qualified Option (right to buy) | D | 10,72 | -2.500 | 0 | |||||
| 2013-05-15 | 2013-05-14 | 4 | OLSON THOMAS F | SEAC | Common Stock | D | 10,7200 | 2.500 | 27 | 127.888 | ||||
| 2013-05-03 | 2013-04-18 | 4 | BORNAK MICHAEL D | SEAC | Common Stock | D | 1.261 | 12.987 | ||||||
| 2013-05-03 | 2013-02-01 | 4 | BORNAK MICHAEL D | SEAC | Common Stock | D | 6.726 | 11.726 | ||||||
| 2013-05-03 | 2012-07-02 | 4 | BORNAK MICHAEL D | SEAC | Common Stock | D | 5.000 | 5.000 | ||||||
| 2013-05-03 | 2013-04-18 | 4 | McEvoy David | SEAC | Common Stock | D | 1.261 | 13.761 | ||||||
| 2013-05-03 | 2013-02-01 | 4 | RAU RAGHAVENDRA | SEAC | Common Stock | D | 32.960 | 177.767 | ||||||
| 2013-05-03 | 2013-04-18 | 4 | Dias Anthony | SEAC | Common Stock | D | 1.261 | 10.761 | ||||||
| 2013-02-20 | 2013-01-31 | 4 | BORNAK MICHAEL D | SEAC | Common Stock | D | 11,15 | 11,1500 | 6.250 | 70 | 6.250 | |||
| 2013-02-13 | 2013-02-12 | 4 | Dias Anthony | SEAC | Incentive Stock Option (right to buy) | D | 7,55 | -2.000 | 0 | |||||
| 2013-02-13 | 2013-02-12 | 4 | Dias Anthony | SEAC | Common Stock | D | 11,6900 | -2.000 | -23 | 9.500 | ||||
| 2013-02-13 | 2013-02-12 | 4 | Dias Anthony | SEAC | Common Stock | D | 7,5500 | 2.000 | 15 | 11.500 | ||||
| 2013-01-29 | 2013-01-25 | 4 | TERINO EDWARD | SEAC | Common Stock | D | 12.000 | 87.000 | ||||||
| 2013-01-29 | 2013-01-25 | 4 | VONA CARMINE | SEAC | Common Stock | D | 12.000 | 114.877 | ||||||
| 2013-01-29 | 2013-01-25 | 4 | OLSON THOMAS F | SEAC | Common Stock | D | 12.000 | 125.388 | ||||||
| 2013-01-29 | 2013-01-25 | 4 | CRADDOCK STEVEN | SEAC | Common Stock | D | 12.000 | 30.000 | ||||||
| 2013-01-29 | 2013-01-25 | 4 | Cotton Mary Palermo | SEAC | Common Stock | D | 12.000 | 97.500 | ||||||
| 2013-01-04 | 2013-01-02 | 4 | McEvoy David | SEAC | Common Stock | D | 5.000 | 12.500 | ||||||
| 2013-01-04 | 2013-01-03 | 4 | Dias Anthony | SEAC | Incentive Stock Option (right to buy) | D | 7,55 | -3.000 | 0 | |||||
| 2013-01-04 | 2013-01-03 | 4 | Dias Anthony | SEAC | Common Stock | D | 10,1000 | -3.000 | -30 | 9.500 | ||||
| 2013-01-04 | 2013-01-03 | 4 | Dias Anthony | SEAC | Common Stock | D | 7,5500 | 3.000 | 23 | 12.500 | ||||
| 2012-12-14 | 2012-10-31 | 4 | BORNAK MICHAEL D | SEAC | Common Stock | D | 9,05 | 9,0500 | 6.250 | 57 | 6.250 | |||
| 2012-12-14 | 2012-07-31 | 4 | BORNAK MICHAEL D | SEAC | Common Stock | D | 7,57 | 7,5700 | 6.250 | 47 | 6.250 | |||
| 2012-10-01 | 2012-09-28 | 4 | OLSON THOMAS F | SEAC | Common Stock | D | 7,8600 | 3.000 | 24 | 113.388 | ||||
| 2012-08-06 | 2012-08-02 | 4 | CRADDOCK STEVEN | SEAC | Common Stock | D | 18.000 | 18.000 | ||||||
| 2012-07-25 | 3 | McEvoy David | SEAC | Common Stock | D | 7.500 | ||||||||
| 2012-07-25 | 3 | Dias Anthony | SEAC | Common Stock | D | 9.500 | ||||||||
| 2012-07-12 | 2012-07-09 | 4 | BORNAK MICHAEL D | SEAC | Common Stock | D | 8,22 | 8,2200 | 6.250 | 51 | 6.250 | |||
| 2012-07-09 | 2012-07-05 | 4 | GOLDFARB IRA | SEAC | Non-Qualified Option (right to buy) | D | 6,20 | -4.500 | 0 | |||||
| 2012-07-09 | 2012-07-05 | 4 | GOLDFARB IRA | SEAC | Common Stock | D | 7,8800 | -4.500 | -35 | 146.102 | ||||
| 2012-07-09 | 2012-07-05 | 4 | GOLDFARB IRA | SEAC | Common Stock | D | 6,2000 | 4.500 | 28 | 150.602 | ||||
| 2012-06-21 | 2012-06-20 | 4 | Davi Steven M | SEAC | Non-Qualified Option (right to by) | D | 6,05 | -4.500 | 0 | |||||
| 2012-06-21 | 2012-06-20 | 4 | Davi Steven M | SEAC | Common Stock | D | 8,3000 | -4.500 | -37 | 61.185 | ||||
| 2012-06-21 | 2012-06-20 | 4 | Davi Steven M | SEAC | Common Stock | D | 6,0500 | 4.500 | 27 | 65.685 | ||||
| 2012-06-19 | 2012-06-19 | 4 | GOLDFARB IRA | SEAC | Common Stock | D | 8,2271 | -1.063 | -9 | 146.102 | ||||
| 2012-06-19 | 2012-06-18 | 4 | GOLDFARB IRA | SEAC | Common Stock | D | 8,1350 | -1.000 | -8 | 147.165 | ||||
| 2012-06-19 | 2012-06-15 | 4 | GOLDFARB IRA | SEAC | Common Stock | D | 8,1208 | -1.566 | -13 | 148.165 | ||||
| 2012-06-14 | 2012-06-14 | 4 | GOLDFARB IRA | SEAC | Common Stock | D | 8,0644 | -3.100 | -25 | 149.731 | ||||
| 2012-06-14 | 2012-06-13 | 4 | GOLDFARB IRA | SEAC | Common Stock | D | 8,0282 | -5.000 | -40 | 152.831 | ||||
| 2012-06-14 | 2012-06-12 | 4 | GOLDFARB IRA | SEAC | Common Stock | D | 8,0263 | -8.271 | -66 | 157.831 | ||||
| 2012-05-16 | 2012-05-14 | 4 | Davi Steven M | SEAC | Non-Qualified Option (right to by) | D | 6,20 | -4.500 | 0 | |||||
| 2012-05-16 | 2012-05-14 | 4 | Davi Steven M | SEAC | Common Stock | D | 8,2000 | -4.500 | -37 | 61.185 | ||||
| 2012-05-16 | 2012-05-14 | 4 | Davi Steven M | SEAC | Common Stock | D | 6,2000 | 4.500 | 28 | 65.685 | ||||
| 2012-05-10 | 2012-01-18 | 5/A | BORNAK MICHAEL D | SEAC | Non-Qualified Stock Option (right to buy) | D | 6,74 | 25.000 | 25.000 | |||||
| 2012-05-10 | 2012-05-09 | 4 | Kelly Anthony W spouse | SEAC | Common Stock | I | 8,4300 | -4.000 | -34 | 5.424 | ||||
| 2012-05-10 | 2012-05-09 | 4 | Kelly Anthony W | SEAC | Common Stock | D | 8,3000 | -4.000 | -33 | 428.310 | ||||
| 2012-05-10 | 2012-05-08 | 4 | Kelly Anthony W | SEAC | Common Stock | D | 8,4500 | -4.000 | -34 | 9.424 | ||||
| 2012-05-10 | 2012-05-08 | 4 | Kelly Anthony W spouse | SEAC | Common Stock | I | 8,4500 | -4.000 | -34 | 9.424 | ||||
| 2012-05-07 | 2012-05-04 | 4 | Kelly Anthony W spouse | SEAC | Common Stock | I | 8,4500 | -6.000 | -51 | 13.424 | ||||
| 2012-05-07 | 2012-05-04 | 4 | Kelly Anthony W | SEAC | Common Stock | D | 8,4800 | -6.000 | -51 | 461.310 | ||||
| 2012-05-03 | 2012-03-28 | 4 | GOLDFARB IRA | SEAC | Common Stock | D | 7.330 | 166.102 | ||||||
| 2012-05-03 | 2012-03-28 | 4 | Davi Steven M | SEAC | Common Stock | D | 8.064 | 61.185 | ||||||
| 2012-05-03 | 2012-03-28 | 4 | Kelly Anthony W | SEAC | Common Stock | D | 9.975 | 467.310 | ||||||
| 2012-05-02 | 2012-04-30 | 4 | RAU RAGHAVENDRA | SEAC | Non-Qualified Stock Option (right to buy) | D | 8,22 | 875.000 | 875.000 | |||||
| 2012-05-02 | 2012-04-30 | 4 | RAU RAGHAVENDRA | SEAC | Common Stock | D | 60.827 | 144.807 | ||||||
| 2012-05-01 | 2012-05-01 | 4 | TERINO EDWARD | SEAC | Common Stock | D | 8,4500 | 9.077 | 77 | 75.000 | ||||
| 2012-05-01 | 2012-05-01 | 4 | TERINO EDWARD | SEAC | Common Stock | D | 8,4400 | 3.000 | 25 | 65.923 | ||||
| 2012-05-01 | 2012-04-30 | 4 | TERINO EDWARD | SEAC | Common Stock | D | 8,2000 | 7.923 | 65 | 62.923 | ||||
| 2012-05-01 | 2012-05-01 | 4 | OLSON THOMAS F | SEAC | Common Stock | D | 2.898 | 110.388 | ||||||
| 2012-04-16 | 2012-04-12 | 4 | Feld Peter A By Starboard Value and Opportunity S LLC | SEAC | Common Stock | I | 8,1200 | 22.650 | 184 | 22.650 | ||||
| 2012-04-16 | 2012-04-12 | 4 | Feld Peter A By Starboard Value and Opportunity Fund Ltd | SEAC | Common Stock | I | 8,1200 | 91.650 | 744 | 2.344.472 | ||||
| 2012-04-16 | 2012-04-12 | 4 | Feld Peter A By Starboard Value LP | SEAC | Common Stock | I | 8,1200 | 35.700 | 290 | 422.220 | ||||
| 2012-04-12 | 2012-04-11 | 4 | Kelly Anthony W | SEAC | Common Stock | D | 8,0900 | -800 | -6 | 457.335 | ||||
| 2012-04-12 | 2012-04-10 | 4 | Kelly Anthony W | SEAC | Common Stock | D | 8,0800 | -6.000 | -48 | 458.135 | ||||
| 2012-04-10 | 2012-04-09 | 4 | Kelly Anthony W | SEAC | Common Stock | D | 8,0700 | -4.000 | -32 | 464.135 | ||||
| 2012-04-06 | 2012-04-03 | 4 | GOLDFARB IRA | SEAC | Common Stock | D | 7,9400 | -8.500 | -67 | 158.772 | ||||
| 2012-04-06 | 2012-04-03 | 4 | Davi Steven M | SEAC | Common Stock | D | 7,9725 | -5.587 | -45 | 53.121 | ||||
| 2012-04-03 | 2012-04-02 | 4 | OLSON THOMAS F | SEAC | Common Stock | D | 2.898 | 107.490 | ||||||
| 2012-04-03 | 2012-03-01 | 4 | OLSON THOMAS F | SEAC | Common Stock | D | 2.898 | 104.592 | ||||||
| 2012-04-03 | 2012-02-01 | 4 | OLSON THOMAS F | SEAC | Common Stock | D | 2.898 | 101.694 | ||||||
| 2012-04-03 | 2012-04-02 | 4 | RAU RAGHAVENDRA | SEAC | Common Stock | D | 5.796 | 83.980 | ||||||
| 2012-04-03 | 2012-03-01 | 4 | RAU RAGHAVENDRA | SEAC | Common Stock | D | 5.796 | 78.184 | ||||||
| 2012-04-03 | 2012-02-01 | 4 | RAU RAGHAVENDRA | SEAC | Common Stock | D | 5.796 | 72.388 | ||||||
| 2012-03-16 | 2012-01-18 | 5 | RAU RAGHAVENDRA | SEAC | Incentive Stock Option (right to buy) | D | 6,74 | 150.000 | 150.000 | |||||
| 2012-03-16 | 2012-01-18 | 5 | RAU RAGHAVENDRA | SEAC | Common Stock | D | 25.000 | 66.592 | ||||||
| 2012-03-16 | 2012-01-18 | 5 | RAU RAGHAVENDRA | SEAC | Common Stock | D | 5.796 | 41.592 | ||||||
| 2012-03-16 | 2012-01-18 | 5 | RAU RAGHAVENDRA | SEAC | Common Stock | D | 5.796 | 35.796 | ||||||
| 2012-03-16 | 2012-01-18 | 5 | OLSON THOMAS F | SEAC | Non-Qualified Stock Option (right to buy) | D | 6,74 | 75.000 | 75.000 | |||||
| 2012-03-16 | 2012-01-18 | 5 | OLSON THOMAS F | SEAC | Common Stock | D | 8.000 | 98.796 | ||||||
| 2012-03-16 | 2012-01-18 | 5 | OLSON THOMAS F | SEAC | Common Stock | D | 2.898 | 90.796 | ||||||
| 2012-03-16 | 2012-01-18 | 5 | OLSON THOMAS F | SEAC | Common Stock | D | 2.898 | 87.898 | ||||||
| 2012-03-16 | 2012-01-18 | 5 | BORNAK MICHAEL D | SEAC | Non-Qualified Stock Option (right to buy) | D | 6,74 | 25.000 | 25.000 | |||||
| 2012-02-15 | 2012-02-13 | 4 | TERINO EDWARD | SEAC | Common Stock | D | 3.000 | 55.000 | ||||||
| 2012-02-15 | 2012-02-13 | 4 | VONA CARMINE | SEAC | Common Stock | D | 3.000 | 102.877 | ||||||
| 2012-01-17 | 2012-01-13 | 4 | Kelly Anthony W spouse | SEAC | Common Stock | I | 6,5700 | -4.000 | -26 | 19.424 | ||||
| 2012-01-17 | 2012-01-12 | 4 | Kelly Anthony W spouse | SEAC | Common Stock | I | 6,6900 | -5.000 | -33 | 23.424 | ||||
| 2012-01-12 | 2012-01-11 | 4 | Kelly Anthony W spouse | SEAC | Common Stock | I | 6,6700 | -5.000 | -33 | 28.424 | ||||
| 2012-01-09 | 2012-01-06 | 4 | Kelly Anthony W spouse | SEAC | Common Stock | I | 6,9200 | -5.000 | -35 | 33.424 |
P
Offener Markt oder privater Kauf von nicht-derivativen oder derivativen Wertpapieren
S
Freiverkauf oder privater Verkauf von nicht-derivativen oder derivativen Wertpapieren
A
Gewährung, Vergabe oder sonstiger Erwerb von Wertpapieren des Unternehmens (z. B. eine Option)
C
Umwandlung von Derivaten
D
Verkauf oder Rückübertragung von Wertpapieren an das Unternehmen
F
Zahlung des Ausübungspreises oder der Steuerschuld mit einem Teil der vom Unternehmen erhaltenen Wertpapiere
G
Schenkung von Wertpapieren durch oder an den Insider
K
Aktien-Swaps und ähnliche Absicherungstransaktionen
M
Ausübung oder Umwandlung eines vom Unternehmen erhaltenen derivativen Wertpapiers (z. B. einer Option)
V
Eine freiwillig auf Formular 4 gemeldete Transaktion
J
Sonstige (mit einer Fußnote zur Beschreibung der Transaktion)