Basisstatistiken
| Institutionelle Aktien (Long) | 3.707.470 - 47,01% (ex 13D/G) - change of -1,07MM shares -22,46% MRQ |
| Institutioneller Wert (Long) | $ 38.633 USD ($1000) |
Institutioneller Eigentümerschaft und Aktionäre
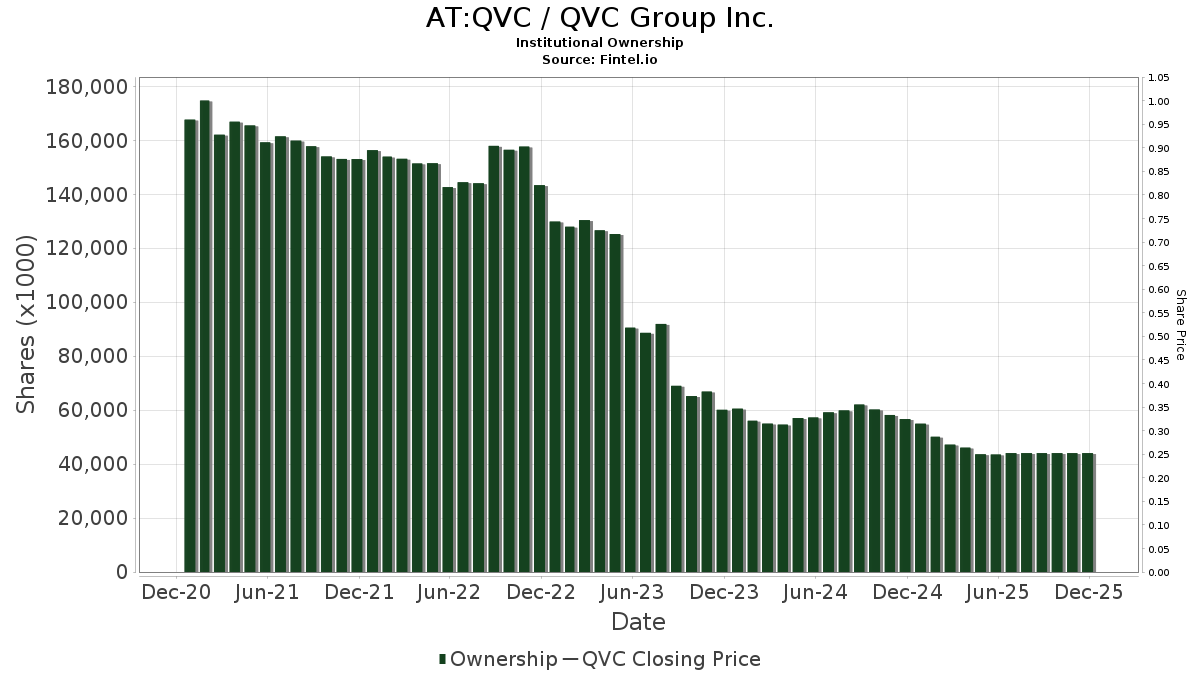
QVC Group Inc. (AT:QVC) hat 67 institutionelle Eigentümer und Aktionäre, die 13D/G oder 13F Formulare bei der Securities Exchange Commission (SEC) eingereicht haben. Diese Institutionen halten insgesamt 3,707,470 Aktien. Die größten Aktionäre sind Charles Schwab Investment Management Inc, Contrarius Group Holdings Ltd, Vanguard Group Inc, Permit Capital, LLC, Dakota Wealth Management, BlackRock, Inc., Wittenberg Investment Management, Inc., Geode Capital Management, Llc, UBS Group AG, and Man Group plc .
QVC Group Inc. (WBAG:QVC) Die institutionelle Eigentümerstruktur zeigt die aktuellen Positionen von Institutionen und Fonds im Unternehmen sowie die jüngsten Veränderungen der Positionsgröße. Zu den Großaktionären können Einzelanleger, Investmentfonds, Hedgefonds oder Institutionen gehören. Der Schedule 13D zeigt an, dass der Investor mehr als 5% des Unternehmens hält (oder gehalten hat) und beabsichtigt (oder beabsichtigt hat), aktiv eine Änderung der Geschäftsstrategie zu verfolgen. Schedule 13G zeigt eine passive Investition von über 5% an.
Fondsstimmung-Score
Der Fondsstimmung-Score (auch bekannt als Eigentümer-Akkumulations-Score) ermittelt die Aktien, die am meisten von Fonds gekauft werden. Er ist das Ergebnis eines ausgeklügelten quantitativen Multifaktormodells, das die Unternehmen mit den höchsten institutionellen Käufen identifiziert. Das Scoring-Modell verwendet eine Kombination aus der Gesamtzunahme der offengelegten Eigentümer, den Änderungen der Portfolioallokationen in diesen Eigentümern und anderen Metriken. Die Zahl reicht von 0 bis 100, wobei höhere Zahlen ein höheres Maß an Kapitalakkumulation als bei anderen Unternehmen anzeigen und 50 den Durchschnitt darstellt.
Aktualisierungshäufigkeit: Täglich
Siehe Ownership Explorer, der eine Liste der am höchsten bewerteten Unternehmen enthält.
AI+ Ask Fintel’s AI assistant about QVC Group Inc..
Select a question to share a public post with an AI-crafted answer.
Thinking of good questions…
13F und NPORT Einreichungen
Details zu 13F-Einreichungen sind kostenlos. Für Details zu NP-Einreichungen ist eine Premium-Mitgliedschaft erforderlich. Grüne Zeilen zeigen neue Positionen an. Rote Zeilen zeigen geschlossene Positionen an. Klicken Sie auf das Link Symbol, um den gesamten Transaktionsverlauf zu sehen.
Upgrade
um Prämiendaten freizuschalten und nach Excel zu exportieren ![]() .
.
| Datei Datum | Quelle | Anleger | Typ | Durchschnittlicher Preis (Est) |
Aktien | Δ Aktien (%) |
Gemeldeter Wert ($1000) |
Δ Wert (%) |
Port Alloc (%) |
|
|---|---|---|---|---|---|---|---|---|---|---|
| 2025-09-29 | NP | KCXIX - Knights of Columbus U.S. All Cap Index Fund I Shares | 32 | -97,83 | 0 | |||||
| 2025-11-14 | 13F | Northwestern Mutual Wealth Management Co | 0 | -100,00 | 0 | |||||
| 2026-01-26 | 13F | Whittier Trust Co Of Nevada Inc | 2 | 0,00 | 0 | |||||
| 2026-02-17 | 13F | Qube Research & Technologies Ltd | 10.354 | -3,29 | 108 | -25,00 | ||||
| 2026-02-17 | 13F | Citadel Advisors Llc | Put | 0 | -100,00 | 0 | -100,00 | |||
| 2026-02-17 | 13F | Bank Of America Corp /de/ | 405 | -98,14 | 4 | -98,63 | ||||
| 2026-02-09 | 13F | Investors Portfolio Services LLC | 8 | 0 | ||||||
| 2026-01-15 | 13F | Fortitude Family Office, LLC | 88 | 1 | ||||||
| 2026-02-13 | 13F | Diametric Capital, LP | 43.659 | 149,67 | 457 | 94,04 | ||||
| 2026-02-13 | 13F | Wells Fargo & Company/mn | 79 | -1,25 | 1 | -100,00 | ||||
| 2026-02-13 | 13F | MAI Capital Management | 27 | 0,00 | 0 | |||||
| 2026-02-17 | 13F | Fmr Llc | 39 | -22,00 | 0 | |||||
| 2026-01-21 | 13F | Newbridge Financial Services Group, Inc. | 18 | 0,00 | 0 | |||||
| 2026-02-11 | 13F | Group One Trading, L.p. | 15.794 | 102,51 | 165 | 57,14 | ||||
| 2026-02-12 | 13F | BlackRock, Inc. | 137.984 | 2,26 | 1.443 | -20,71 | ||||
| 2026-01-30 | 13F | Us Bancorp \de\ | 0 | -100,00 | 0 | |||||
| 2026-01-21 | 13F | Future Financial Wealth Managment LLC | 0 | -100,00 | 0 | |||||
| 2026-02-06 | 13F | Covestor Ltd | 0 | 0 | ||||||
| 2026-02-11 | 13F | Townsquare Capital Llc | 0 | -100,00 | 0 | -100,00 | ||||
| 2026-02-11 | 13F | TCTC Holdings, LLC | 21 | 0,00 | 0 | |||||
| 2026-02-12 | 13F | Jane Street Group, Llc | Call | 18.800 | -31,89 | 197 | -47,31 | |||
| 2026-02-12 | 13F | Jane Street Group, Llc | Put | 26.500 | -37,20 | 277 | -51,32 | |||
| 2026-02-18 | 13F/A | Empowered Funds, LLC | 11.084 | 0,03 | 116 | -22,82 | ||||
| 2026-02-18 | 13F | GWM Advisors LLC | 5 | 0,00 | 0 | |||||
| 2025-11-14 | 13F | Saba Capital Management, L.P. | 0 | -100,00 | 0 | |||||
| 2025-10-21 | 13F | Optimum Investment Advisors | 7 | 0,00 | 0 | |||||
| 2026-02-09 | 13F | Simplify Asset Management Inc. | 16.696 | 39,13 | 175 | 8,07 | ||||
| 2026-02-13 | 13F | State Street Corp | 34.451 | 0,00 | 360 | -22,41 | ||||
| 2026-02-03 | 13F | SBI Securities Co., Ltd. | 5 | 0,00 | 0 | |||||
| 2026-01-29 | 13F | Vanguard Group Inc | 612.843 | -0,34 | 6.410 | -22,72 | ||||
| 2026-01-08 | 13F | Versant Capital Management, Inc | 3 | 0,00 | 0 | |||||
| 2026-01-23 | 13F | Avion Wealth | 0 | -100,00 | 0 | |||||
| 2026-02-11 | 13F | Permit Capital, LLC | 388.062 | 7,26 | 4.059 | -16,82 | ||||
| 2025-09-29 | NP | PRFZ - Invesco FTSE RAFI US 1500 Small-Mid ETF This fund is a listed as child fund of Invesco Ltd. and if that institution has disclosed ownership in this security, then these positions will not be double counted when calculating total shares and total value | 14.805 | -98,68 | 57 | -66,07 | ||||
| 2026-02-17 | 13F | CastleKnight Management LP | 0 | -100,00 | 0 | |||||
| 2026-02-10 | 13F | Rothschild Investment Llc | 0 | -100,00 | 0 | |||||
| 2026-02-17 | 13F | Jones Financial Companies Lllp | 26 | 0,00 | 0 | |||||
| 2026-02-11 | 13F | Contrarius Group Holdings Ltd | 702.768 | 0,00 | 7.351 | -22,47 | ||||
| 2025-09-26 | NP | PRF - Invesco FTSE RAFI US 1000 ETF This fund is a listed as child fund of Invesco Ltd. and if that institution has disclosed ownership in this security, then these positions will not be double counted when calculating total shares and total value | 1.915 | -94,77 | 7 | 40,00 | ||||
| 2026-02-17 | 13F | Voleon Capital Management Lp | 0 | -100,00 | 0 | -100,00 | ||||
| 2026-02-05 | 13F | Allworth Financial LP | 1 | -75,00 | 0 | |||||
| 2025-11-14 | 13F | D. E. Shaw & Co., Inc. | 0 | -100,00 | 0 | |||||
| 2026-02-17 | 13F | Jump Financial, LLC | 13.200 | 138 | ||||||
| 2026-02-13 | 13F | Brooklands Fund Management Ltd | Call | 0 | -100,00 | 0 | ||||
| 2026-02-24 | 13F | DGS Capital Management, LLC | 0 | -100,00 | 0 | |||||
| 2026-02-17 | 13F | Two Sigma Investments, Lp | 25.318 | -6,23 | 265 | -27,47 | ||||
| 2026-02-03 | 13F | Investment Management Associates Inc /adv | 21.369 | -56,03 | 224 | -65,95 | ||||
| 2026-02-19 | 13F | Invesco Ltd. | 0 | -100,00 | 0 | |||||
| 2025-11-06 | 13F | Fairscale Capital, LLC | 0 | -100,00 | 0 | |||||
| 2026-02-10 | 13F | Bnp Paribas Arbitrage, Sa | 27 | -15,62 | 0 | |||||
| 2026-02-02 | 13F | Danske Bank A/s | 1 | 0,00 | 0 | |||||
| 2025-11-13 | 13F | Parallel Advisors, LLC | 0 | -100,00 | 0 | |||||
| 2026-02-11 | 13F | Hall Kathryn A. | 0 | -100,00 | 0 | |||||
| 2025-11-12 | 13F | Huntington National Bank | 0 | -100,00 | 0 | |||||
| 2026-01-29 | 13F | Comerica Bank | 116 | 0,00 | 1 | 0,00 | ||||
| 2025-11-14 | 13F | Goldman Sachs Group Inc | 0 | -100,00 | 0 | |||||
| 2026-02-09 | 13F | Geode Capital Management, Llc | 90.206 | 2,20 | 944 | -20,82 | ||||
| 2026-02-13 | 13F | Wittenberg Investment Management, Inc. | 114.193 | 41,05 | 1.194 | 9,34 | ||||
| 2026-02-17 | 13F | Susquehanna International Group, Llp | 19.048 | -65,27 | 199 | -73,07 | ||||
| 2026-02-17 | 13F | Advisor Group Holdings, Inc. | 753 | 0,53 | 8 | 16,67 | ||||
| 2026-01-20 | 13F | Signaturefd, Llc | 28 | 0,00 | 0 | |||||
| 2026-02-17 | 13F | Susquehanna International Group, Llp | Put | 31.200 | -59,48 | 326 | -68,59 | |||
| 2026-02-17 | 13F | Susquehanna International Group, Llp | Call | 28.400 | -29,88 | 297 | -45,60 | |||
| 2026-02-13 | 13F | Brooklands Fund Management Ltd | 35.457 | 381 | ||||||
| 2026-02-12 | 13F | McMillan Office, Inc. | 8 | 0 | ||||||
| 2026-02-13 | 13F | Morgan Stanley | 19.135 | -3,45 | 200 | -25,09 | ||||
| 2025-11-04 | 13F | Guerra Advisors Inc | 16 | 0 | ||||||
| 2026-02-11 | 13F | Hilton Head Capital Partners, LLC | 76 | 1 | ||||||
| 2026-02-03 | 13F | Costello Asset Management, INC | 20 | 0,00 | 0 | |||||
| 2026-02-12 | 13F | Renaissance Technologies Llc | 54.831 | 8,94 | 574 | -15,49 | ||||
| 2026-02-12 | 13F | Wealthspire Advisors, LLC | 0 | -100,00 | 0 | |||||
| 2026-02-13 | 13F | Charles Schwab Investment Management Inc | 995.190 | 39,40 | 10.410 | 8,09 | ||||
| 2026-02-10 | 13F | Hazlett, Burt & Watson, Inc. | 1 | 0,00 | 0 | |||||
| 2026-02-12 | 13F | BRYN MAWR TRUST Co | 0 | -100,00 | 0 | -100,00 | ||||
| 2026-02-12 | 13F | CIBC Private Wealth Group, LLC | 8 | -75,76 | 0 | |||||
| 2026-02-10 | 13F | JTC Employer Solutions Trusteee Ltd | 492 | 0,00 | 0 | |||||
| 2026-02-10 | 13F | KERR FINANCIAL PLANNING Corp | 0 | -100,00 | 0 | |||||
| 2025-11-14 | 13F | Wolverine Trading, Llc | Call | 39.600 | 555 | |||||
| 2026-02-06 | 13F | Global Retirement Partners, LLC | 9 | 0,00 | 0 | |||||
| 2025-11-14 | 13F | Wolverine Trading, Llc | Put | 13.200 | 185 | |||||
| 2026-02-17 | 13F | Northern Trust Corp | 16.668 | 14,71 | 174 | -11,22 | ||||
| 2026-02-17 | 13F | Prelude Capital Management, Llc | 10.863 | 114 | ||||||
| 2026-02-17 | 13F | Russell Investments Group, Ltd. | 4.129 | 43 | ||||||
| 2026-02-17 | 13F | Bridgeway Capital Management Inc | 11.081 | 0,00 | 116 | -22,82 | ||||
| 2025-11-19 | 13F | Sunbelt Securities, Inc. | 0 | -100,00 | 0 | |||||
| 2026-02-17 | 13F | Citadel Advisors Llc | Call | 38.100 | -0,52 | 399 | -22,87 | |||
| 2026-01-13 | 13F | Dakota Wealth Management | 154.411 | -6,14 | 1.615 | -27,22 | ||||
| 2026-01-29 | 13F | UBS Group AG | 74.398 | 5,18 | 778 | -18,45 | ||||
| 2026-02-17 | 13F | Brevan Howard Capital Management LP | 0 | -100,00 | 0 | -100,00 | ||||
| 2026-02-11 | 13F | Deseret Mutual Benefit Administrators | 82 | 0,00 | 1 | -100,00 | ||||
| 2026-02-17 | 13F | Man Group plc | 59.212 | -15,49 | 619 | -34,50 | ||||
| 2025-11-14 | 13F | Two Sigma Advisers, Lp | 0 | -100,00 | 0 | -100,00 | ||||
| 2025-11-14 | 13F | Raymond James Financial Inc | 0 | -100,00 | 0 | |||||
| 2025-11-12 | 13F | Simplex Trading, Llc | 0 | -100,00 | 0 | |||||
| 2026-01-13 | 13F | Mather Group, Llc. | 0 | -100,00 | 0 | |||||
| 2026-02-14 | 13F | Rockefeller Capital Management L.P. | 6 | 0 | ||||||
| 2026-01-23 | 13F | Farther Finance Advisors, LLC | 1 | 0 | ||||||
| 2026-02-06 | 13F | Tortoise Investment Management, LLC | 0 | -100,00 | 0 | |||||
| 2026-02-17 | 13F | Aristeia Capital Llc | 0 | -100,00 | 0 | |||||
| 2026-02-17 | 13F | Price T Rowe Associates Inc /md/ | 12.629 | 0 | ||||||
| 2026-02-17 | 13F | Royal Bank Of Canada | 16 | -99,94 | 0 | -100,00 | ||||
| 2026-01-26 | 13F | Cwm, Llc | 11 | 0,00 | 0 | |||||
| 2025-11-14 | 13F | XTX Topco Ltd | 0 | -100,00 | 0 | -100,00 |