Basisstatistiken
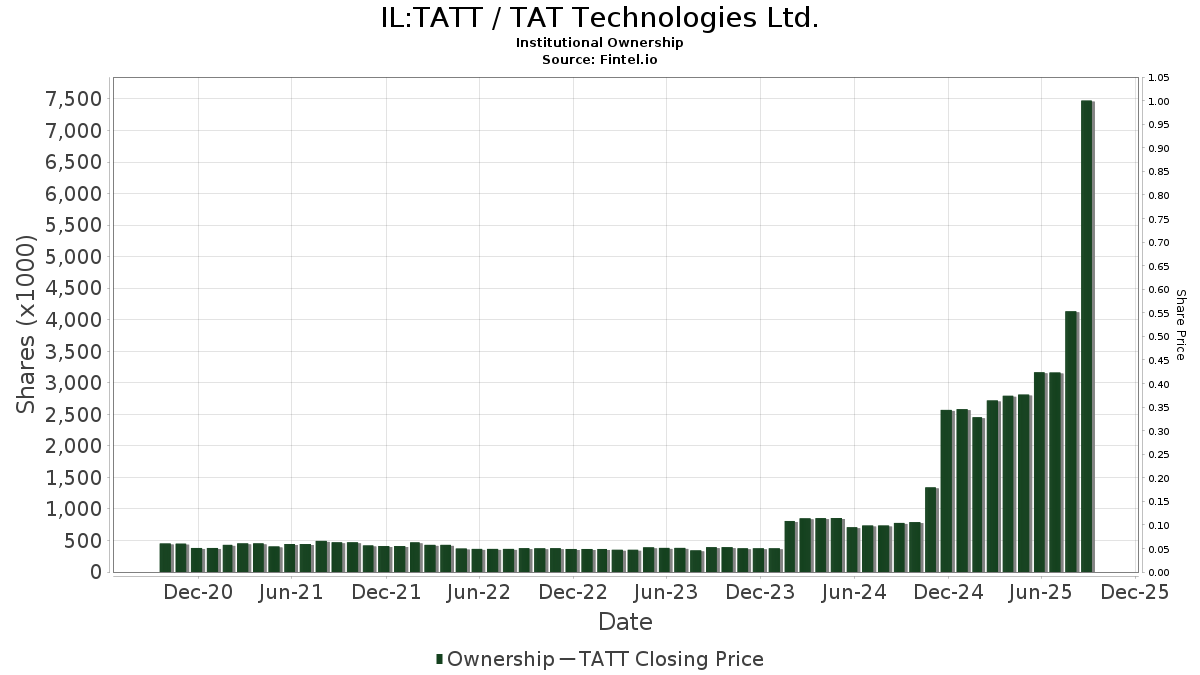
| Institutionelle Aktien (Long) | 7.571.686 - 58,32% (ex 13D/G) - change of -0,36MM shares -4,56% MRQ |
| Institutioneller Wert (Long) | $ 290.883 USD ($1000) |
Institutioneller Eigentümerschaft und Aktionäre
TAT Technologies Ltd. (IL:TATT) hat 90 institutionelle Eigentümer und Aktionäre, die 13D/G oder 13F Formulare bei der Securities Exchange Commission (SEC) eingereicht haben. Diese Institutionen halten insgesamt 7,571,686 Aktien. Die größten Aktionäre sind Meitav Dash Investments Ltd, Y.D. More Investments Ltd, Wasatch Advisors Inc, Migdal Insurance & Financial Holdings Ltd., Clal Insurance Enterprises Holdings Ltd, Penn Capital Management Co Inc, Driehaus Capital Management Llc, Russell Investments Group, Ltd., Phoenix Holdings Ltd., and New York State Common Retirement Fund .
TAT Technologies Ltd. (TASE:TATT) Die institutionelle Eigentümerstruktur zeigt die aktuellen Positionen von Institutionen und Fonds im Unternehmen sowie die jüngsten Veränderungen der Positionsgröße. Zu den Großaktionären können Einzelanleger, Investmentfonds, Hedgefonds oder Institutionen gehören. Der Schedule 13D zeigt an, dass der Investor mehr als 5% des Unternehmens hält (oder gehalten hat) und beabsichtigt (oder beabsichtigt hat), aktiv eine Änderung der Geschäftsstrategie zu verfolgen. Schedule 13G zeigt eine passive Investition von über 5% an.
Fondsstimmung-Score
Der Fondsstimmung-Score (auch bekannt als Eigentümer-Akkumulations-Score) ermittelt die Aktien, die am meisten von Fonds gekauft werden. Er ist das Ergebnis eines ausgeklügelten quantitativen Multifaktormodells, das die Unternehmen mit den höchsten institutionellen Käufen identifiziert. Das Scoring-Modell verwendet eine Kombination aus der Gesamtzunahme der offengelegten Eigentümer, den Änderungen der Portfolioallokationen in diesen Eigentümern und anderen Metriken. Die Zahl reicht von 0 bis 100, wobei höhere Zahlen ein höheres Maß an Kapitalakkumulation als bei anderen Unternehmen anzeigen und 50 den Durchschnitt darstellt.
Aktualisierungshäufigkeit: Täglich
Siehe Ownership Explorer, der eine Liste der am höchsten bewerteten Unternehmen enthält.
AI+ Ask Fintel’s AI assistant about TAT Technologies Ltd..
Select a question to share a public post with an AI-crafted answer.
Thinking of good questions…
13F und NPORT Einreichungen
Details zu 13F-Einreichungen sind kostenlos. Für Details zu NP-Einreichungen ist eine Premium-Mitgliedschaft erforderlich. Grüne Zeilen zeigen neue Positionen an. Rote Zeilen zeigen geschlossene Positionen an. Klicken Sie auf das Link Symbol, um den gesamten Transaktionsverlauf zu sehen.
Upgrade
um Prämiendaten freizuschalten und nach Excel zu exportieren ![]() .
.
| Datei Datum | Quelle | Anleger | Typ | Durchschnittlicher Preis (Est) |
Aktien | Δ Aktien (%) |
Gemeldeter Wert ($1000) |
Δ Wert (%) |
Port Alloc (%) |
|
|---|---|---|---|---|---|---|---|---|---|---|
| 2026-01-14 | 13F | Hennion & Walsh Asset Management, Inc. | 77.134 | 60,03 | 3.445 | 62,30 | ||||
| 2026-02-18 | 13F | GWM Advisors LLC | 0 | -100,00 | 0 | |||||
| 2026-01-29 | 13F | UBS Group AG | 28.755 | 110,71 | 1.284 | 114,00 | ||||
| 2026-02-13 | 13F | Morgan Dempsey Capital Management Llc | 8.505 | 0,00 | 380 | 2,43 | ||||
| 2026-02-17 | 13F | G2 Investment Partners Management LLC | 10.000 | -79,47 | 447 | -79,20 | ||||
| 2025-11-12 | 13F | Monashee Investment Management LLC | 0 | -100,00 | 0 | -100,00 | ||||
| 2026-01-28 | 13F | Migdal Insurance & Financial Holdings Ltd. | 386.996 | 92,13 | 17 | 112,50 | ||||
| 2026-02-06 | 13F | GPS Wealth Strategies Group, LLC | 100 | 4 | ||||||
| 2025-09-26 | NP | PCSGX - PACE Small/Medium Co Growth Equity Investments Class P | 8.810 | 304 | ||||||
| 2026-02-17 | 13F | Citadel Advisors Llc | 89.210 | 535,99 | 3.984 | 545,71 | ||||
| 2025-11-14 | 13F | Walleye Capital LLC | 0 | -100,00 | 0 | -100,00 | ||||
| 2026-02-13 | 13F | Next Century Growth Investors Llc | 132.154 | 5.902 | ||||||
| 2025-11-13 | 13F | MYDA Advisors LLC | 0 | -100,00 | 0 | -100,00 | ||||
| 2026-01-30 | 13F | North Star Investment Management Corp. | 0 | -100,00 | 0 | |||||
| 2026-02-05 | 13F | Cambridge Investment Research Advisors, Inc. | 36.828 | 652,51 | 2 | |||||
| 2026-02-13 | 13F | Centiva Capital, LP | 0 | -100,00 | 0 | |||||
| 2025-11-14 | 13F | Two Sigma Advisers, Lp | 0 | -100,00 | 0 | -100,00 | ||||
| 2026-02-11 | 13F | MCF Advisors LLC | 169 | 8 | ||||||
| 2026-02-13 | 13F | Marshall Wace, Llp | 0 | -100,00 | 0 | |||||
| 2026-02-13 | 13F | Clal Insurance Enterprises Holdings Ltd | 360.884 | 0,00 | 16 | 6,67 | ||||
| 2026-02-14 | 13F | Rockefeller Capital Management L.P. | 39 | 2 | ||||||
| 2026-02-17 | 13F | Raymond James Financial Inc | 0 | -100,00 | 0 | |||||
| 2026-02-17 | 13F | Advisory Services Network, LLC | 0 | -100,00 | 0 | |||||
| 2026-02-12 | 13F | Jane Street Group, Llc | 43.559 | 97,50 | 1.945 | 100,31 | ||||
| 2026-02-17 | 13F | Qube Research & Technologies Ltd | 12.276 | 548 | ||||||
| 2025-09-29 | NP | CFSSX - Column Small Cap Select Fund | 84.632 | 3.085 | ||||||
| 2026-02-13 | 13F | Arrowstreet Capital, Limited Partnership | 5.430 | -90,52 | 244 | -89,57 | ||||
| 2026-02-17 | 13F | Driehaus Capital Management Llc | 323.773 | 5,19 | 14.460 | 6,69 | ||||
| 2026-02-17 | 13F | Jones Financial Companies Lllp | 137 | 0,00 | 6 | 20,00 | ||||
| 2025-11-13 | 13F | Jump Financial, LLC | 0 | -100,00 | 0 | -100,00 | ||||
| 2026-02-10 | 13F | Meitav Dash Investments Ltd | 1.208.738 | -9,40 | 54.221 | -2,87 | ||||
| 2026-02-17 | 13F | Advisor Group Holdings, Inc. | 9.661 | 38,29 | 431 | 67,05 | ||||
| 2026-02-17 | 13F | Quadrature Capital Ltd | 14.116 | 630 | ||||||
| 2026-01-23 | 13F | Oak Ridge Investments Llc | 25.983 | 1.160 | ||||||
| 2025-11-13 | 13F | Winton Capital Group Ltd | 0 | -100,00 | 0 | -100,00 | ||||
| 2026-02-17 | 13F | First Manhattan Co | 4.900 | 0,00 | 219 | 1,40 | ||||
| 2026-03-03 | 13F/A | Caitong International Asset Management Co., Ltd | 190 | 8 | ||||||
| 2026-02-13 | 13F | Sei Investments Co | 20.567 | 919 | ||||||
| 2026-02-09 | 13F | Geode Capital Management, Llc | 5.856 | 0,00 | 262 | 1,56 | ||||
| 2026-02-12 | 13F | Renaissance Technologies Llc | 177.002 | -10,97 | 7.905 | -9,70 | ||||
| 2026-02-17 | 13F | Credit Agricole S A | 21.564 | -13,74 | 963 | -12,45 | ||||
| 2026-02-13 | 13F | Virtus ETF Advisers LLC | 6.859 | 0,00 | 306 | 1,32 | ||||
| 2025-10-24 | 13F | Valmark Advisers, Inc. | 0 | -100,00 | 0 | -100,00 | ||||
| 2026-02-10 | 13F | Catalyst Capital Advisors LLC | 900 | 0,00 | 40 | 2,56 | ||||
| 2025-11-14 | 13F | Alta Fox Capital Management, Llc | 0 | -100,00 | 0 | -100,00 | ||||
| 2026-02-11 | 13F | Provident Co of the Employees of the Hebrew University LTD | 19.900 | 889 | ||||||
| 2026-02-17 | 13F | Monimus Capital Management, Lp | 14.156 | 632 | ||||||
| 2025-11-14 | 13F | ExodusPoint Capital Management, LP | 0 | -100,00 | 0 | |||||
| 2026-02-13 | 13F | Quarry LP | 23 | -68,06 | 1 | -66,67 | ||||
| 2026-02-02 | 13F | Kornitzer Capital Management Inc /ks | 40.171 | 0,43 | 1.794 | 1,87 | ||||
| 2026-02-10 | 13F | Bnp Paribas Arbitrage, Sa | 0 | -100,00 | 0 | |||||
| 2026-02-11 | 13F | Jpmorgan Chase & Co | 10.049 | -64,69 | 449 | -64,25 | ||||
| 2026-02-13 | 13F | Barclays Plc | 175 | 0,00 | 8 | 0,00 | ||||
| 2026-02-13 | 13F | Lord, Abbett & Co. Llc | 208.443 | -2,65 | 9 | 0,00 | ||||
| 2026-02-11 | 13F | LPL Financial LLC | 4.667 | -0,02 | 208 | 1,46 | ||||
| 2025-11-14 | 13F | Cubist Systematic Strategies, LLC | 0 | -100,00 | 0 | -100,00 | ||||
| 2026-02-06 | 13F | IFP Advisors, Inc | 977 | -49,72 | 44 | -49,41 | ||||
| 2026-02-09 | 13F | Penn Capital Management Co Inc | 353.577 | -1,17 | 15.807 | 0,24 | ||||
| 2026-02-17 | 13F | Russell Investments Group, Ltd. | 258.153 | 71,19 | 11.529 | 73,66 | ||||
| 2026-02-06 | 13F | Pnc Financial Services Group, Inc. | 1.200 | 0,00 | 54 | 1,92 | ||||
| 2026-02-09 | 13F | Roubaix Capital, LLC | 0 | -100,00 | 0 | |||||
| 2026-02-13 | 13F | Y-Intercept (Hong Kong) Ltd | 11.019 | 47,39 | 492 | 49,54 | ||||
| 2026-02-17 | 13F | Trexquant Investment LP | 13.258 | -67,41 | 592 | -66,95 | ||||
| 2026-02-12 | 13F | Wasatch Advisors Inc | 710.764 | -13,77 | 31.743 | -12,53 | ||||
| 2026-02-17 | 13F | Bank Of America Corp /de/ | 31.028 | 23,55 | 1.386 | 25,34 | ||||
| 2026-02-11 | 13F | Janney Montgomery Scott LLC | 0 | -100,00 | 0 | |||||
| 2026-02-17 | 13F | Millennium Management Llc | 45.536 | 2.034 | ||||||
| 2026-02-13 | 13F | Diametric Capital, LP | 11.958 | 105,64 | 534 | 108,59 | ||||
| 2025-09-26 | NP | RMYAX - Multi-Strategy Income Fund Class A | 5.196 | 179 | ||||||
| 2026-02-17 | 13F | Two Sigma Investments, Lp | 27.727 | -38,42 | 1.238 | -37,54 | ||||
| 2025-11-05 | 13F | Anthracite Investment Company, Inc. | 0 | -100,00 | 0 | -100,00 | ||||
| 2025-09-29 | NP | LAMGX - Lord Abbett Micro-Cap Growth Fund Class A | 77.977 | 2.687 | ||||||
| 2026-02-11 | 13F | Gwn Securities Inc. | 0 | -100,00 | 0 | |||||
| 2026-02-11 | 13F | CenterBook Partners LP | 105.481 | 4.711 | ||||||
| 2026-02-03 | 13F | SBI Securities Co., Ltd. | 517 | -30,23 | 23 | -28,12 | ||||
| 2026-02-13 | 13F | Boston Partners | 223.498 | 38,83 | 9.984 | 40,86 | ||||
| 2026-01-29 | 13F | Huntleigh Advisors, Inc. | 40.166 | 5,42 | 1.794 | 6,92 | ||||
| 2026-02-03 | 13F | Navellier & Associates Inc | 12.010 | -53,22 | 536 | -52,57 | ||||
| 2026-02-05 | 13F | Phoenix Holdings Ltd. | 248.906 | -32,07 | 11.116 | -31,09 | ||||
| 2026-02-17 | 13F | Point72 Asset Management, L.P. | 8.612 | 385 | ||||||
| 2026-02-17 | 13F | Silvercrest Asset Management Group Llc | 139.373 | 6.224 | ||||||
| 2026-01-16 | 13F | Ellsworth Advisors, LLC | 26.489 | -2,04 | 1.366 | 19,63 | ||||
| 2026-02-17 | 13F | Boothbay Fund Management, Llc | 0 | -100,00 | 0 | |||||
| 2025-11-12 | 13F | Stifel Financial Corp | 0 | -100,00 | 0 | -100,00 | ||||
| 2026-02-17 | 13F | Apis Capital Advisors, LLC | 126.496 | 10,00 | 5.649 | 11,57 | ||||
| 2026-02-09 | 13F | Harbour Investments, Inc. | 195 | 0,00 | 9 | 0,00 | ||||
| 2026-02-17 | 13F | Fred Alger Management, Llc | 11.640 | 12,36 | 520 | 13,82 | ||||
| 2026-02-17 | 13F | PDT Partners, LLC | 7.454 | 0,00 | 333 | 1,22 | ||||
| 2026-02-13 | 13F | Wells Fargo & Company/mn | 681 | 9,66 | 30 | 11,11 | ||||
| 2026-02-13 | 13F | Toroso Investments, LLC | 14.070 | 11,76 | 628 | 13,36 | ||||
| 2026-02-13 | 13F | Morgan Stanley | 41.009 | -24,00 | 1.831 | -22,91 | ||||
| 2026-01-21 | 13F | Y.D. More Investments Ltd | 900.147 | -5,32 | 40.385 | 2,39 | ||||
| 2026-02-13 | 13F | Greenline Wealth Management LLC | 912 | 41 | ||||||
| 2026-01-20 | 13F | Signaturefd, Llc | 0 | -100,00 | 0 | |||||
| 2026-02-12 | 13F | Hrt Financial Lp | 5.269 | -30,51 | 0 | |||||
| 2026-01-23 | 13F | Tower View Investment Management & Research LLC | 35.102 | 1.568 | ||||||
| 2025-09-29 | NP | CTSIX - Calamos Timpani Small Cap Growth Fund Class I | 77.089 | 2.657 | ||||||
| 2026-01-29 | 13F | Calamos Advisors LLC | 94.695 | 288,89 | 4.229 | 294,50 | ||||
| 2026-02-17 | 13F | Royal Bank Of Canada | 1.122 | 978,85 | 50 | 900,00 | ||||
| 2026-02-13 | 13F | Formula Growth Ltd | 30.801 | 0,00 | 1.376 | 1,40 | ||||
| 2026-02-19 | 13F/A | Axxcess Wealth Management, Llc | 5.100 | 0,00 | 228 | 1,34 | ||||
| 2026-02-19 | 13F | CI Private Wealth, LLC | 4.750 | 0,00 | 212 | 1,44 | ||||
| 2026-02-02 | 13F | Principal Financial Group Inc | 11.127 | -71,87 | 497 | -71,51 | ||||
| 2026-02-10 | 13F | Goldman Sachs Group Inc | 29.249 | -20,68 | 1.306 | -19,53 | ||||
| 2026-02-12 | 13F | New York State Common Retirement Fund | 230.525 | 0,00 | 10.295 | 1,43 | ||||
| 2026-02-13 | 13F | Citigroup Inc | 25.789 | -19,83 | 1.152 | -18,71 | ||||
| 2026-02-04 | 13F | Colonial River Wealth Management, LLC | 5.100 | 0,00 | 228 | 1,34 | ||||
| 2025-09-26 | NP | RAZAX - Multi-Asset Growth Strategy Fund Class A | 11.864 | 409 | ||||||
| 2025-11-12 | 13F | BlackRock, Inc. | 0 | -100,00 | 0 | -100,00 | ||||
| 2026-01-14 | 13F | Legal Advantage Investments, Inc. | 12.000 | -2,44 | 536 | -1,11 | ||||
| 2026-02-06 | 13F | Gsa Capital Partners Llp | 13.834 | 16,70 | 1 | |||||
| 2026-02-11 | 13F | ARK Investment Management LLC | 50.488 | -19,61 | 2.269 | -11,27 | ||||
| 2026-02-10 | 13F | Quantbot Technologies LP | 1.130 | -58,76 | 50 | -58,33 | ||||
| 2026-02-03 | 13F | K.J. Harrison & Partners Inc | 51.143 | -26,94 | 2.284 | -24,67 | ||||
| 2025-09-26 | NP | REBYX - U.S. Small Cap Equity Fund Class Y | 16.172 | 557 |
Other Listings
| US:TATT | 45,82 $ |