Basisstatistiken
| Institutionelle Aktien (Long) | 449.353 - 0,12% (ex 13D/G) - change of -11,15MM shares -96,13% MRQ |
| Institutioneller Wert (Long) | $ 9.291 USD ($1000) |
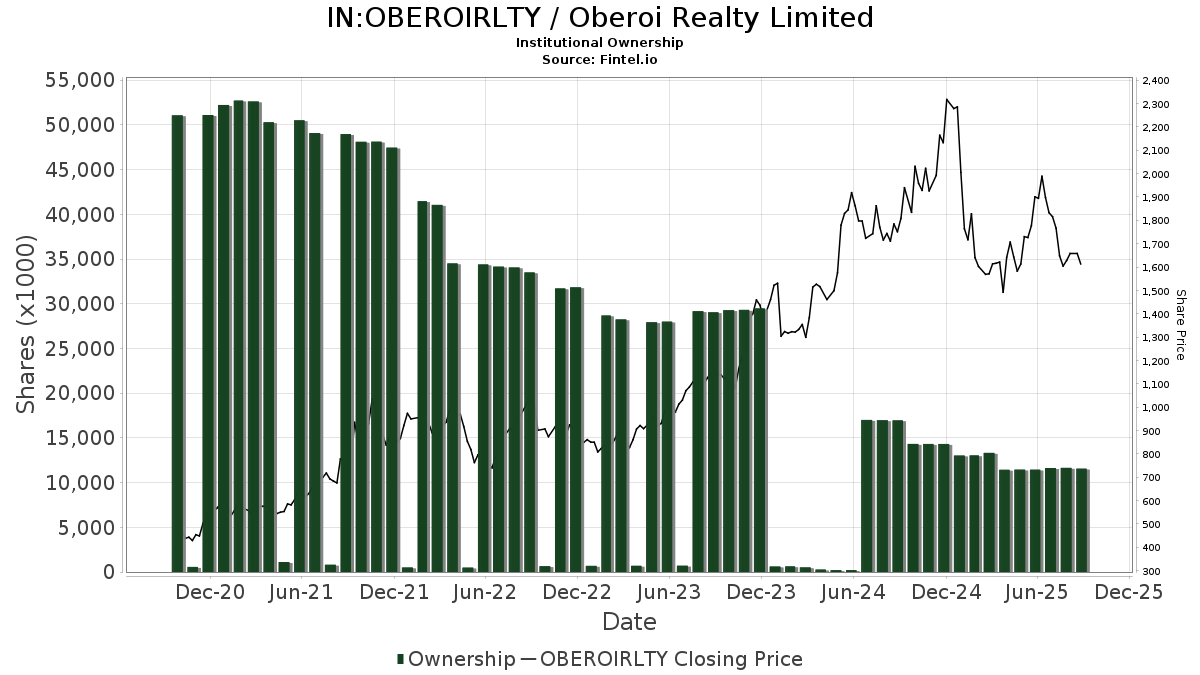
Institutioneller Eigentümerschaft und Aktionäre
Oberoi Realty Limited (IN:OBEROIRLTY) hat 12 institutionelle Eigentümer und Aktionäre, die 13D/G oder 13F Formulare bei der Securities Exchange Commission (SEC) eingereicht haben. Diese Institutionen halten insgesamt 449,353 Aktien. Die größten Aktionäre sind MXENX - Great-West Emerging Markets Equity Fund Institutional Class, TEQKX - TIAA-CREF Emerging Markets Equity Index Fund Retail Class, NGREX - Northern Global Real Estate Index Fund, NUEM - Nuveen ESG Emerging Markets Equity ETF, QCSTRX - Stock Account Class R1, NOEMX - Northern Emerging Markets Equity Index Fund, QCGLRX - Global Equities Account Class R1, PIN - Invesco India ETF, JHEM - John Hancock Multifactor Emerging Markets ETF, and CMIUX - Six Circles Managed Equity Portfolio International Unconstrained Fund .
Oberoi Realty Limited (NSEI:OBEROIRLTY) Die institutionelle Eigentümerstruktur zeigt die aktuellen Positionen von Institutionen und Fonds im Unternehmen sowie die jüngsten Veränderungen der Positionsgröße. Zu den Großaktionären können Einzelanleger, Investmentfonds, Hedgefonds oder Institutionen gehören. Der Schedule 13D zeigt an, dass der Investor mehr als 5% des Unternehmens hält (oder gehalten hat) und beabsichtigt (oder beabsichtigt hat), aktiv eine Änderung der Geschäftsstrategie zu verfolgen. Schedule 13G zeigt eine passive Investition von über 5% an.
The share price as of January 30, 2026 is 1.490,65 / share. Previously, on February 1, 2025, the share price was 1.845,65 / share. This represents a decline of 19,23% over that period.
Fondsstimmung-Score
Der Fondsstimmung-Score (auch bekannt als Eigentümer-Akkumulations-Score) ermittelt die Aktien, die am meisten von Fonds gekauft werden. Er ist das Ergebnis eines ausgeklügelten quantitativen Multifaktormodells, das die Unternehmen mit den höchsten institutionellen Käufen identifiziert. Das Scoring-Modell verwendet eine Kombination aus der Gesamtzunahme der offengelegten Eigentümer, den Änderungen der Portfolioallokationen in diesen Eigentümern und anderen Metriken. Die Zahl reicht von 0 bis 100, wobei höhere Zahlen ein höheres Maß an Kapitalakkumulation als bei anderen Unternehmen anzeigen und 50 den Durchschnitt darstellt.
Aktualisierungshäufigkeit: Täglich
Siehe Ownership Explorer, der eine Liste der am höchsten bewerteten Unternehmen enthält.
AI+ Ask Fintel’s AI assistant about Oberoi Realty Limited.
Select a question to share a public post with an AI-crafted answer.
Thinking of good questions…
13F und NPORT Einreichungen
Details zu 13F-Einreichungen sind kostenlos. Für Details zu NP-Einreichungen ist eine Premium-Mitgliedschaft erforderlich. Grüne Zeilen zeigen neue Positionen an. Rote Zeilen zeigen geschlossene Positionen an. Klicken Sie auf das Link Symbol, um den gesamten Transaktionsverlauf zu sehen.
Upgrade
um Prämiendaten freizuschalten und nach Excel zu exportieren ![]() .
.
Other Listings
| IN:533273 | 1.490,65 ₹ |