Basisstatistiken
| Institutionelle Eigentümer | 106 total, 106 long only, 0 short only, 0 long/short - change of -1,45% MRQ |
| Durchschnittliche Portfolioallokation | 0.1324 % - change of -87,81% MRQ |
| Institutionelle Aktien (Long) | 7.678.285 (ex 13D/G) - change of -0,20MM shares -3,94% MRQ |
| Institutioneller Wert (Long) | $ 468.052 USD ($1000) |
Institutioneller Eigentümerschaft und Aktionäre
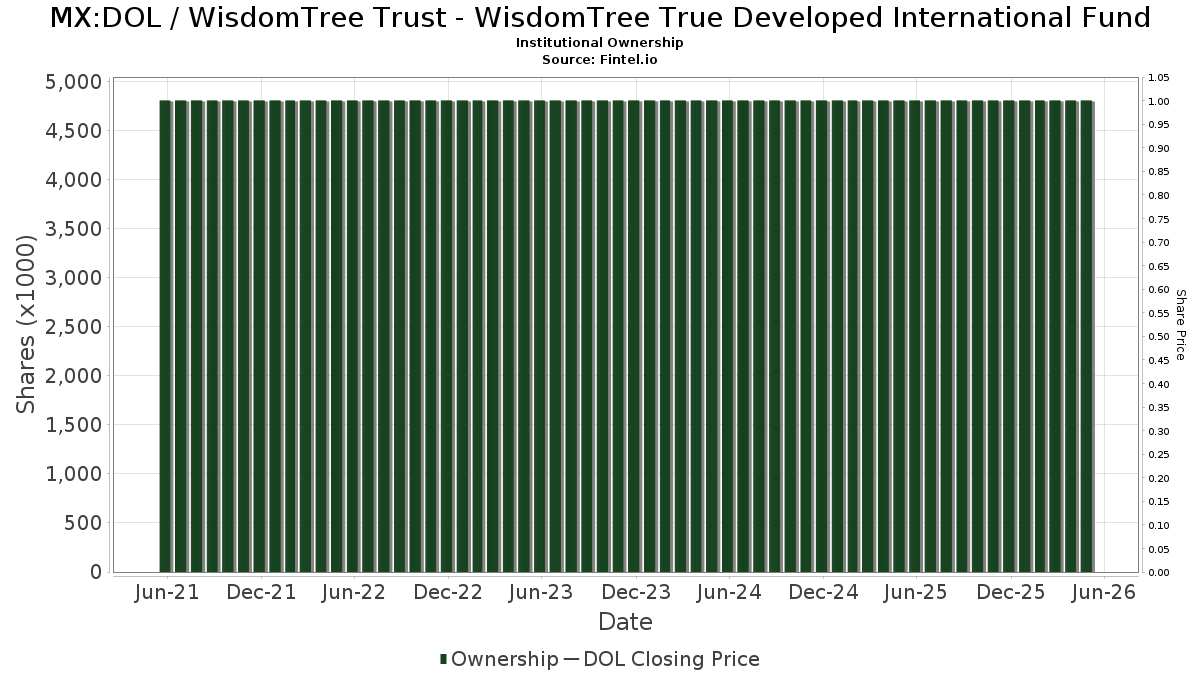
WisdomTree Trust - WisdomTree True Developed International Fund (MX:DOL) hat 106 institutionelle Eigentümer und Aktionäre, die 13D/G oder 13F Formulare bei der Securities Exchange Commission (SEC) eingereicht haben. Diese Institutionen halten insgesamt 7,678,285 Aktien. Die größten Aktionäre sind Creative Planning, Morgan Stanley, Jpmorgan Chase & Co, Royal Bank Of Canada, Key FInancial Inc, BIP Wealth, LLC, Cascade Financial Partners, LLC, LPL Financial LLC, Bank Of America Corp /de/, and M&t Bank Corp .
WisdomTree Trust - WisdomTree True Developed International Fund (BMV:DOL) Die institutionelle Eigentümerstruktur zeigt die aktuellen Positionen von Institutionen und Fonds im Unternehmen sowie die jüngsten Veränderungen der Positionsgröße. Zu den Großaktionären können Einzelanleger, Investmentfonds, Hedgefonds oder Institutionen gehören. Der Schedule 13D zeigt an, dass der Investor mehr als 5% des Unternehmens hält (oder gehalten hat) und beabsichtigt (oder beabsichtigt hat), aktiv eine Änderung der Geschäftsstrategie zu verfolgen. Schedule 13G zeigt eine passive Investition von über 5% an.
Fondsstimmung-Score
Der Fondsstimmung-Score (auch bekannt als Eigentümer-Akkumulations-Score) ermittelt die Aktien, die am meisten von Fonds gekauft werden. Er ist das Ergebnis eines ausgeklügelten quantitativen Multifaktormodells, das die Unternehmen mit den höchsten institutionellen Käufen identifiziert. Das Scoring-Modell verwendet eine Kombination aus der Gesamtzunahme der offengelegten Eigentümer, den Änderungen der Portfolioallokationen in diesen Eigentümern und anderen Metriken. Die Zahl reicht von 0 bis 100, wobei höhere Zahlen ein höheres Maß an Kapitalakkumulation als bei anderen Unternehmen anzeigen und 50 den Durchschnitt darstellt.
Aktualisierungshäufigkeit: Täglich
Siehe Ownership Explorer, der eine Liste der am höchsten bewerteten Unternehmen enthält.
AI+ Ask Fintel’s AI assistant about WisdomTree Trust - WisdomTree True Developed International Fund.
Select a question to share a public post with an AI-crafted answer.
Thinking of good questions…
13F und NPORT Einreichungen
Details zu 13F-Einreichungen sind kostenlos. Für Details zu NP-Einreichungen ist eine Premium-Mitgliedschaft erforderlich. Grüne Zeilen zeigen neue Positionen an. Rote Zeilen zeigen geschlossene Positionen an. Klicken Sie auf das Link Symbol, um den gesamten Transaktionsverlauf zu sehen.
Upgrade
um Prämiendaten freizuschalten und nach Excel zu exportieren ![]() .
.
| Datei Datum | Quelle | Anleger | Typ | Durchschnittlicher Preis (Est) |
Aktien | Δ Aktien (%) |
Gemeldeter Wert ($1000) |
Δ Wert (%) |
Port Alloc (%) |
|
|---|---|---|---|---|---|---|---|---|---|---|
| 2025-11-14 | 13F | Integrated Wealth Concepts LLC | 8.000 | -33,23 | 498 | -30,15 | ||||
| 2025-11-14 | 13F | Warren Averett Asset Management, LLC | 31.177 | -2,64 | 1.941 | 1,73 | ||||
| 2025-11-14 | 13F | CI Private Wealth, LLC | 0 | -100,00 | 0 | |||||
| 2025-11-14 | 13F | Creative Planning | 2.683.179 | 0,34 | 167.040 | 4,87 | ||||
| 2025-11-12 | 13F | Principal Securities, Inc. | 51 | 3 | ||||||
| 2025-11-03 | 13F | Bank of New York Mellon Corp | 7.839 | 488 | ||||||
| 2025-10-30 | 13F | BIP Wealth, LLC | 308.531 | -0,01 | 19.207 | 4,50 | ||||
| 2025-10-21 | 13F | Cascade Financial Partners, LLC | 223.723 | 2,75 | 13.928 | 7,38 | ||||
| 2025-10-15 | 13F | Cwm, Llc | 29.768 | -10,67 | 2 | 0,00 | ||||
| 2025-11-14 | 13F | Northern Trust Corp | 6.716 | 0,00 | 418 | 4,50 | ||||
| 2025-11-06 | 13F | Stratos Wealth Partners, LTD. | 5.367 | 6,45 | 334 | 11,33 | ||||
| 2025-11-12 | 13F | Evernest Financial Advisors, LLC | 93.268 | -0,00 | 5.806 | 4,52 | ||||
| 2025-11-10 | 13F | Jfs Wealth Advisors, Llc | 22.647 | 317,76 | 1.410 | 337,58 | ||||
| 2025-11-10 | 13F | Advyzon Investment Management, LLC | 4.515 | -0,97 | 281 | 3,69 | ||||
| 2025-10-28 | 13F | JNBA Financial Advisors | 4.806 | 0,00 | 299 | 4,55 | ||||
| 2025-11-10 | 13F | Hartland & Co., LLC | 4.243 | 0,00 | 264 | 4,76 | ||||
| 2025-10-20 | 13F | Stonebridge Financial Group, LLC | 9.325 | 0,00 | 581 | 4,50 | ||||
| 2025-11-05 | 13F | Howe & Rusling Inc | 15.102 | 12,02 | 940 | 17,06 | ||||
| 2025-10-27 | 13F | PBMares Wealth Management LLC | 6.301 | 0,29 | 392 | 4,81 | ||||
| 2025-11-05 | 13F | Key FInancial Inc | 321.756 | 0,21 | 20.203 | 5,64 | ||||
| 2025-10-14 | 13F | Farther Finance Advisors, LLC | 2.114 | -4,04 | 132 | 0,00 | ||||
| 2025-10-17 | 13F | Institute for Wealth Management, LLC. | 11.377 | -2,37 | 708 | 2,02 | ||||
| 2025-11-12 | 13F | Harbour Investments, Inc. | 166 | 10 | ||||||
| 2025-11-14 | 13F | Vance Wealth, Inc. | 6.150 | 0,00 | 383 | 4,37 | ||||
| 2025-12-02 | 13F | IFP Advisors, Inc | 2.263 | -8,97 | 141 | -5,41 | ||||
| 2025-10-21 | 13F | Signaturefd, Llc | 425 | 0,00 | 26 | 4,00 | ||||
| 2025-10-30 | 13F | Avidian Wealth Solutions, LLC | 121.058 | -0,32 | 7.536 | 4,17 | ||||
| 2025-11-07 | 13F | Founders Financial Alliance, LLC | 265 | 11,81 | 16 | 14,29 | ||||
| 2025-07-25 | 13F | NorthRock Partners, LLC | 600 | -36,17 | 36 | -31,37 | ||||
| 2025-11-13 | 13F | UBS Group AG | 60.830 | 15,69 | 3.787 | 20,88 | ||||
| 2025-11-14 | 13F | Cardiff Park Advisors, Llc | 2.406 | 0,42 | 150 | 4,93 | ||||
| 2025-10-22 | 13F | Cerity Partners LLC | 4.628 | -4,70 | 288 | -0,35 | ||||
| 2025-11-13 | 13F | Private Advisor Group, LLC | 16.298 | 6,59 | 1.015 | 11,43 | ||||
| 2025-11-04 | 13F | Tsfg, Llc | 88 | 0,00 | 0 | |||||
| 2025-11-05 | 13F | Altrius Capital Management Inc | 6.297 | -63,77 | 392 | -62,13 | ||||
| 2025-11-14 | 13F | Mariner, LLC | 36.082 | -6,34 | 2.246 | -2,09 | ||||
| 2025-11-14 | 13F | Bank Of America Corp /de/ | 203.780 | 8,87 | 12.686 | 13,79 | ||||
| 2025-10-22 | 13F | CoreCap Advisors, LLC | 10.396 | 0,30 | 647 | 4,86 | ||||
| 2025-10-30 | 13F | Chicago Partners Investment Group LLC | 3.757 | 0,03 | 239 | 3,48 | ||||
| 2025-11-03 | 13F | LRI Investments, LLC | 2.085 | 0,00 | 130 | 4,03 | ||||
| 2025-10-15 | 13F | Private Trust Co Na | 0 | -100,00 | 0 | |||||
| 2025-11-14 | 13F | Cetera Investment Advisers | 99.477 | -7,27 | 6.193 | -3,10 | ||||
| 2025-11-06 | 13F | Assetmark, Inc | 1.600 | 0,00 | 100 | 4,21 | ||||
| 2025-11-12 | 13F | Stifel Financial Corp | 8.572 | -0,22 | 534 | 4,31 | ||||
| 2025-10-21 | 13F | Discipline Wealth Solutions, LLC | 5.246 | 327 | ||||||
| 2025-11-05 | 13F | Envestnet Asset Management Inc | 29.091 | -6,17 | 1.811 | -1,90 | ||||
| 2025-10-16 | 13F | Ronald Blue Trust, Inc. | 1.377 | 0,00 | 86 | 3,66 | ||||
| 2025-11-04 | 13F | Bridges Investment Management Inc | 17.112 | 1.065 | ||||||
| 2025-10-20 | 13F | Meridian Financial Partners LLC | 7.645 | -0,53 | 480 | |||||
| 2025-11-12 | 13F | Level Four Advisory Services, Llc | 4.488 | 0,00 | 279 | 4,49 | ||||
| 2025-11-13 | 13F | Fmr Llc | 2.193 | 36,89 | 137 | 43,16 | ||||
| 2025-08-12 | 13F | Proequities, Inc. | 0 | 0 | ||||||
| 2025-11-14 | 13F | Ancora Advisors, LLC | 720 | 0,00 | 45 | 4,76 | ||||
| 2025-10-21 | 13F | SOA Wealth Advisors, LLC. | 1.861 | -9,13 | 116 | -4,96 | ||||
| 2025-11-14 | 13F | Comerica Bank | 8.421 | -0,15 | 524 | 4,38 | ||||
| 2025-08-29 | NP | DTH - WisdomTree International High Dividend Fund N/A | 734 | 73.300,00 | 44 | |||||
| 2025-10-27 | 13F | Janney Montgomery Scott LLC | 3.303 | 0 | ||||||
| 2025-10-10 | 13F | Newton One Investments LLC | 1.853 | -4,83 | 115 | 0,00 | ||||
| 2025-11-12 | 13F | IFG Advisory, LLC | 6.978 | 0,00 | 434 | 4,58 | ||||
| 2025-11-14 | 13F | Colony Group, LLC | 8.374 | 2,65 | 521 | 7,42 | ||||
| 2025-11-06 | 13F | Western Wealth Management, LLC | 14.096 | 878 | ||||||
| 2025-11-04 | 13F | Jones Financial Companies Lllp | 7.731 | 34,64 | 478 | 39,88 | ||||
| 2025-11-12 | 13F | Huntington National Bank | 51.776 | 7,15 | ||||||
| 2025-11-13 | 13F | Wells Fargo & Company/mn | 54.703 | 65,75 | 3.406 | 73,28 | ||||
| 2025-11-14 | 13F | Northwestern Mutual Wealth Management Co | 121.415 | 0,79 | 7.559 | 5,34 | ||||
| 2025-10-22 | 13F | Geneos Wealth Management Inc. | 7.537 | 3,60 | 469 | 8,31 | ||||
| 2025-10-22 | 13F | Gladstone Institutional Advisory LLC | 42.448 | -1,53 | 2.643 | 2,92 | ||||
| 2025-11-10 | 13F | First Heartland Consultants, Inc. | 91.840 | 48,15 | 5.717 | 54,85 | ||||
| 2025-11-26 | 13F/A | Jpmorgan Chase & Co | 368.590 | 1,14 | 22.946 | 5,70 | ||||
| 2025-10-09 | 13F | AdvisorNet Financial, Inc | 77 | 0,00 | 5 | 0,00 | ||||
| 2025-11-12 | 13F | Buckingham Strategic Partners | 0 | -100,00 | 0 | |||||
| 2025-10-22 | 13F | Commonwealth Equity Services, Llc | 120.013 | -0,95 | 7 | 0,00 | ||||
| 2025-11-14 | 13F | Advisor Group Holdings, Inc. | 87.547 | 160,44 | 5.429 | 171,13 | ||||
| 2025-11-14 | 13F | Mml Investors Services, Llc | 70.253 | 6,36 | 4.374 | 145.666,67 | ||||
| 2025-11-03 | 13F | Golden State Wealth Management, LLC | 21 | 0,00 | 1 | 0,00 | ||||
| 2025-11-14 | 13F | Raymond James Financial Inc | 28.131 | 19,61 | 1.751 | 25,07 | ||||
| 2025-11-17 | 13F | GWM Advisors LLC | 417 | 0,00 | 26 | 4,17 | ||||
| 2025-11-12 | 13F | LPL Financial LLC | 218.436 | 9,27 | 13.599 | 14,19 | ||||
| 2025-08-08 | 13F | Gts Securities Llc | 0 | -100,00 | 0 | |||||
| 2025-11-14 | 13F | Jane Street Group, Llc | 50.432 | -48,33 | 3.140 | -46,00 | ||||
| 2025-11-14 | 13F | Ameriprise Financial Inc | 7.588 | 25,84 | 472 | 33,71 | ||||
| 2025-11-13 | 13F | Wealth Watch Advisors, INC | 414 | 26 | ||||||
| 2025-10-21 | 13F | Global Retirement Partners, LLC | 304 | 0,00 | 19 | 0,00 | ||||
| 2025-11-12 | 13F | Blair William & Co/il | 179 | 0,00 | 11 | 10,00 | ||||
| 2025-11-07 | 13F | Fifth Third Bancorp | 3.407 | 50,95 | 212 | 58,21 | ||||
| 2025-10-21 | 13F | Hubbell Strickland Wealth Management, LLC | 4.017 | 0,42 | 250 | 5,04 | ||||
| 2025-11-07 | 13F | Pnc Financial Services Group, Inc. | 690 | 0,00 | 43 | 2,44 | ||||
| 2025-11-17 | 13F | FSA Wealth Management LLC | 400 | 0,00 | 25 | 4,35 | ||||
| 2025-11-14 | 13F | Royal Bank Of Canada | 331.243 | 0,29 | 20.620 | 4,80 | ||||
| 2025-11-12 | 13F | United Advisor Group, LLC | 4.210 | 262 | ||||||
| 2025-11-14 | 13F | Rockefeller Capital Management L.P. | 43.705 | -1,25 | 2.721 | 3,19 | ||||
| 2025-11-06 | 13F | Ameritas Advisory Services, LLC | 631 | 39 | ||||||
| 2025-11-14 | 13F | Goldman Sachs Group Inc | 19.923 | 1.240 | ||||||
| 2025-11-12 | 13F | Cambridge Investment Research Advisors, Inc. | 6.347 | -71,23 | 0 | -100,00 | ||||
| 2025-10-29 | 13F | Wealth Enhancement Advisory Services, Llc | 10.835 | 78,09 | 678 | 86,78 | ||||
| 2025-08-13 | 13F | Congress Wealth Management LLC / DE / | 52.434 | -3,58 | 3.123 | 4,31 | ||||
| 2025-11-13 | 13F | Quadrant Capital Group Llc | 950 | 59 | ||||||
| 2025-11-13 | 13F | Herold Advisors, Inc. | 4.181 | 8,37 | 260 | 13,54 | ||||
| 2025-11-12 | 13F | Creekmur Asset Management LLC | 684 | -25,00 | 43 | -22,22 | ||||
| 2025-11-24 | 13F | Cherry Tree Wealth Management, LLC | 714 | 0,00 | 44 | 4,76 | ||||
| 2025-11-07 | 13F | HighTower Advisors, LLC | 8.357 | -9,05 | 520 | -4,94 | ||||
| 2025-11-14 | 13F | Morgan Stanley | 990.022 | 13,59 | 61.633 | 18,72 | ||||
| 2025-11-14 | 13F | M&t Bank Corp | 158.977 | 0,19 | 9.897 | 4,71 | ||||
| 2025-11-05 | 13F | MCF Advisors LLC | 5.885 | 0,00 | 366 | 4,57 | ||||
| 2025-11-10 | 13F | Citigroup Inc | 546 | 0,00 | 34 | 3,13 | ||||
| 2025-10-14 | 13F | Evanson Asset Management, LLC | 11.609 | 0,11 | 723 | 4,64 | ||||
| 2025-11-14 | 13F | Kestra Advisory Services, LLC | 87.098 | 64,16 | 5.422 | 71,58 | ||||
| 2025-11-12 | 13F | Steward Partners Investment Advisory, Llc | 2 | 0,00 | 0 | |||||
| 2025-11-14 | 13F | Flow Traders U.s. Llc | 0 | -100,00 | 0 | |||||
| 2025-10-22 | 13F | Powers Advisory Group, LLC | 83.985 | -0,23 | 5.228 | 4,27 | ||||
| 2025-11-06 | 13F | Atria Investments Llc | 61.277 | 2,15 | 3.815 | 6,75 | ||||
| 2025-10-31 | 13F | Frazier Financial Advisors, LLC | 4.230 | 0,00 | 263 | 4,78 | ||||
| 2025-10-29 | 13F | Courier Capital Llc | 3.330 | 207 |
Other Listings
| US:DOL | 64,88 $ |