Basisstatistiken
| Institutionelle Eigentümer | 114 total, 114 long only, 0 short only, 0 long/short - change of -5,36% MRQ |
| Durchschnittliche Portfolioallokation | 0.0403 % - change of -7,18% MRQ |
| Institutionelle Aktien (Long) | 19.655.524 (ex 13D/G) - change of -0,57MM shares -8,54% MRQ |
| Institutioneller Wert (Long) | $ 293.934 USD ($1000) |
Institutioneller Eigentümerschaft und Aktionäre
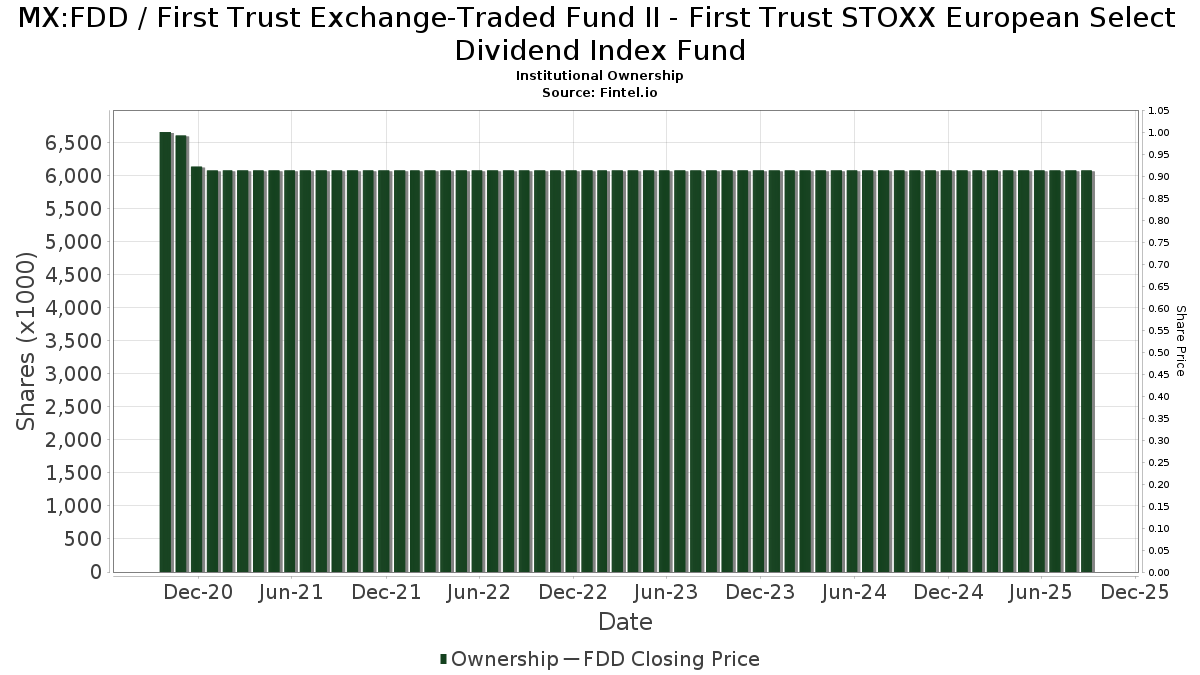
First Trust Exchange-Traded Fund II - First Trust STOXX European Select Dividend Index Fund (MX:FDD) hat 114 institutionelle Eigentümer und Aktionäre, die 13D/G oder 13F Formulare bei der Securities Exchange Commission (SEC) eingereicht haben. Diese Institutionen halten insgesamt 19,655,524 Aktien. Die größten Aktionäre sind Morgan Stanley, Wells Fargo & Company/mn, Raymond James Financial Inc, Manchester Financial Inc, UBS Group AG, LPL Financial LLC, ODonnell Financial Services, LLC, Ameriprise Financial Inc, Intellectus Partners, LLC, and Advisor Group Holdings, Inc. .
First Trust Exchange-Traded Fund II - First Trust STOXX European Select Dividend Index Fund (BMV:FDD) Die institutionelle Eigentümerstruktur zeigt die aktuellen Positionen von Institutionen und Fonds im Unternehmen sowie die jüngsten Veränderungen der Positionsgröße. Zu den Großaktionären können Einzelanleger, Investmentfonds, Hedgefonds oder Institutionen gehören. Der Schedule 13D zeigt an, dass der Investor mehr als 5% des Unternehmens hält (oder gehalten hat) und beabsichtigt (oder beabsichtigt hat), aktiv eine Änderung der Geschäftsstrategie zu verfolgen. Schedule 13G zeigt eine passive Investition von über 5% an.
Fondsstimmung-Score
Der Fondsstimmung-Score (auch bekannt als Eigentümer-Akkumulations-Score) ermittelt die Aktien, die am meisten von Fonds gekauft werden. Er ist das Ergebnis eines ausgeklügelten quantitativen Multifaktormodells, das die Unternehmen mit den höchsten institutionellen Käufen identifiziert. Das Scoring-Modell verwendet eine Kombination aus der Gesamtzunahme der offengelegten Eigentümer, den Änderungen der Portfolioallokationen in diesen Eigentümern und anderen Metriken. Die Zahl reicht von 0 bis 100, wobei höhere Zahlen ein höheres Maß an Kapitalakkumulation als bei anderen Unternehmen anzeigen und 50 den Durchschnitt darstellt.
Aktualisierungshäufigkeit: Täglich
Siehe Ownership Explorer, der eine Liste der am höchsten bewerteten Unternehmen enthält.
AI+ Ask Fintel’s AI assistant about First Trust Exchange-Traded Fund II - First Trust STOXX European Select Dividend Index Fund.
Thinking of good questions…
13F und NPORT Einreichungen
Details zu 13F-Einreichungen sind kostenlos. Für Details zu NP-Einreichungen ist eine Premium-Mitgliedschaft erforderlich. Grüne Zeilen zeigen neue Positionen an. Rote Zeilen zeigen geschlossene Positionen an. Klicken Sie auf das Link Symbol, um den gesamten Transaktionsverlauf zu sehen.
Upgrade
um Prämiendaten freizuschalten und nach Excel zu exportieren ![]() .
.
| Datei Datum | Quelle | Anleger | Typ | Durchschnittlicher Preis (Est) |
Aktien | Δ Aktien (%) |
Gemeldeter Wert ($1000) |
Δ Wert (%) |
Port Alloc (%) |
|
|---|---|---|---|---|---|---|---|---|---|---|
| 2025-08-06 | 13F | Wedbush Securities Inc | 25.055 | 0,00 | 0 | |||||
| 2025-08-14 | 13F | Raymond James Financial Inc | 1.491.557 | 609,22 | 23.179 | 712,41 | ||||
| 2025-08-14 | 13F | Susquehanna International Group, Llp | 29.323 | 456 | ||||||
| 2025-07-08 | 13F | Nbc Securities, Inc. | 2.192 | 0,00 | 0 | |||||
| 2025-08-06 | 13F | Commonwealth Equity Services, Llc | 100.802 | -29,70 | 2 | 0,00 | ||||
| 2025-07-17 | 13F | Forefront Wealth Management Inc. | 157.967 | 2.455 | ||||||
| 2025-10-02 | 13F | GAMMA Investing LLC | 2.775 | 0,00 | 45 | 2,33 | ||||
| 2025-08-14 | 13F | Treasure Coast Financial Planning | 13.493 | 7,75 | 210 | 23,67 | ||||
| 2025-08-05 | 13F | Ciovacco Capital Management LLC | 34.994 | 544 | ||||||
| 2025-09-29 | NP | SMILX - SMI 50/40/10 Fund | 114.510 | 0,00 | 1.754 | 6,95 | ||||
| 2025-08-27 | 13F/A | Brinker Capital Investments, LLC | 32.600 | -30,87 | 507 | -20,81 | ||||
| 2025-07-31 | 13F | Topsail Wealth Management, LLC | 14.060 | 218 | ||||||
| 2025-08-14 | 13F | Wells Fargo & Company/mn | 2.494.548 | 474,53 | 38.765 | 558,04 | ||||
| 2025-07-17 | 13F | Sound Income Strategies, LLC | 87 | 1 | ||||||
| 2025-08-04 | 13F | Spire Wealth Management | 0 | -100,00 | 0 | |||||
| 2025-08-12 | 13F | Proequities, Inc. | 0 | 0 | ||||||
| 2025-08-08 | 13F | Cetera Investment Advisers | 57.259 | 178,40 | 890 | 218,64 | ||||
| 2025-08-13 | 13F | Flow Traders U.s. Llc | 32.694 | 1 | ||||||
| 2025-08-14 | 13F | Goldman Sachs Group Inc | 16.304 | 253 | ||||||
| 2025-07-25 | 13F | Envestnet Portfolio Solutions, Inc. | 47.936 | -7,26 | 745 | 6,13 | ||||
| 2025-08-04 | 13F | Integrity Alliance, Llc. | 29.086 | 452 | ||||||
| 2025-08-06 | 13F | Strategic Financial Partners, Ltd. | 14.910 | 0,17 | 232 | 14,93 | ||||
| 2025-08-11 | 13F | Principal Securities, Inc. | 14.086 | -25,14 | 219 | 3,32 | ||||
| 2025-10-06 | 13F | SMI Advisory Services, LLC | 0 | -100,00 | 0 | |||||
| 2025-08-18 | 13F | Geneos Wealth Management Inc. | 750 | -48,28 | 12 | -42,11 | ||||
| 2025-10-06 | 13F | Wisconsin Wealth Advisors, LLC | 53.106 | 0,73 | 858 | 4,64 | ||||
| 2025-05-15 | 13F/A | Orion Portfolio Solutions, LLC | 47.160 | -3,89 | 640 | 15,76 | ||||
| 2025-05-12 | 13F | Virtu Financial LLC | 0 | -100,00 | 0 | |||||
| 2025-07-24 | 13F | Blair William & Co/il | 3.000 | 47 | ||||||
| 2025-07-29 | 13F | International Assets Investment Management, Llc | 44.010 | 684 | ||||||
| 2025-08-14 | 13F/A | Rockefeller Capital Management L.P. | 114.170 | 26,49 | 1.774 | 44,93 | ||||
| 2025-08-06 | 13F | Prospera Financial Services Inc | 156.115 | 2.426 | ||||||
| 2025-07-18 | 13F | Truist Financial Corp | 120.316 | 620,15 | 1.870 | 726,99 | ||||
| 2025-09-29 | NP | SMIFX - Sound Mind Investing Fund | 532.350 | 24,49 | 8.156 | 33,10 | ||||
| 2025-07-17 | 13F | Janney Montgomery Scott LLC | 380.881 | 93,91 | 6 | 150,00 | ||||
| 2025-08-06 | 13F | Moors & Cabot, Inc. | 22.366 | 348 | ||||||
| 2025-08-14 | 13F | Susquehanna International Group, Llp | Call | 0 | -100,00 | 0 | ||||
| 2025-08-14 | 13F | Benjamin Edwards Inc | 20.521 | -11,76 | 319 | 0,95 | ||||
| 2025-08-08 | 13F | SBI Securities Co., Ltd. | 6.438 | 137,04 | 100 | 177,78 | ||||
| 2025-08-01 | 13F | Rossby Financial, LCC | 401 | 0,00 | 6 | 20,00 | ||||
| 2025-07-29 | 13F | Balboa Wealth Partners | 32.459 | 171,35 | 504 | 211,11 | ||||
| 2025-08-12 | 13F | Change Path, LLC | 20.361 | -23,72 | 316 | -12,71 | ||||
| 2025-08-13 | 13F | Continuum Advisory, LLC | 0 | -100,00 | 0 | |||||
| 2025-08-13 | 13F | BlackDiamond Wealth Management Inc. | 10.952 | -1,32 | 170 | 4,94 | ||||
| 2025-07-24 | 13F | IFP Advisors, Inc | 342.112 | 14.748,61 | 5.316 | 17.048,39 | ||||
| 2025-09-04 | 13F/A | Advisor Group Holdings, Inc. | 569.857 | 6.008,45 | 8.855 | 6.927,78 | ||||
| 2025-07-11 | 13F | Pinnacle Bancorp, Inc. | 104 | 0,00 | 2 | 0,00 | ||||
| 2025-07-16 | 13F | Owen LaRue, LLC | 151.421 | -61,65 | 2.353 | -56,08 | ||||
| 2025-08-04 | 13F | Atria Investments Llc | 414.962 | 3.906,97 | 6.449 | 4.505,71 | ||||
| 2025-08-13 | 13F | Jones Financial Companies Lllp | 71.719 | 940,46 | 1.110 | 1.080,85 | ||||
| 2025-07-21 | 13F | J2 Capital Management Inc | 41.716 | 648 | ||||||
| 2025-08-14 | 13F | UBS Group AG | 1.154.637 | 81,04 | 17.943 | 107,34 | ||||
| 2025-08-12 | 13F | LPL Financial LLC | 749.713 | 58,93 | 11.651 | 82,00 | ||||
| 2025-07-28 | 13F | BRYN MAWR TRUST Co | 4.300 | 67 | ||||||
| 2025-07-30 | 13F | BlueChip Wealth Advisors LLC | 63.436 | -5,08 | 986 | 8,72 | ||||
| 2025-08-18 | 13F/A | National Bank Of Canada /fi/ | 1.200 | 71,43 | 19 | 100,00 | ||||
| 2025-07-28 | 13F | Harbour Investments, Inc. | 155.443 | -4,72 | 2.416 | 9,13 | ||||
| 2025-07-08 | 13F | Next Level Private LLC | 163.272 | 0,71 | 2.537 | 15,32 | ||||
| 2025-08-07 | 13F | Kestra Private Wealth Services, Llc | 75.227 | -2,28 | 1.169 | 11,97 | ||||
| 2025-08-14 | 13F | Comerica Bank | 46.757 | -6,70 | 727 | 6,76 | ||||
| 2025-10-01 | 13F | Hobart Private Capital, LLC | 168.048 | 8,65 | 2.714 | 12,90 | ||||
| 2025-07-29 | 13F | Stephens Inc /ar/ | 35.758 | -0,56 | 556 | 13,96 | ||||
| 2025-08-13 | 13F | Twin Peaks Wealth Advisors, LLC | 4.216 | 68 | ||||||
| 2025-08-14 | 13F | Integrated Wealth Concepts LLC | 94.796 | 4,38 | 1.473 | 19,56 | ||||
| 2025-05-15 | 13F | Hrt Financial Lp | 0 | -100,00 | 0 | |||||
| 2025-08-14 | 13F | Mml Investors Services, Llc | 109.515 | 886,62 | 2 | |||||
| 2025-08-05 | 13F | Intellectus Partners, LLC | 632.650 | 2,76 | 9.831 | 17,68 | ||||
| 2025-08-15 | 13F | Fsb Premier Wealth Management, Inc. | 11.116 | 0,22 | 173 | 14,67 | ||||
| 2025-08-13 | 13F | Gateway Wealth Partners, LLC | 28.588 | 29,94 | 444 | 48,99 | ||||
| 2025-07-31 | 13F | Oppenheimer & Co Inc | 10.000 | 155 | ||||||
| 2025-08-15 | 13F | Kestra Advisory Services, LLC | 57.099 | 167,89 | 887 | 206,92 | ||||
| 2025-07-23 | 13F | Tcfg Wealth Management, Llc | 103.350 | -0,42 | 1.606 | 14,06 | ||||
| 2025-08-01 | 13F | Envestnet Asset Management Inc | 255.278 | 57,84 | 3.967 | 80,81 | ||||
| 2025-07-16 | 13F | ORG Partners LLC | 28.500 | 466 | ||||||
| 2025-08-08 | 13F | Pnc Financial Services Group, Inc. | 3.793 | -15,20 | 59 | -3,33 | ||||
| 2025-07-22 | 13F | Belpointe Asset Management LLC | 22.905 | 356 | ||||||
| 2025-08-14 | 13F | Colony Group, LLC | 39.343 | -12,56 | 611 | 0,16 | ||||
| 2025-08-14 | 13F | Ameriprise Financial Inc | 650.174 | 53,73 | 10.081 | 75,66 | ||||
| 2025-08-14 | 13F | Harwood Advisory Group, LLC | 2.157 | -5,48 | 34 | 32,00 | ||||
| 2025-08-19 | 13F | Advisory Services Network, LLC | 15.493 | 237 | ||||||
| 2025-07-09 | 13F | Murphy, Middleton, Hinkle & Parker, Inc. | 107.446 | 0,00 | 1.458 | 0,00 | ||||
| 2025-08-15 | 13F | Tower Research Capital LLC (TRC) | 0 | -100,00 | 0 | |||||
| 2025-07-11 | 13F | Farther Finance Advisors, LLC | 1.792 | 3,76 | 28 | 17,39 | ||||
| 2025-08-13 | 13F | Baird Financial Group, Inc. | 20.153 | 56,80 | 313 | 79,89 | ||||
| 2025-08-05 | 13F | Prosperity Wealth Management, Inc. | 14.600 | 227 | ||||||
| 2025-08-12 | 13F | Steward Partners Investment Advisory, Llc | 164.659 | 3.531,65 | 2.559 | 4.093,44 | ||||
| 2025-08-14 | 13F | GWM Advisors LLC | 14.105 | 219 | ||||||
| 2025-08-19 | 13F | Newbridge Financial Services Group, Inc. | 13.879 | 216 | ||||||
| 2025-07-16 | 13F | Register Financial Advisors LLC | 12.719 | 198 | ||||||
| 2025-08-08 | 13F | MTM Investment Management, LLC | 1.500 | 23 | ||||||
| 2025-08-14 | 13F | Fmr Llc | 5.716 | 89 | ||||||
| 2025-07-29 | 13F | ODonnell Financial Services, LLC | 747.517 | 11.616 | ||||||
| 2025-08-14 | 13F | Royal Bank Of Canada | 110.349 | 333,95 | 1.715 | 395,66 | ||||
| 2025-05-15 | 13F | Citadel Advisors Llc | Put | 0 | -100,00 | 0 | -100,00 | |||
| 2025-08-14 | 13F | Atomi Financial Group, Inc. | 13.879 | 216 | ||||||
| 2025-05-08 | 13F | Armis Advisers, LLC | 0 | -100,00 | 0 | |||||
| 2025-07-11 | 13F | SILVER OAK SECURITIES, Inc | 20.056 | 25,37 | 312 | 42,66 | ||||
| 2025-08-07 | 13F | Private Advisory Group LLC | 92.110 | 1.431 | ||||||
| 2025-07-21 | 13F | Ameritas Advisory Services, LLC | 209 | 3 | ||||||
| 2025-07-17 | 13F | Raleigh Capital Management Inc. | 783 | 1,42 | 12 | 20,00 | ||||
| 2025-08-14 | 13F | Jane Street Group, Llc | 400.000 | 161,23 | 6.216 | 199,28 | ||||
| 2025-08-14 | 13F | Bank Of America Corp /de/ | 273.362 | -16,36 | 4.248 | -4,22 | ||||
| 2025-08-12 | 13F | Global Retirement Partners, LLC | 5.843 | 1.603,50 | 91 | 2.900,00 | ||||
| 2025-07-23 | 13F | Foresight Capital Management Advisors, Inc. | 195.185 | 3.033 | ||||||
| 2025-07-31 | 13F | Cambridge Investment Research Advisors, Inc. | 60.260 | 10,88 | 1 | |||||
| 2025-07-10 | 13F | Wealth Enhancement Advisory Services, Llc | 24.946 | 389 | ||||||
| 2025-07-29 | 13F | Manchester Financial Inc | 1.382.182 | 21.479 | ||||||
| 2025-07-29 | 13F | Cottonwood Capital Advisors, Llc | 33.170 | -0,18 | 515 | 14,44 | ||||
| 2025-08-14 | 13F | Citadel Advisors Llc | Call | 0 | -100,00 | 0 | ||||
| 2025-04-30 | 13F | Allworth Financial LP | 0 | -100,00 | 0 | |||||
| 2025-08-01 | 13F | Liberty Wealth Management Llc | 14.770 | 1,29 | 230 | 16,24 | ||||
| 2025-08-12 | 13F | Jaffetilchin Investment Partners, LLC | 0 | -100,00 | 0 | |||||
| 2025-07-22 | 13F | Berger Financial Group, Inc | 16.543 | 4,21 | 257 | 19,53 | ||||
| 2025-08-12 | 13F | Jpmorgan Chase & Co | 1.772 | 28 | ||||||
| 2025-08-14 | 13F | Snowden Capital Advisors LLC | 30.012 | 52,64 | 466 | 75,19 | ||||
| 2025-08-14 | 13F | Citadel Advisors Llc | 50.089 | 109,35 | 778 | 140,12 | ||||
| 2025-08-15 | 13F | Morgan Stanley | 2.689.945 | 28,45 | 41.802 | 47,10 | ||||
| 2025-08-04 | 13F | Flagship Harbor Advisors, Llc | 198.437 | 3.084 | ||||||
| 2025-07-17 | 13F | Lee Johnson Capital Management, Llc | 22.640 | 352 | ||||||
| 2025-07-25 | 13F | Concurrent Investment Advisors, LLC | 28.514 | 97,62 | 443 | 127,18 | ||||
| 2025-08-15 | 13F | Equitable Holdings, Inc. | 181.155 | 47,82 | 2.815 | 69,27 | ||||
| 2025-08-05 | 13F | Sigma Planning Corp | 17.416 | 2,65 | 271 | 17,39 | ||||
| 2025-08-14 | 13F | Stifel Financial Corp | 40.752 | 27,75 | 633 | 46,53 | ||||
| 2025-08-12 | 13F | MAI Capital Management | 120 | 0,00 | 2 | 0,00 | ||||
| 2025-07-15 | 13F | Elevated Capital Advisors, LLC | 49.419 | 0,00 | 671 | 0,00 | ||||
| 2025-07-23 | 13F | Bellevue Asset Management, Llc | 1.202 | 0,59 | 19 | 12,50 | ||||
| 2025-08-20 | 13F/A | Coppell Advisory Solutions LLC | 26.069 | 96,29 | 404 | 110,42 |
Other Listings
| US:FDD | 15,91 $ |