Basisstatistiken
| Institutionelle Eigentümer | 25 total, 25 long only, 0 short only, 0 long/short - change of 11,11% MRQ |
| Durchschnittliche Portfolioallokation | 1.0999 % - change of -2,33% MRQ |
| Institutionelle Aktien (Long) | 2.432.595 (ex 13D/G) - change of -0,48MM shares -3,74% MRQ |
| Institutioneller Wert (Long) | $ 76.528 USD ($1000) |
Institutioneller Eigentümerschaft und Aktionäre
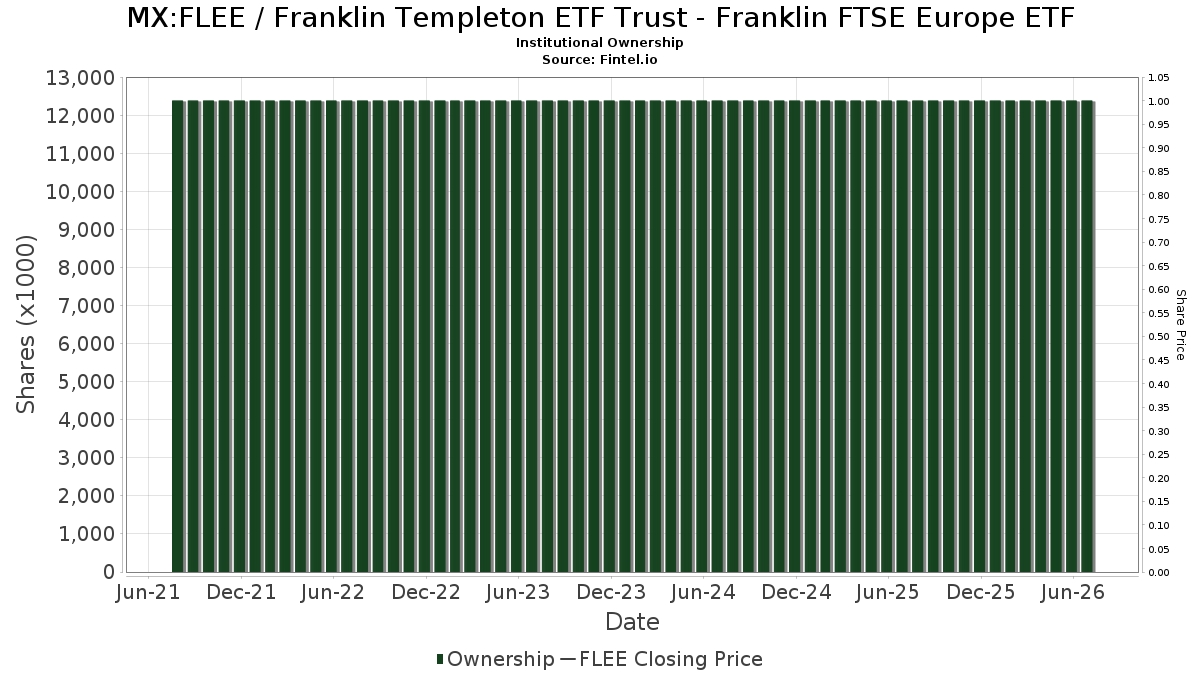
Franklin Templeton ETF Trust - Franklin FTSE Europe ETF (MX:FLEE) hat 25 institutionelle Eigentümer und Aktionäre, die 13D/G oder 13F Formulare bei der Securities Exchange Commission (SEC) eingereicht haben. Diese Institutionen halten insgesamt 2,432,595 Aktien. Die größten Aktionäre sind EP Wealth Advisors, Inc., RAA - SMI 3Fourteen Real Asset Allocation ETF SMI 3Fourteen REAL Asset Allocation ETF, Treasure Coast Financial Planning, Flow Traders U.s. Llc, Royal Bank Of Canada, Franklin Resources Inc, Toroso Investments, LLC, Gts Securities Llc, Advisor Group Holdings, Inc., and EverSource Wealth Advisors, LLC .
Franklin Templeton ETF Trust - Franklin FTSE Europe ETF (BMV:FLEE) Die institutionelle Eigentümerstruktur zeigt die aktuellen Positionen von Institutionen und Fonds im Unternehmen sowie die jüngsten Veränderungen der Positionsgröße. Zu den Großaktionären können Einzelanleger, Investmentfonds, Hedgefonds oder Institutionen gehören. Der Schedule 13D zeigt an, dass der Investor mehr als 5% des Unternehmens hält (oder gehalten hat) und beabsichtigt (oder beabsichtigt hat), aktiv eine Änderung der Geschäftsstrategie zu verfolgen. Schedule 13G zeigt eine passive Investition von über 5% an.
Fondsstimmung-Score
Der Fondsstimmung-Score (auch bekannt als Eigentümer-Akkumulations-Score) ermittelt die Aktien, die am meisten von Fonds gekauft werden. Er ist das Ergebnis eines ausgeklügelten quantitativen Multifaktormodells, das die Unternehmen mit den höchsten institutionellen Käufen identifiziert. Das Scoring-Modell verwendet eine Kombination aus der Gesamtzunahme der offengelegten Eigentümer, den Änderungen der Portfolioallokationen in diesen Eigentümern und anderen Metriken. Die Zahl reicht von 0 bis 100, wobei höhere Zahlen ein höheres Maß an Kapitalakkumulation als bei anderen Unternehmen anzeigen und 50 den Durchschnitt darstellt.
Aktualisierungshäufigkeit: Täglich
Siehe Ownership Explorer, der eine Liste der am höchsten bewerteten Unternehmen enthält.
AI+ Ask Fintel’s AI assistant about Franklin Templeton ETF Trust - Franklin FTSE Europe ETF.
Select a question to share a public post with an AI-crafted answer.
Thinking of good questions…
13F und NPORT Einreichungen
Details zu 13F-Einreichungen sind kostenlos. Für Details zu NP-Einreichungen ist eine Premium-Mitgliedschaft erforderlich. Grüne Zeilen zeigen neue Positionen an. Rote Zeilen zeigen geschlossene Positionen an. Klicken Sie auf das Link Symbol, um den gesamten Transaktionsverlauf zu sehen.
Upgrade
um Prämiendaten freizuschalten und nach Excel zu exportieren ![]() .
.
| Datei Datum | Quelle | Anleger | Typ | Durchschnittlicher Preis (Est) |
Aktien | Δ Aktien (%) |
Gemeldeter Wert ($1000) |
Δ Wert (%) |
Port Alloc (%) |
|
|---|---|---|---|---|---|---|---|---|---|---|
| 2025-10-29 | 13F | Sage Mountain Advisors LLC | 4.729 | 0,00 | 164 | 3,80 | ||||
| 2025-11-13 | 13F | UBS Group AG | 623 | 22 | ||||||
| 2025-11-13 | 13F | Fmr Llc | 133 | 58,33 | 5 | 100,00 | ||||
| 2025-11-14 | 13F | Jane Street Group, Llc | 32.983 | 1.145 | ||||||
| 2025-11-14 | 13F | Flow Traders U.s. Llc | 187.317 | 129,62 | 6 | 200,00 | ||||
| 2025-09-29 | NP | SMILX - SMI 50/40/10 Fund | 5.790 | 80,37 | 192 | 83,65 | ||||
| 2025-07-28 | 13F | SFG Wealth Management, LLC. | 0 | -100,00 | 0 | |||||
| 2025-11-03 | 13F | Treasure Coast Financial Planning | 250.758 | -5,03 | 8.701 | -1,59 | ||||
| 2025-11-12 | 13F | Bare Financial Services, Inc | 612 | 0,00 | 21 | 5,00 | ||||
| 2025-11-14 | 13F | Larson Financial Group LLC | 1.000 | 0,00 | 35 | 3,03 | ||||
| 2025-11-14 | 13F | Royal Bank Of Canada | 181.628 | 1,35 | 6.303 | 5,03 | ||||
| 2025-11-14 | 13F | Comerica Bank | 38.029 | 0,00 | 1.320 | 3,61 | ||||
| 2025-11-14 | 13F | Toroso Investments, LLC | 138.285 | -46,62 | 4.798 | -44,69 | ||||
| 2025-09-29 | NP | SMIDX - SMI Dynamic Allocation Fund | 16.430 | 86,28 | 545 | 90,21 | ||||
| 2025-11-14 | 13F | Vident Advisory, LLC | 0 | -100,00 | 0 | |||||
| 2025-11-12 | 13F | LPL Financial LLC | 22.866 | 4,49 | 793 | 8,33 | ||||
| 2025-11-14 | 13F | Susquehanna International Group, Llp | 16.980 | 589 | ||||||
| 2025-06-27 | 13F/A | Goldman Sachs Group Inc | 0 | -100,00 | 0 | |||||
| 2025-11-13 | 13F | Franklin Resources Inc | 147.559 | -0,90 | 5.120 | 2,61 | ||||
| 2025-08-29 | NP | RAA - SMI 3Fourteen Real Asset Allocation ETF SMI 3Fourteen REAL Asset Allocation ETF | 423.189 | 525,75 | 14.173 | 577,76 | ||||
| 2025-11-14 | 13F | Bank Of America Corp /de/ | 30.949 | 18,83 | 1.074 | 23,05 | ||||
| 2025-10-30 | 13F | Brandywine Oak Private Wealth Llc | 48.895 | 0,00 | 1.697 | 3,60 | ||||
| 2025-11-14 | 13F | Raymond James Financial Inc | 0 | -100,00 | 0 | |||||
| 2025-11-14 | 13F | Gts Securities Llc | 92.954 | -16,62 | 3.226 | -13,61 | ||||
| 2025-08-14 | 13F | EP Wealth Advisors, Inc. | 677.812 | 2,08 | 22.700 | 10,57 | ||||
| 2025-11-14 | 13F | Morgan Stanley | 319 | -1,54 | 11 | 10,00 | ||||
| 2025-08-12 | 13F | Proequities, Inc. | 0 | 0 | ||||||
| 2025-11-17 | 13F | Kestra Private Wealth Services, Llc | 7.210 | 8,68 | 250 | 12,61 | ||||
| 2025-11-14 | 13F | Advisor Group Holdings, Inc. | 55.488 | 12,39 | 1.915 | 15,85 | ||||
| 2025-11-10 | 13F | EverSource Wealth Advisors, LLC | 50.057 | -8,43 | 1.737 | -5,14 |
Other Listings
| US:FLEE | 34,16 $ |