Basisstatistiken
| Institutionelle Eigentümer | 340 total, 328 long only, 0 short only, 12 long/short - change of 6,58% MRQ |
| Durchschnittliche Portfolioallokation | 0.2880 % - change of -6,94% MRQ |
| Institutionelle Aktien (Long) | 318.637.215 (ex 13D/G) - change of 1,09MM shares 0,33% MRQ |
| Institutioneller Wert (Long) | $ 4.453.909 USD ($1000) |
Institutioneller Eigentümerschaft und Aktionäre
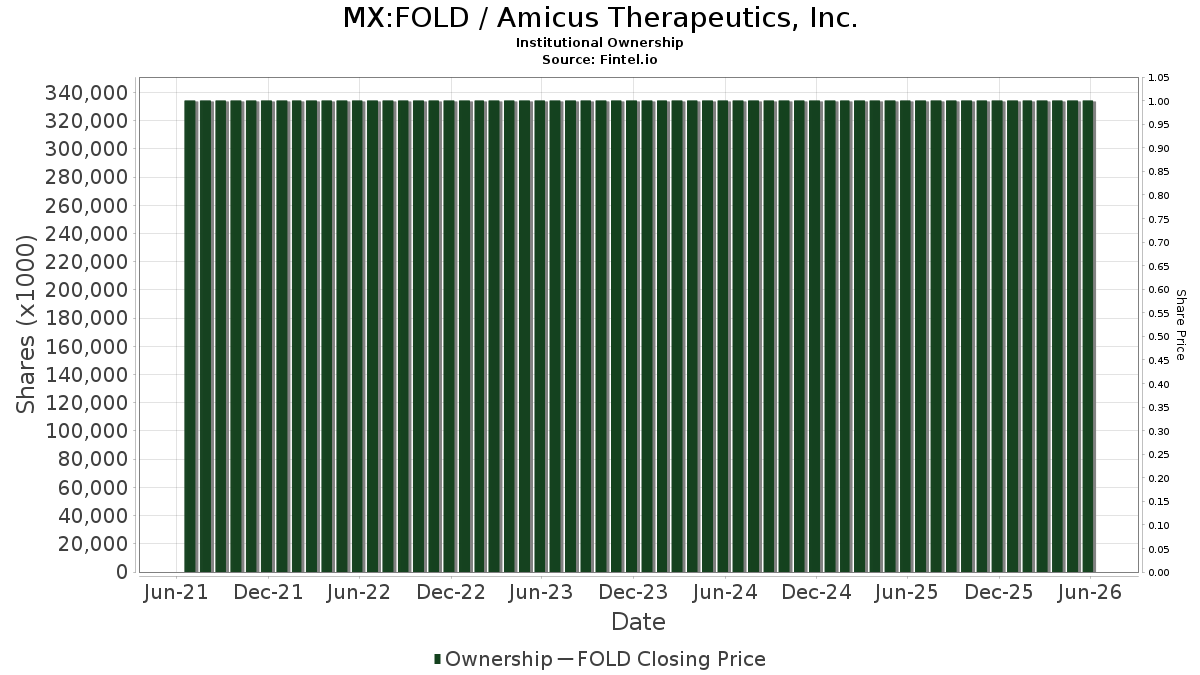
Amicus Therapeutics, Inc. (MX:FOLD) hat 340 institutionelle Eigentümer und Aktionäre, die 13D/G oder 13F Formulare bei der Securities Exchange Commission (SEC) eingereicht haben. Diese Institutionen halten insgesamt 318,637,215 Aktien. Die größten Aktionäre sind BlackRock, Inc., Vanguard Group Inc, Hbk Investments L P, State Street Corp, Pentwater Capital Management LP, Bellevue Group AG, William Blair Investment Management, Llc, Geode Capital Management, Llc, Perceptive Advisors Llc, and Goldman Sachs Group Inc .
Amicus Therapeutics, Inc. (BMV:FOLD) Die institutionelle Eigentümerstruktur zeigt die aktuellen Positionen von Institutionen und Fonds im Unternehmen sowie die jüngsten Veränderungen der Positionsgröße. Zu den Großaktionären können Einzelanleger, Investmentfonds, Hedgefonds oder Institutionen gehören. Der Schedule 13D zeigt an, dass der Investor mehr als 5% des Unternehmens hält (oder gehalten hat) und beabsichtigt (oder beabsichtigt hat), aktiv eine Änderung der Geschäftsstrategie zu verfolgen. Schedule 13G zeigt eine passive Investition von über 5% an.
Fondsstimmung-Score
Der Fondsstimmung-Score (auch bekannt als Eigentümer-Akkumulations-Score) ermittelt die Aktien, die am meisten von Fonds gekauft werden. Er ist das Ergebnis eines ausgeklügelten quantitativen Multifaktormodells, das die Unternehmen mit den höchsten institutionellen Käufen identifiziert. Das Scoring-Modell verwendet eine Kombination aus der Gesamtzunahme der offengelegten Eigentümer, den Änderungen der Portfolioallokationen in diesen Eigentümern und anderen Metriken. Die Zahl reicht von 0 bis 100, wobei höhere Zahlen ein höheres Maß an Kapitalakkumulation als bei anderen Unternehmen anzeigen und 50 den Durchschnitt darstellt.
Aktualisierungshäufigkeit: Täglich
Siehe Ownership Explorer, der eine Liste der am höchsten bewerteten Unternehmen enthält.
AI+ Ask Fintel’s AI assistant about Amicus Therapeutics, Inc..
Select a question to share a public post with an AI-crafted answer.
Thinking of good questions…
13F und NPORT Einreichungen
Details zu 13F-Einreichungen sind kostenlos. Für Details zu NP-Einreichungen ist eine Premium-Mitgliedschaft erforderlich. Grüne Zeilen zeigen neue Positionen an. Rote Zeilen zeigen geschlossene Positionen an. Klicken Sie auf das Link Symbol, um den gesamten Transaktionsverlauf zu sehen.
Upgrade
um Prämiendaten freizuschalten und nach Excel zu exportieren ![]() .
.
| Datei Datum | Quelle | Anleger | Typ | Durchschnittlicher Preis (Est) |
Aktien | Δ Aktien (%) |
Gemeldeter Wert ($1000) |
Δ Wert (%) |
Port Alloc (%) |
|
|---|---|---|---|---|---|---|---|---|---|---|
| 2026-02-06 | 13F | Gsa Capital Partners Llp | 0 | -100,00 | 0 | |||||
| 2026-02-13 | 13F | First Trust Advisors Lp | 533.507 | 240,54 | 7.597 | 515,64 | ||||
| 2026-01-26 | 13F | Cwm, Llc | 50.788 | 39,87 | 1 | |||||
| 2026-02-11 | 13F | Inceptionr Llc | 0 | -100,00 | 0 | |||||
| 2026-02-17 | 13F | Ishara Investments LP | 360.000 | 5.126 | ||||||
| 2025-11-12 | 13F | Nomura Asset Management Co Ltd | 0 | 0 | ||||||
| 2026-02-12 | 13F | Ensign Peak Advisors, Inc | 0 | -100,00 | 0 | |||||
| 2026-02-13 | 13F | Macquarie Group Ltd | 0 | -100,00 | 0 | |||||
| 2026-02-17 | 13F | Redmile Group, LLC | 0 | -100,00 | 0 | |||||
| 2026-02-17 | 13F | Aqr Capital Management Llc | 966.795 | 138,96 | 13.767 | 331,84 | ||||
| 2025-11-06 | 13F | Tempus Wealth Planning, LLC | 0 | -100,00 | 0 | -100,00 | ||||
| 2025-11-14 | 13F | Twinbeech Capital Lp | 0 | -100,00 | 0 | |||||
| 2026-02-17 | 13F | Cim Investment Mangement Inc | 32.305 | 0,00 | 460 | 81,10 | ||||
| 2026-02-13 | 13F | Nfj Investment Group, Llc | 306.013 | -9,13 | 4.358 | 64,23 | ||||
| 2026-02-05 | 13F | Allworth Financial LP | 5.067 | 8,32 | 72 | 100,00 | ||||
| 2026-02-17 | 13F | Bank Of America Corp /de/ | 3.438.241 | -51,64 | 48.961 | -12,60 | ||||
| 2026-02-05 | 13F | Stephens Inc /ar/ | 0 | -100,00 | 0 | |||||
| 2026-02-17 | 13F | Shay Capital LLC | 30.000 | 427 | ||||||
| 2026-02-11 | 13F | Vestcor Inc | 257.412 | 4 | ||||||
| 2026-02-17 | 13F | Tudor Investment Corp Et Al | Call | 37.500 | 534 | |||||
| 2026-02-17 | 13F | Tudor Investment Corp Et Al | 900.000 | 432,59 | 12.816 | 862,89 | ||||
| 2026-02-09 | 13F | Hartland & Co., LLC | 33 | 3.200,00 | 0 | |||||
| 2026-02-17 | 13F | Tudor Investment Corp Et Al | Put | 37.500 | 534 | |||||
| 2025-09-29 | NP | LABU - Direxion Daily S&P Biotech Bull 3X Shares Direxion Daily S&P Biotech Bull 3X Shares | 465.161 | 102,58 | 2.786 | 58,03 | ||||
| 2026-02-03 | 13F | Mitsubishi UFJ Kokusai Asset Management Co., Ltd. | 402 | 0,00 | 6 | 66,67 | ||||
| 2025-11-14 | 13F | Skopos Labs, Inc. | 0 | -100,00 | 0 | |||||
| 2026-02-17 | 13F | XTX Topco Ltd | 0 | -100,00 | 0 | |||||
| 2026-02-05 | 13F | Bessemer Group Inc | 0 | -100,00 | 0 | |||||
| 2026-02-13 | 13F | Verition Fund Management LLC | 649.562 | 332,88 | 9.250 | 682,49 | ||||
| 2026-01-30 | 13F | R Squared Ltd | 13.788 | -46,61 | 196 | -3,45 | ||||
| 2026-02-12 | 13F | Federated Hermes, Inc. | 1.145 | -36,81 | 16 | 14,29 | ||||
| 2026-02-10 | 13F | Axq Capital, Lp | 11.128 | 158 | ||||||
| 2026-02-06 | 13F | Vestmark Advisory Solutions, Inc. | 367.557 | 5.234 | ||||||
| 2026-01-09 | 13F | SG Americas Securities, LLC | 106.358 | 53,21 | 2 | |||||
| 2026-01-21 | 13F | Flagship Harbor Advisors, Llc | 200 | 3 | ||||||
| 2026-02-10 | 13F | Godfrey Financial Associates, Inc. | 121 | 2 | ||||||
| 2026-02-12 | 13F | DRW Securities, LLC | 21.000 | -48,81 | 299 | -5,97 | ||||
| 2026-02-05 | 13F | Stephens Investment Management Group LLC | 1.351.814 | 7,23 | 19.250 | 93,79 | ||||
| 2026-02-11 | 13F | Vise Technologies, Inc. | 69.715 | 10,27 | 993 | 99,20 | ||||
| 2026-01-28 | 13F | Klp Kapitalforvaltning As | 59.200 | 19,35 | 843 | 116,15 | ||||
| 2026-02-09 | 13F | Sectoral Asset Management Inc | 43.300 | -63,65 | 617 | -34,33 | ||||
| 2026-02-11 | 13F | Cerity Partners LLC | 63.081 | 78,80 | 898 | 223,02 | ||||
| 2026-02-02 | 13F | Truist Financial Corp | 0 | -100,00 | 0 | |||||
| 2026-02-12 | 13F | Mount Yale Investment Advisors, LLC | 367.557 | -2,17 | 5.234 | 76,82 | ||||
| 2026-02-13 | 13F | Wells Fargo & Company/mn | 339.426 | 76,32 | 4.833 | 218,80 | ||||
| 2026-02-11 | 13F | LPL Financial LLC | 35.805 | -21,97 | 510 | 41,00 | ||||
| 2026-02-17 | 13F | Two Sigma Advisers, Lp | 590.676 | 71,02 | 8.411 | 209,11 | ||||
| 2026-02-11 | 13F | LPL Financial LLC | Put | 10.000 | 142 | |||||
| 2025-11-14 | 13F | Point72 Asia (Singapore) Pte. Ltd. | 0 | -100,00 | 0 | |||||
| 2026-01-09 | 13F | Diversified Trust Co | 0 | -100,00 | 0 | -100,00 | ||||
| 2025-11-07 | 13F | Readystate Asset Management Lp | 0 | -100,00 | 0 | |||||
| 2026-02-11 | 13F | Ameritas Investment Partners, Inc. | 24.184 | 344 | ||||||
| 2025-10-22 | 13F | Geneos Wealth Management Inc. | 0 | -100,00 | 0 | -100,00 | ||||
| 2026-02-13 | 13F | Virtus ETF Advisers LLC | 1.523 | -66,33 | 22 | -40,00 | ||||
| 2026-02-13 | 13F | Healthcare Of Ontario Pension Plan Trust Fund | 800.000 | 1.214,56 | 11.392 | 2.278,29 | ||||
| 2025-11-14 | 13F | Point72 Hong Kong Ltd | 13.524 | 107 | ||||||
| 2026-02-13 | 13F | Soros Fund Management Llc | 5.000.000 | 71.200 | ||||||
| 2026-01-08 | 13F | Versant Capital Management, Inc | 5.288 | 0,42 | 75 | 82,93 | ||||
| 2026-01-30 | 13F | NJ State Employees Deferred Compensation Plan | 0 | -100,00 | 0 | |||||
| 2026-02-03 | 13F | Credit Industriel Et Commercial | 240.000 | 3.418 | ||||||
| 2026-02-13 | 13F | State Street Corp | 14.833.314 | 28,28 | 211.226 | 131,82 | ||||
| 2026-02-09 | 13F | Knights of Columbus Asset Advisors LLC | 5.476 | -8,75 | 78 | 63,83 | ||||
| 2026-02-12 | 13F | CIBC Private Wealth Group, LLC | 0 | -100,00 | 0 | |||||
| 2026-01-30 | 13F | Caldwell Securities, Inc | 400 | 0,00 | 6 | 66,67 | ||||
| 2025-11-19 | 13F/A | Danske Bank A/s | 0 | -100,00 | 0 | -100,00 | ||||
| 2026-02-13 | 13F | Ieq Capital, Llc | 120.686 | 257,15 | 1.719 | 545,86 | ||||
| 2026-02-17 | 13F | Schonfeld Strategic Advisors LLC | 261.085 | -80,86 | 3.718 | -65,42 | ||||
| 2026-02-13 | 13F | Birchview Capital, LP | 253.000 | 0,00 | 3.603 | 80,73 | ||||
| 2026-02-17 | 13F | Jones Financial Companies Lllp | 278 | 0,00 | 4 | 50,00 | ||||
| 2026-02-17 | 13F | State Of Wisconsin Investment Board | 184.334 | -62,53 | 2.625 | -32,30 | ||||
| 2026-02-11 | 13F | Rise Advisors, LLC | 0 | -100,00 | 0 | |||||
| 2026-02-13 | 13F | American Century Companies Inc | 34.990 | 498 | ||||||
| 2026-02-13 | 13F | Pathstone Holdings, LLC | 100.110 | -1,66 | 1.426 | 77,68 | ||||
| 2026-02-13 | 13F | Prudential Financial Inc | 18.900 | -49,02 | 269 | -7,88 | ||||
| 2026-02-04 | 13F | Versor Investments LP | 871.234 | 12.406 | ||||||
| 2026-02-17 | 13F | Polygon Management Ltd. | 260.771 | 115,14 | 3.713 | 288,80 | ||||
| 2026-02-13 | 13F | Squarepoint Ops LLC | 269.302 | 356,65 | 3.835 | 726,29 | ||||
| 2026-02-13 | 13F | Marshall Wace, Llp | 240.900 | 3.430 | ||||||
| 2026-02-12 | 13F | Xponance, Inc. | 23.532 | 7,51 | 335 | 94,77 | ||||
| 2026-03-04 | 13F | SHP Wealth Management | 25 | 0 | ||||||
| 2026-02-09 | 13F | William Blair Investment Management, Llc | 10.627.717 | -32,52 | 151.339 | 21,94 | ||||
| 2026-02-17 | 13F | Trails Edge Capital Partners, LP | 1.043.313 | 14.857 | ||||||
| 2026-02-17 | 13F | Palo Alto Investors LP | 0 | -100,00 | 0 | |||||
| 2025-11-13 | 13F | Capital Fund Management S.a. | 0 | -100,00 | 0 | -100,00 | ||||
| 2026-02-10 | 13F | Envestnet Asset Management Inc | 16.240 | -77,00 | 231 | -58,45 | ||||
| 2026-02-17 | 13F | Point72 Asset Management, L.P. | 2.068.454 | -71,10 | 29.455 | -47,77 | ||||
| 2026-01-30 | 13F | State of New Jersey Common Pension Fund D | 94.687 | 1.348 | ||||||
| 2026-02-19 | 13F | Invesco Ltd. | 1.259.225 | 172,58 | 17.931 | 392,61 | ||||
| 2026-02-17 | 13F | Royal Bank Of Canada | 25.392 | 65,98 | 361 | 200,83 | ||||
| 2026-02-17 | 13F | Northern Trust Corp | 2.644.213 | -20,77 | 37.654 | 43,18 | ||||
| 2026-02-17 | 13F | California State Teachers Retirement System | 265.511 | 12,56 | 3.781 | 103,44 | ||||
| 2026-02-17 | 13F | Janus Henderson Group Plc | 137.571 | -94,42 | 1.958 | -89,92 | ||||
| 2026-02-13 | 13F | Morgan Stanley | 5.479.689 | 71,31 | 78.031 | 209,58 | ||||
| 2026-02-17 | 13F | Bank Of America Corp /de/ | Call | 0 | -100,00 | 0 | ||||
| 2026-02-13 | 13F | Neo Ivy Capital Management | 420.275 | 753,11 | 5.985 | 1.442,27 | ||||
| 2026-02-09 | 13F | Key FInancial Inc | 100 | 0,00 | 1 | |||||
| 2026-02-17 | 13F | Adage Capital Partners Gp, L.l.c. | 1.650.000 | 23.496 | ||||||
| 2026-02-11 | 13F | Jpmorgan Chase & Co | 3.717.363 | 75,66 | 52.935 | 217,45 | ||||
| 2026-02-17 | 13F | Nomura Holdings Inc | Put | 0 | -100,00 | 0 | ||||
| 2025-11-14 | 13F | Point72 (DIFC) Ltd | 34.876 | -36,78 | 275 | -13,29 | ||||
| 2026-02-17 | 13F | Nomura Holdings Inc | Call | 0 | -100,00 | 0 | ||||
| 2026-01-27 | 13F | First Horizon Corp | 4.786 | 123,85 | 68 | 325,00 | ||||
| 2025-11-14 | 13F | Ion Asset Management Ltd. | 872.411 | 6.875 | ||||||
| 2026-02-17 | 13F | Orbimed Advisors Llc | 729.900 | -55,64 | 10.394 | -19,84 | ||||
| 2026-02-17 | 13F | Cetera Investment Advisers | 13.046 | -5,31 | 186 | 71,30 | ||||
| 2026-02-17 | 13F | Omni Event Management Ltd | 2.994.400 | 42.640 | ||||||
| 2025-10-15 | 13F | Mb, Levis & Associates, Llc | 0 | -100,00 | 0 | |||||
| 2026-02-13 | 13F | Rafferty Asset Management, LLC | 493.088 | 30,20 | 7.022 | 135,29 | ||||
| 2026-02-13 | 13F | Prosight Management, LP | 1.150.000 | -32,73 | 16.376 | 21,56 | ||||
| 2026-02-13 | 13F | Manufacturers Life Insurance Company, The | 0 | -100,00 | 0 | |||||
| 2026-02-13 | 13F | BNP Paribas Asset Management Holding S.A. | 3.209 | 81,50 | 0 | |||||
| 2026-02-13 | 13F | MAI Capital Management | 89 | -96,03 | 1 | -94,12 | ||||
| 2026-02-13 | 13F | Brown Advisory Inc | 45.525 | 0,00 | 648 | 81,01 | ||||
| 2026-02-13 | 13F | Glazer Capital, Llc | 1.603.788 | 23 | ||||||
| 2026-02-12 | 13F | Elo Mutual Pension Insurance Co | 17.904 | 255 | ||||||
| 2026-02-13 | 13F | Panagora Asset Management Inc | 0 | -100,00 | 0 | |||||
| 2026-02-17 | 13F | Engineers Gate Manager LP | 78.659 | -66,12 | 1.120 | -38,76 | ||||
| 2026-02-13 | 13F | Van Eck Associates Corp | 12.126 | 115,08 | 0 | |||||
| 2026-02-03 | 13F | SBI Securities Co., Ltd. | 352 | 0,00 | 5 | 150,00 | ||||
| 2026-02-02 | 13F | Wolverine Asset Management Llc | 24.316 | 346 | ||||||
| 2025-09-29 | NP | POAGX - PRIMECAP Odyssey Aggressive Growth Fund | 700.000 | -22,55 | 4.193 | -39,59 | ||||
| 2026-02-17 | 13F | ExodusPoint Capital Management, LP | 0 | -100,00 | 0 | -100,00 | ||||
| 2026-02-17 | 13F | Cnh Partners Llc | 1.983.109 | 28.239 | ||||||
| 2026-02-13 | 13F | Vivaldi Asset Management, LLC | 1.088.721 | 15.503 | ||||||
| 2026-02-17 | 13F | 9823 Capital, L.P. | 12.847 | 183 | ||||||
| 2026-02-17 | 13F | Water Island Capital Llc | Call | 451.000 | 6.422 | |||||
| 2026-02-17 | 13F | Gotham Asset Management, LLC | 139.551 | 0,74 | 1.987 | 82,13 | ||||
| 2026-02-10 | 13F/A | Northwestern Mutual Wealth Management Co | 1.512 | 332,00 | 22 | 950,00 | ||||
| 2026-02-17 | 13F | Water Island Capital Llc | 706.617 | 10.062 | ||||||
| 2026-02-12 | 13F | Renaissance Technologies Llc | 1.211.693 | -37,64 | 17.255 | 12,68 | ||||
| 2026-02-13 | 13F | Hudson Bay Capital Management LP | 622.500 | -70,00 | 8.864 | -45,79 | ||||
| 2026-02-06 | 13F | Larson Financial Group LLC | 302 | -61,72 | 4 | -33,33 | ||||
| 2026-02-13 | 13F | Alberta Investment Management Corp | 939.200 | 13.374 | ||||||
| 2026-02-11 | 13F | Los Angeles Capital Management Llc | 76.624 | 46,03 | 682 | 64,89 | ||||
| 2026-02-11 | 13F | Erste Asset Management GmbH | 63.850 | 910 | ||||||
| 2026-02-17 | 13F | Kemnay Advisory Services Inc. | 8.767 | 125 | ||||||
| 2026-02-12 | 13F | Athos Capital Ltd | 600.000 | 9 | ||||||
| 2026-02-17 | 13F | Mercer Global Advisors Inc /adv | 16.964 | 242 | ||||||
| 2026-02-13 | 13F | Bridgefront Capital, LLC | 0 | -100,00 | 0 | |||||
| 2025-11-06 | 13F | Assetmark, Inc | 0 | -100,00 | 0 | |||||
| 2026-01-23 | 13F | Rsm Us Wealth Management Llc | 25.046 | 10,55 | 357 | 100,00 | ||||
| 2026-02-12 | 13F | Wealthspire Advisors, LLC | 0 | -100,00 | 0 | |||||
| 2026-02-17 | 13F | Parkman Healthcare Partners LLC | 1.487.283 | -11,86 | 21.179 | 59,28 | ||||
| 2026-02-17 | 13F | Algert Global Llc | 0 | -100,00 | 0 | |||||
| 2026-02-17 | 13F | Voloridge Investment Management, Llc | 561.133 | -18,24 | 7.991 | 47,74 | ||||
| 2026-02-13 | 13F | JustInvest LLC | 24.161 | -2,18 | 344 | 77,32 | ||||
| 2026-02-17 | 13F | Silvercrest Asset Management Group Llc | 945.628 | 0,12 | 13.466 | 80,93 | ||||
| 2026-02-12 | 13F | State Board Of Administration Of Florida Retirement System | 88.119 | 0,00 | 1.255 | 80,69 | ||||
| 2026-02-13 | 13F | P Schoenfeld Asset Management Lp | 363.000 | 5.169 | ||||||
| 2026-02-10 | 13F | Connor, Clark & Lunn Investment Management Ltd. | 1.218.000 | -39,69 | 17.344 | 8,99 | ||||
| 2026-01-14 | 13F | Wedge Capital Management L L P/nc | 129.224 | -3,19 | 1.840 | 75,07 | ||||
| 2026-02-13 | 13F | Rhumbline Advisers | 376.752 | -10,70 | 5.365 | 61,37 | ||||
| 2026-02-13 | 13F | Charles Schwab Investment Management Inc | 2.561.753 | -6,92 | 36.479 | 68,21 | ||||
| 2025-11-12 | 13F | Edgestream Partners, L.P. | 0 | -100,00 | 0 | -100,00 | ||||
| 2026-02-12 | 13F | Voya Investment Management Llc | 107.431 | -79,95 | 1.530 | -63,78 | ||||
| 2025-10-22 | 13F | Old Second National Bank Of Aurora | 0 | -100,00 | 0 | |||||
| 2026-01-28 | 13F | Peregrine Capital Management Llc | 0 | -100,00 | 0 | |||||
| 2026-02-13 | 13F | Caxton Associates Llp | 11.396 | 162 | ||||||
| 2026-02-02 | 13F | Principal Financial Group Inc | 399.510 | 51,72 | 5.689 | 174,17 | ||||
| 2026-01-28 | 13F | Arizona State Retirement System | 77.329 | 6,15 | 1.101 | 91,81 | ||||
| 2026-02-17 | 13F | FIL Ltd | 957.000 | 13.628 | ||||||
| 2026-02-17 | 13F | Sphera Funds Management Ltd. | 658.377 | -33,57 | 9.375 | 20,04 | ||||
| 2026-02-11 | 13F | Hughes Financial Services, LLC | 83 | 0,00 | 1 | |||||
| 2026-02-05 | 13F | GABELLI & Co INVESTMENT ADVISERS, INC. | 485.950 | 6.920 | ||||||
| 2026-02-05 | 13F | DnB Asset Management AS | 0 | -100,00 | 0 | |||||
| 2026-02-17 | 13F | D. E. Shaw & Co., Inc. | 1.549.003 | -59,96 | 22.058 | -27,64 | ||||
| 2026-02-12 | 13F | Steward Partners Investment Advisory, Llc | 1.000 | 0,00 | 14 | 100,00 | ||||
| 2026-01-28 | 13F | WPG Advisers, LLC | 17 | 0,00 | 0 | |||||
| 2026-02-24 | 13F | Bell Investment Advisors, Inc | 371 | 0,00 | 5 | 150,00 | ||||
| 2026-02-17 | 13F | Capstone Investment Advisors, Llc | 1.850.000 | 4.110,86 | 26.344 | 7.513,87 | ||||
| 2025-11-14 | 13F | Sherbrooke Park Advisers Llc | 0 | -100,00 | 0 | |||||
| 2026-02-10 | 13F | Intech Investment Management Llc | 103.539 | 0,00 | 1.474 | 80,86 | ||||
| 2026-01-14 | 13F | CIBRA Capital Ltd | 210.800 | 3.002 | ||||||
| 2026-02-17 | 13F | Two Sigma Securities, Llc | 0 | -100,00 | 0 | |||||
| 2026-02-17 | 13F | Fmr Llc | 178.432 | -64,58 | 2.541 | -36,00 | ||||
| 2025-11-14 | 13F | Raymond James Financial Inc | 0 | -100,00 | 0 | |||||
| 2026-01-28 | 13F | DekaBank Deutsche Girozentrale | 217.700 | 0,00 | 3 | 100,00 | ||||
| 2026-02-17 | 13F | Zacks Investment Management | 11.625 | 166 | ||||||
| 2026-02-03 | 13F | RFG Advisory, LLC | 108.356 | 1.543 | ||||||
| 2026-02-05 | 13F | Alpine Associates Management Inc. | 949.200 | 13.517 | ||||||
| 2026-02-17 | 13F | Caption Management, LLC | 0 | -100,00 | 0 | |||||
| 2026-02-17 | 13F | Cinctive Capital Management LP | 275.000 | 3.916 | ||||||
| 2026-02-06 | 13F | Global Retirement Partners, LLC | 57 | 23,91 | 1 | |||||
| 2026-02-17 | 13F | Cantor Fitzgerald, L. P. | 50.000 | 712 | ||||||
| 2026-02-13 | 13F | Walleye Capital LLC | Call | 100 | -98,39 | 1 | -97,92 | |||
| 2026-02-05 | 13F | Thrivent Financial For Lutherans | 0 | -100,00 | 0 | |||||
| 2026-02-13 | 13F | Walleye Capital LLC | Put | 5.500 | -75,11 | 78 | -55,17 | |||
| 2026-02-11 | 13F | Fox Run Management, L.l.c. | 0 | -100,00 | 0 | |||||
| 2026-02-13 | 13F | Walleye Capital LLC | 26.030 | -94,86 | 371 | -90,74 | ||||
| 2026-02-06 | 13F | Pnc Financial Services Group, Inc. | 543 | 20,67 | 8 | 133,33 | ||||
| 2026-02-09 | 13F | Hantz Financial Services, Inc. | 132 | 0 | ||||||
| 2026-02-12 | 13F | Quadrant Capital Group Llc | 1.350 | 0,00 | 19 | 90,00 | ||||
| 2026-01-05 | 13F | GAMMA Investing LLC | 1.987 | 167,07 | 28 | 460,00 | ||||
| 2026-02-12 | 13F | Granite Investment Partners, LLC | 0 | -100,00 | 0 | |||||
| 2026-02-13 | 13F | SRS Capital Advisors, Inc. | 620 | -63,51 | 9 | -38,46 | ||||
| 2026-02-17 | 13F | Angelo Gordon & Co., L.p. | 100.000 | 1.424 | ||||||
| 2026-02-17 | 13F | Citadel Advisors Llc | 5.096.796 | -38,22 | 72.578 | 11,64 | ||||
| 2026-02-13 | 13F | Carmignac Gestion | 194.887 | 2.775 | ||||||
| 2026-01-09 | 13F | Assenagon Asset Management S.A. | 0 | -100,00 | 0 | |||||
| 2026-02-17 | 13F | Citadel Advisors Llc | Put | 14.000 | -76,03 | 199 | -56,74 | |||
| 2026-02-17 | 13F | Citadel Advisors Llc | Call | 20.600 | -15,57 | 293 | 52,60 | |||
| 2026-01-23 | 13F | U.S. Capital Wealth Advisors, LLC | 10.062 | 143 | ||||||
| 2026-02-11 | 13F | Parallel Advisors, LLC | 5.756 | 0,00 | 82 | 80,00 | ||||
| 2026-02-11 | 13F | Primecap Management Co/ca/ | 589.400 | -11,75 | 8.393 | 59,47 | ||||
| 2026-02-17 | 13F | Pentwater Capital Management LP | 11.500.000 | 163.760 | ||||||
| 2026-02-09 | 13F | Harbour Investments, Inc. | 0 | -100,00 | 0 | |||||
| 2026-02-04 | 13F | ELCO Management Co., LLC | 0 | -100,00 | 0 | |||||
| 2025-11-07 | 13F | M&G Plc | 0 | -100,00 | 0 | |||||
| 2026-02-17 | 13F | Polymer Capital Management (US) LLC | 21.841 | -41,50 | 311 | 5,78 | ||||
| 2026-02-02 | 13F | Strs Ohio | 4.800 | 68 | ||||||
| 2026-02-12 | 13F | Cibc World Markets Corp | 19.710 | -42,55 | 281 | 42,86 | ||||
| 2026-02-17 | 13F | Wellington Management Group Llp | 1.373.867 | -95,20 | 19.564 | -91,33 | ||||
| 2026-02-13 | 13F | Sterling Capital Management LLC | 1.946 | 188,30 | 28 | 440,00 | ||||
| 2026-02-17 | 13F | Trexquant Investment LP | 0 | -100,00 | 0 | |||||
| 2026-02-17 | 13F | Sender Co & Partners, Inc. | 0 | -100,00 | 0 | |||||
| 2025-10-28 | 13F | Campbell & CO Investment Adviser LLC | 0 | -100,00 | 0 | |||||
| 2026-02-17 | 13F | Perceptive Advisors Llc | 6.370.851 | 0,00 | 90.721 | 80,71 | ||||
| 2026-02-17 | 13F | Russell Investments Group, Ltd. | 74.173 | -40,48 | 1.056 | 7,65 | ||||
| 2026-01-20 | 13F | Signaturefd, Llc | 2.895 | 32,74 | 41 | 141,18 | ||||
| 2026-02-17 | 13F | Avoro Capital Advisors LLC | 0 | -100,00 | 0 | |||||
| 2026-02-03 | 13F | Grimes & Company, Inc. | 24.383 | 0,00 | 347 | 80,73 | ||||
| 2026-02-17 | 13F | PenderFund Capital Management Ltd. | 11.900 | 169 | ||||||
| 2026-02-12 | 13F | New York State Common Retirement Fund | 88.516 | -72,57 | 1.260 | -50,45 | ||||
| 2026-02-17 | 13F | Jain Global LLC | 119.454 | 192,71 | 1.701 | 429,91 | ||||
| 2026-01-23 | 13F | Farther Finance Advisors, LLC | 1.871 | 2.651,47 | 27 | |||||
| 2026-01-30 | 13F | Us Bancorp \de\ | 2.251 | 0,00 | 32 | 88,24 | ||||
| 2026-02-13 | 13F | Ubs Asset Management Americas Inc | 857.834 | 4,24 | 12.216 | 88,39 | ||||
| 2026-02-09 | 13F | Jefferies Financial Group Inc. | 165.485 | 0,00 | 2.357 | 80,67 | ||||
| 2026-03-19 | 13F/A | Barclays Plc | Call | 0 | -100,00 | 0 | -100,00 | |||
| 2026-01-29 | 13F | Dunhill Financial, LLC | 5 | 0 | ||||||
| 2025-11-14 | 13F | Cubist Systematic Strategies, LLC | 861.451 | -60,90 | 6.788 | -46,22 | ||||
| 2026-02-17 | 13F | Prelude Capital Management, Llc | 349.414 | 4.976 | ||||||
| 2026-02-17 | 13F | Optiver Holding B.V. | 6.976 | 287,13 | 99 | 607,14 | ||||
| 2026-02-10 | 13F | Norges Bank | 1.165.028 | 16.590 | ||||||
| 2026-02-10 | 13F | Bank of New York Mellon Corp | 829.904 | 1,27 | 11.818 | 83,01 | ||||
| 2026-02-12 | 13F | Alps Advisors Inc | 252.834 | 70,77 | 3.600 | 208,75 | ||||
| 2026-02-13 | 13F | Barclays Plc | Put | 0 | -100,00 | 0 | -100,00 | |||
| 2026-02-10 | 13F | Close Asset Management Ltd | 600 | 0,00 | 0 | |||||
| 2026-02-05 | 13F | ANTIPODES PARTNERS Ltd | 3.926 | 0,00 | 56 | 83,33 | ||||
| 2026-02-13 | 13F | Pinnacle Wealth Planning Services, Inc. | 994 | 14 | ||||||
| 2026-02-17 | 13F | Creative Planning | 402.405 | 5,61 | 5.730 | 90,87 | ||||
| 2026-02-17 | 13F | Guggenheim Capital Llc | 89.180 | 2,97 | 1.270 | 86,07 | ||||
| 2025-11-12 | 13F | Advantage Alpha Capital Partners LP | 0 | -100,00 | 0 | |||||
| 2026-01-29 | 13F | UBS Group AG | 5.893.288 | 240,48 | 83.920 | 515,29 | ||||
| 2026-02-03 | 13F | Ballentine Partners, LLC | 13.620 | -1,94 | 194 | 77,06 | ||||
| 2026-01-27 | 13F | Zurcher Kantonalbank (Zurich Cantonalbank) | 79.336 | 31,81 | 1.130 | 138,19 | ||||
| 2026-02-17 | 13F | 683 Capital Management, LLC | 800.000 | -4,19 | 11.392 | 73,16 | ||||
| 2026-02-17 | 13F | Weiss Asset Management LP | 1.892.797 | 26.953 | ||||||
| 2026-02-12 | 13F | MetLife Investment Management, LLC | 164.210 | -0,69 | 2.338 | 79,57 | ||||
| 2026-02-04 | 13F | Abc Arbitrage Sa | 472.984 | 6.735 | ||||||
| 2025-11-13 | 13F | Quadrature Capital Ltd | 0 | -100,00 | 0 | |||||
| 2026-02-17 | 13F | Advisor Group Holdings, Inc. | 2.783 | -17,39 | 40 | 50,00 | ||||
| 2026-02-11 | 13F | Franklin Resources Inc | 91.869 | 62,49 | 1.308 | 193,93 | ||||
| 2026-02-13 | 13F | Toroso Investments, LLC | 51.156 | -3,83 | 728 | 73,75 | ||||
| 2026-02-12 | 13F | EntryPoint Capital, LLC | 0 | -100,00 | 0 | |||||
| 2026-02-17 | 13F | Superstring Capital Management Lp | 352.896 | 5.025 | ||||||
| 2026-01-22 | 13F | Massachusetts Financial Services Co /ma/ | 125.524 | -96,62 | 1.787 | -93,89 | ||||
| 2026-02-17 | 13F | Sand Grove Capital Management LLP | 1.647.030 | 23.454 | ||||||
| 2026-02-06 | 13F | Kingdom Financial Group LLC. | 15.045 | 214 | ||||||
| 2026-02-13 | 13F | Capula Management Ltd | 30.000 | 427 | ||||||
| 2025-11-21 | 13F | Nebula Research & Development LLC | 0 | -100,00 | 0 | |||||
| 2025-11-12 | 13F | 111 Capital | 0 | -100,00 | 0 | |||||
| 2026-01-27 | 13F | Gf Fund Management Co. Ltd. | 6.063 | -8,58 | 86 | 65,38 | ||||
| 2026-02-13 | 13F | Public Employees Retirement Association Of Colorado | 30.145 | 0,00 | 0 | |||||
| 2026-02-17 | 13F | Meteora Capital, LLC | 507.951 | 7.233 | ||||||
| 2026-02-13 | 13F | Y-Intercept (Hong Kong) Ltd | 149.771 | -43,10 | 2.133 | 2,80 | ||||
| 2026-01-14 | 13F | Eastern Bank | 525 | 7 | ||||||
| 2026-02-17 | 13F | Caption Management, LLC | Call | 120.000 | 140,00 | 1.709 | 333,50 | |||
| 2025-09-29 | NP | SUNAMERICA SERIES TRUST - SA Small Cap Index Portfolio Class 1 | 32.949 | -1,18 | 197 | -23,05 | ||||
| 2026-01-29 | 13F | Pictet Asset Management Holding SA | 1.994.855 | -70,61 | 28.426 | -46,99 | ||||
| 2026-01-26 | 13F | KBC Group NV | 10.154 | 0,00 | 0 | |||||
| 2026-02-13 | 13F | Walleye Trading LLC | Call | 39.700 | 189,78 | 565 | 428,04 | |||
| 2026-02-13 | 13F | Walleye Trading LLC | 210.578 | 2.999 | ||||||
| 2026-02-13 | 13F | Walleye Trading LLC | Put | 282.800 | 2.593,33 | 4.027 | 4.810,98 | |||
| 2026-02-10 | 13F | NINE MASTS CAPITAL Ltd | 50.000 | 712 | ||||||
| 2025-11-14 | 13F | Osterweis Capital Management Inc | 0 | -100,00 | 0 | |||||
| 2026-02-17 | 13F | Virtus Investment Advisers, Inc. | 64.777 | -10,06 | 922 | 62,61 | ||||
| 2026-02-13 | 13F | Kilter Group LLC | 131 | 2 | ||||||
| 2026-01-28 | 13F | Teacher Retirement System Of Texas | 40.836 | -32,32 | 582 | 22,32 | ||||
| 2026-02-04 | 13F | Twin Lakes Capital Management, LLC | 6.000 | 0,00 | 85 | 80,85 | ||||
| 2026-02-06 | 13F | Leonteq Securities AG | 2.757 | -79,19 | 39 | -62,50 | ||||
| 2026-02-11 | 13F | Deutsche Bank Ag\ | 3.457.228 | 39,37 | 49.231 | 151,85 | ||||
| 2026-02-06 | 13F | Covestor Ltd | 7.148 | -45,96 | 0 | |||||
| 2026-02-09 | 13F | Beck Bode, LLC | 32.792 | 467 | ||||||
| 2026-02-17 | 13F | Moore Capital Management, Lp | 137.000 | 1.951 | ||||||
| 2026-02-13 | 13F | Maven Securities LTD | 789.282 | 11.239 | ||||||
| 2026-02-10 | 13F | Bnp Paribas Arbitrage, Sa | 2.251.710 | 23,92 | 32.064 | 123,94 | ||||
| 2026-02-09 | 13F | Legal & General Group Plc | 283.007 | 7,16 | 4.030 | 93,66 | ||||
| 2026-02-17 | 13F | Farallon Capital Management Llc | 16.000 | 0,00 | 228 | 80,16 | ||||
| 2025-11-14 | 13F | Point72 Europe (London) LLP | 5.877 | 46 | ||||||
| 2026-02-05 | 13F | Amalgamated Bank | 9.360 | 3,76 | 0 | |||||
| 2026-02-12 | 13F | Bank Of Montreal /can/ | 25.450 | 0,00 | 362 | 81,00 | ||||
| 2026-02-13 | 13F | Mariner, LLC | 36.677 | 217,80 | 522 | 480,00 | ||||
| 2026-02-17 | 13F | Man Group plc | 400.000 | 5.696 | ||||||
| 2026-02-09 | 13F | Geode Capital Management, Llc | 7.345.267 | 3,47 | 104.616 | 86,98 | ||||
| 2026-02-17 | 13F | Blackstone Group Inc | 2.574.204 | 4,34 | 36.657 | 88,56 | ||||
| 2026-02-17 | 13F | Persistent Asset Partners Ltd | Call | 0 | -100,00 | 0 | ||||
| 2025-10-17 | 13F | Fortitude Family Office, LLC | 0 | -100,00 | 0 | |||||
| 2026-02-17 | 13F | Canada Pension Plan Investment Board | 285.727 | 39,98 | 4.069 | 152,99 | ||||
| 2026-01-23 | 13F | State of Alaska, Department of Revenue | 16.628 | 4,00 | 0 | |||||
| 2026-01-28 | 13F | Universal- Beteiligungs- und Servicegesellschaft mbH | 231.337 | -28,49 | 3.294 | 29,23 | ||||
| 2026-02-17 | 13F | TIG Advisors, LLC | 2.927.424 | 41.687 | ||||||
| 2026-02-10 | 13F | Daiwa Securities Group Inc. | 916 | -7,10 | 0 | |||||
| 2025-11-13 | 13F | Hsbc Holdings Plc | 0 | -100,00 | 0 | -100,00 | ||||
| 2026-02-12 | 13F | BlackRock, Inc. | 32.524.381 | 25,82 | 463.147 | 127,38 | ||||
| 2026-02-13 | 13F | Police & Firemen's Retirement System of New Jersey | 80.421 | 4,17 | 1.145 | 88,32 | ||||
| 2026-01-29 | 13F | Comerica Bank | 28.452 | -6,42 | 405 | 69,46 | ||||
| 2025-11-10 | 13F | Wrapmanager Inc | 0 | -100,00 | 0 | |||||
| 2026-01-23 | 13F | Private Wealth Management Group, LLC | 102 | 0,00 | 1 | |||||
| 2026-01-29 | 13F | Vanguard Group Inc | 29.702.696 | 0,57 | 422.966 | 81,74 | ||||
| 2026-02-17 | 13F | Delaware Management Holdings, Inc. | 5.069.590 | 72.191 | ||||||
| 2025-09-29 | NP | RSSL - Global X Russell 2000 ETF | 142.456 | -20,10 | 853 | -37,69 | ||||
| 2026-01-21 | 13F | Capricorn Fund Managers Ltd | 210.674 | 3.000 | ||||||
| 2026-02-04 | 13F | Swiss Life Asset Management Ltd | 12.757 | 21,18 | 182 | 120,73 | ||||
| 2026-02-13 | 13F | Great West Life Assurance Co /can/ | 43.678 | -48,34 | 1 | |||||
| 2026-02-13 | 13F | Citigroup Inc | Call | 100.000 | 1.424 | |||||
| 2026-02-10 | 13F | State of Wyoming | 14.237 | 41,27 | 203 | 155,70 | ||||
| 2026-02-13 | 13F | Citigroup Inc | Put | 100.000 | 1.424 | |||||
| 2026-02-17 | 13F | Iron Triangle Partners LP | 0 | -100,00 | 0 | |||||
| 2026-02-09 | 13F | Huntington National Bank | 1 | 0,00 | 0 | |||||
| 2026-02-13 | 13F | Victory Capital Management Inc | 347.428 | 1,34 | 4.947 | 83,15 | ||||
| 2026-02-13 | 13F | Citigroup Inc | 1.648.547 | 1.368,52 | 23.475 | 2.555,54 | ||||
| 2026-01-08 | 13F | Nordea Investment Management Ab | 0 | -100,00 | 0 | -100,00 | ||||
| 2026-02-17 | 13F | PDT Partners, LLC | 449.999 | -11,08 | 6.408 | 60,70 | ||||
| 2026-02-17 | 13F | Lazard Asset Management Llc | 41.284 | 116,31 | 588 | 291,33 | ||||
| 2026-02-13 | 13F | Quarry LP | 36.280 | 1.721,29 | 517 | 3.340,00 | ||||
| 2026-02-12 | 13F | denkapparat Operations GmbH | 21.856 | 0,00 | 311 | 80,81 | ||||
| 2026-02-17 | 13F | Oxford Asset Management Llp | 0 | -100,00 | 0 | -100,00 | ||||
| 2026-02-13 | 13F | Barclays Plc | 1.134.639 | 79,62 | 16.157 | 139,50 | ||||
| 2026-02-17 | 13F | Alliancebernstein L.p. | 2.711.443 | 648,13 | 38.611 | 1.252,36 | ||||
| 2025-11-19 | 13F | Ambassador Advisors, LLC | 0 | -100,00 | 0 | |||||
| 2026-01-26 | 13F | Mirae Asset Global Investments Co., Ltd. | 14.993 | 25,81 | 214 | 129,03 | ||||
| 2026-02-10 | 13F | Mutual Of America Capital Management Llc | 276.044 | -0,60 | 3.931 | 79,62 | ||||
| 2026-02-10 | 13F | Goldman Sachs Group Inc | 6.142.956 | 62,33 | 87.476 | 193,35 | ||||
| 2026-02-10 | 13F | Impact Partnership Wealth, LLC | 19.787 | 51,96 | 282 | 175,49 | ||||
| 2026-01-08 | 13F | Wealth Enhancement Advisory Services, Llc | 37.326 | 56,29 | 533 | 174,74 | ||||
| 2026-02-17 | 13F | Harvest Management Llc | 250.000 | 3.560 | ||||||
| 2026-02-11 | 13F | Picton Mahoney Asset Management | 615.168 | 8.760 | ||||||
| 2025-09-29 | NP | GURU - Global X Guru Index ETF This fund is a listed as child fund of Mirae Asset Global Investments Co., Ltd. and if that institution has disclosed ownership in this security, then these positions will not be double counted when calculating total shares and total value | 95.338 | 59,15 | 571 | 24,13 | ||||
| 2026-02-17 | 13F | Magnetar Financial LLC | 3.967.915 | 56.503 | ||||||
| 2026-02-13 | 13F | PSquared Asset Management AG | 1.050.000 | 14.952 | ||||||
| 2026-01-16 | 13F | FNY Investment Advisers, LLC | 35.700 | 553,85 | 1 | |||||
| 2026-02-10 | 13F | Acadian Asset Management Llc | 576.762 | 342,19 | 8 | 700,00 | ||||
| 2026-02-11 | 13F | Allianz Asset Management GmbH | 1.486.996 | 282,15 | 21.175 | 590,61 | ||||
| 2026-02-13 | 13F | Bridgewater Associates, LP | 32.274 | 460 | ||||||
| 2026-01-05 | 13F | Park National Corp /oh/ | 0 | -100,00 | 0 | -100,00 | ||||
| 2026-02-02 | 13F | Chicago Capital Management, LLC | 400.000 | 4.284 | ||||||
| 2026-02-17 | 13F | Susquehanna Portfolio Strategies, LLC | 1.075.323 | 0,00 | 15.313 | 80,72 | ||||
| 2026-02-17 | 13F | Freestone Grove Partners LP | 0 | -100,00 | 0 | |||||
| 2026-02-10 | 13F | Hazlett, Burt & Watson, Inc. | 1.569 | 0,00 | 0 | |||||
| 2026-02-17 | 13F | Diadema Partners Lp | Call | 0 | -100,00 | 0 | ||||
| 2025-11-06 | 13F | Abich Financial Wealth Management LLC | 10.779 | 85 | ||||||
| 2026-02-17 | 13F | Bellevue Group AG | 10.735.195 | 152.869 | ||||||
| 2026-01-23 | 13F | Sumitomo Mitsui Trust Holdings, Inc. | 14.850 | 22,22 | 211 | 122,11 | ||||
| 2026-02-17 | 13F | Rock Springs Capital Management LP | 1.929.931 | -0,90 | 27.482 | 79,09 | ||||
| 2026-02-12 | 13F | Soleus Capital Management, L.P. | 5.207.284 | 11,03 | 74.152 | 100,64 | ||||
| 2026-02-13 | 13F | Sei Investments Co | 216.917 | -29,49 | 3.089 | 27,39 | ||||
| 2026-02-18 | 13F | Vident Advisory, LLC | 21.391 | -14,32 | 305 | 55,10 | ||||
| 2026-02-17 | 13F | Fortress Investment Group LLC | 110.000 | 1.566 | ||||||
| 2026-02-17 | 13F | Caption Management, LLC | Put | 0 | -100,00 | 0 | ||||
| 2026-02-13 | 13F | Headlands Technologies LLC | 0 | -100,00 | 0 | |||||
| 2025-11-21 | 13F/A | CIBC Bancorp USA Inc. | 29.682 | 234 | ||||||
| 2026-02-05 | 13F | Gabelli Funds Llc | 552.950 | 7.874 | ||||||
| 2026-02-17 | 13F | Boothbay Fund Management, Llc | 233.657 | 3.327 | ||||||
| 2026-01-29 | 13F | Teachers Retirement System Of The State Of Kentucky | 0 | -100,00 | 0 | |||||
| 2026-02-06 | 13F | Legato Capital Management LLC | 43.553 | 8,31 | 620 | 96,20 | ||||
| 2026-02-17 | 13F | Two Sigma Investments, Lp | 1.473.341 | 51,13 | 20.980 | 173,11 | ||||
| 2026-02-26 | 13F | Seven Fleet Capital Management LP | 82.500 | 1.175 | ||||||
| 2026-02-12 | 13F | Groupe la Francaise | 234.202 | 3.335 | ||||||
| 2026-02-17 | 13F | Hbk Investments L P | 15.250.000 | 217.160 | ||||||
| 2026-02-17 | 13F | Susquehanna International Group, Llp | Put | 450.200 | 6,76 | 6.411 | 92,96 | |||
| 2026-02-17 | 13F | Susquehanna International Group, Llp | Call | 372.900 | -13,76 | 5.310 | 55,86 | |||
| 2026-02-17 | 13F | Susquehanna International Group, Llp | 144.763 | 570,73 | 2.061 | 1.112,35 | ||||
| 2026-01-08 | 13F | True Wealth Design, LLC | 893 | 4,94 | 13 | 100,00 | ||||
| 2025-11-14 | 13F | Wolverine Trading, Llc | 11.399 | -56,88 | 91 | -42,31 | ||||
| 2026-02-02 | 13F | CM Management, LLC | 370.000 | -17,78 | 5.269 | 48,56 | ||||
| 2025-11-14 | 13F | Wolverine Trading, Llc | Call | 28.600 | 227 | |||||
| 2025-11-14 | 13F | Wolverine Trading, Llc | Put | 20.500 | -4,65 | 163 | 27,56 | |||
| 2026-02-17 | 13F | Woodline Partners LP | 1.285.200 | 15,74 | 18.301 | 109,18 | ||||
| 2025-11-13 | 13F | Schroder Investment Management Group | 0 | -100,00 | 0 | |||||
| 2026-01-15 | 13F | Allspring Global Investments Holdings, LLC | 27.062 | 8,91 | 386 | 102,09 | ||||
| 2026-02-17 | 13F | PharVision Advisers, LLC | 0 | -100,00 | 0 | |||||
| 2026-02-11 | 13F | Simplex Trading, Llc | Call | 7.100 | -79,83 | 101 | ||||
| 2026-02-11 | 13F | Simplex Trading, Llc | Put | 21.300 | -33,64 | 303 | ||||
| 2026-02-11 | 13F | Simplex Trading, Llc | 18.857 | 269 | ||||||
| 2026-02-17 | 13F | Millennium Management Llc | Call | 50.000 | -71,01 | 712 | -47,61 | |||
| 2026-02-17 | 13F | Millennium Management Llc | 2.995.089 | -74,64 | 42.650 | -54,17 | ||||
| 2026-02-11 | 13F | Empowered Funds, LLC | 112.707 | 113,81 | 1.605 | 101,76 | ||||
| 2026-02-12 | 13F | Swiss National Bank | 547.000 | 14,51 | 7.789 | 106,93 | ||||
| 2026-02-13 | 13F | Parkside Financial Bank & Trust | 270 | 0,00 | 4 | 50,00 | ||||
| 2026-02-12 | 13F | Jane Street Group, Llc | 726.797 | -44,66 | 10.350 | 0,00 | ||||
| 2026-02-12 | 13F | Jane Street Group, Llc | Put | 158.200 | 10,86 | 2.253 | 100,36 | |||
| 2026-02-12 | 13F | Jane Street Group, Llc | Call | 27.200 | 39,49 | 387 | 152,94 | |||
| 2026-01-21 | 13F | SJS Investment Consulting Inc. | 48 | 1 | ||||||
| 2026-02-18 | 13F | Mackenzie Financial Corp | 17.446 | -88,19 | 248 | -78,69 | ||||
| 2026-02-11 | 13F | Group One Trading, L.p. | Call | 22.700 | 38,41 | 323 | 150,39 | |||
| 2026-02-11 | 13F | Group One Trading, L.p. | Put | 41.500 | -3,26 | 591 | 74,56 | |||
| 2026-02-11 | 13F | Group One Trading, L.p. | 13.469 | -68,78 | 192 | -43,82 | ||||
| 2026-02-13 | 13F | Caitong International Asset Management Co., Ltd | 4.367 | 62 | ||||||
| 2026-02-14 | 13F | Rockefeller Capital Management L.P. | 1.462 | 7,50 | 21 | 100,00 | ||||
| 2026-01-07 | 13F | Aventura Private Wealth, LLC | 0 | -100,00 | 0 | -100,00 | ||||
| 2026-02-17 | 13F | Sovereign's Capital Management, LLC | 784.942 | -5,93 | 11.178 | 69,99 | ||||
| 2026-02-10 | 13F | Rothschild Investment Llc | 532 | 36,41 | 8 | 133,33 | ||||
| 2026-01-15 | 13F | Trust Co | 61 | 1 | ||||||
| 2026-02-17 | 13F | Quantinno Capital Management LP | 34.980 | 20,12 | 498 | 117,47 | ||||
| 2026-02-17 | 13F | LMR Partners LLP | Call | 9.700 | 138 | |||||
| 2026-02-17 | 13F | Jump Financial, LLC | 609.941 | -37,75 | 8.686 | 12,50 | ||||
| 2026-02-06 | 13F | EverSource Wealth Advisors, LLC | 5.796 | -30,30 | 83 | 26,15 | ||||
| 2026-02-17 | 13F | LMR Partners LLP | Put | 500.000 | 7.120 | |||||
| 2026-02-17 | 13F | LMR Partners LLP | 1.157.200 | 16.479 | ||||||
| 2026-02-17 | 13F | Brevan Howard Capital Management LP | 0 | -100,00 | 0 | |||||
| 2026-02-13 | 13F | Ubs Oconnor Llc | 1.000.000 | 14.240 | ||||||
| 2026-02-06 | 13F | IFP Advisors, Inc | 1.036 | 384,11 | 15 | 1.300,00 | ||||
| 2026-02-17 | 13F | Aquatic Capital Management LLC | 0 | -100,00 | 0 | |||||
| 2026-02-17 | 13F | Ameriprise Financial Inc | 0 | -100,00 | 0 | |||||
| 2026-02-17 | 13F | Captrust Financial Advisors | 25.400 | 1,84 | 362 | 84,18 | ||||
| 2026-02-17 | 13F | Balyasny Asset Management Llc | Call | 59.500 | 847 | |||||
| 2026-02-17 | 13F | Balyasny Asset Management Llc | 5.124.427 | 272,13 | 72.972 | 572,48 | ||||
| 2026-01-23 | 13F | Avion Wealth | 227 | -17,15 | 0 | |||||
| 2026-01-30 | 13F | Torren Management, LLC | 174 | 2 | ||||||
| 2026-02-05 | 13F | Mesirow Financial Investment Management, Inc. | 13.000 | 0,00 | 185 | 81,37 | ||||
| 2026-02-06 | 13F | Bare Financial Services, Inc | 216 | 60,00 | 3 | 200,00 | ||||
| 2026-02-13 | 13F | Smartleaf Asset Management LLC | 3.768 | 276,05 | 54 | 657,14 | ||||
| 2026-02-17 | 13F | CWM Advisors, LLC | 33.275 | -42,27 | 474 | 4,19 | ||||
| 2026-02-17 | 13F | Polar Asset Management Partners Inc. | 243.000 | 3.460 | ||||||
| 2026-02-17 | 13F | Qube Research & Technologies Ltd | 4.434.679 | 153,47 | 63.150 | 358,07 | ||||
| 2025-09-29 | NP | PRFZ - Invesco FTSE RAFI US 1500 Small-Mid ETF This fund is a listed as child fund of Invesco Ltd. and if that institution has disclosed ownership in this security, then these positions will not be double counted when calculating total shares and total value | 175.475 | 105,35 | 1.051 | 60,21 | ||||
| 2026-02-12 | 13F | Brown Brothers Harriman & Co | 473 | 7 | ||||||
| 2025-11-13 | 13F | Barrow Hanley Mewhinney & Strauss Llc | 0 | -100,00 | 0 | |||||
| 2026-02-17 | 13F | Tower Research Capital LLC (TRC) | 2.363 | -81,24 | 34 | -66,67 | ||||
| 2026-02-13 | 13F | Stifel Financial Corp | 11.859 | -81,21 | 169 | -66,20 | ||||
| 2026-01-29 | 13F | China Universal Asset Management Co., Ltd. | 50.275 | -6,95 | 716 | 68,24 | ||||
| 2026-02-12 | 13F | Nuveen, LLC | 4.628.225 | 0,13 | 65.906 | 80,94 | ||||
| 2026-02-17 | 13F | Price T Rowe Associates Inc /md/ | 281.842 | -73,31 | 4 | -50,00 | ||||
| 2026-02-10 | 13F | Globeflex Capital L P | 86.878 | 1.237 | ||||||
| 2026-02-17 | 13F | One68 Global Capital, LLC | 30.000 | 427 | ||||||
| 2025-11-14 | 13F | Hrt Financial Lp | 0 | -100,00 | 0 | |||||
| 2026-01-07 | 13F | Massmutual Trust Co Fsb/adv | 453 | 0,00 | 6 | 100,00 | ||||
| 2026-02-06 | 13F | Profund Advisors Llc | 183.552 | 120,52 | 2.614 | 298,93 | ||||
| 2026-02-17 | 13F | MIRAE ASSET GLOBAL ETFS HOLDINGS Ltd. | 167.243 | 12,45 | 2.382 | 102,98 | ||||
| 2026-02-23 | 13F | Virtu Financial LLC | 117.063 | 177,66 | 2 | |||||
| 2026-02-02 | 13F | Fifth Third Bancorp | 0 | -100,00 | 0 | |||||
| 2026-02-17 | 13F | Torno Capital, Llc | Call | 0 | -100,00 | 0 | ||||
| 2026-02-17 | 13F | Vazirani Asset Management LLC | 25.000 | 356 | ||||||
| 2026-02-17 | 13F | Dark Forest Capital Management Lp | 140.300 | 1.998 | ||||||
| 2026-02-17 | 13F | Torno Capital, Llc | Put | 0 | -100,00 | 0 | ||||
| 2026-02-06 | 13F | Handelsbanken Fonder AB | 107.541 | 22,99 | 2 | |||||
| 2026-02-09 | 13F | Quest Partners LLC | 142.501 | 30,89 | 2.029 | 136,76 | ||||
| 2026-02-06 | 13F | ProShare Advisors LLC | 89.824 | 53,30 | 1.279 | 177,44 | ||||
| 2025-09-29 | NP | BBP - Virtus LifeSci Biotech Products ETF | 72.025 | 78,08 | 431 | 39,03 | ||||
| 2026-02-13 | 13F | Rice Hall James & Associates, Llc | 3.509.571 | 2,18 | 49.976 | 84,65 | ||||
| 2026-02-17 | 13F | Vestal Point Capital, LP | 0 | -100,00 | 0 | |||||
| 2026-01-15 | 13F | Nisa Investment Advisors, Llc | 2.887 | 0,00 | 41 | 86,36 |