Basisstatistiken
| Institutionelle Eigentümer | 113 total, 113 long only, 0 short only, 0 long/short - change of 0,00% MRQ |
| Durchschnittliche Portfolioallokation | 0.8082 % - change of 12,07% MRQ |
| Institutionelle Aktien (Long) | 26.446.133 (ex 13D/G) - change of -0,48MM shares -10,76% MRQ |
| Institutioneller Wert (Long) | $ 420.540 USD ($1000) |
Institutioneller Eigentümerschaft und Aktionäre
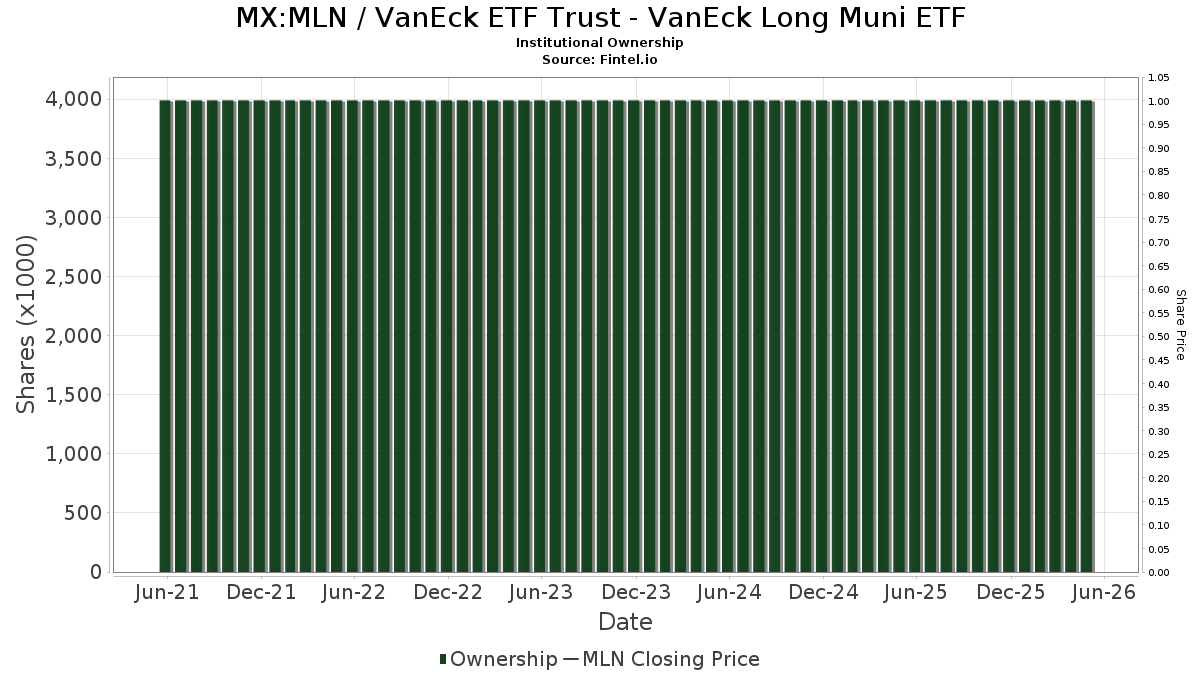
VanEck ETF Trust - VanEck Long Muni ETF (MX:MLN) hat 113 institutionelle Eigentümer und Aktionäre, die 13D/G oder 13F Formulare bei der Securities Exchange Commission (SEC) eingereicht haben. Diese Institutionen halten insgesamt 26,446,133 Aktien. Die größten Aktionäre sind Envestnet Asset Management Inc, Bank Of America Corp /de/, Raymond James Financial Inc, Jane Street Group, Llc, Kestra Investment Management, LLC, Bank of New York Mellon Corp, HighTower Advisors, LLC, LPL Financial LLC, Morgan Stanley, and Manhattan West Asset Management, LLC .
VanEck ETF Trust - VanEck Long Muni ETF (BMV:MLN) Die institutionelle Eigentümerstruktur zeigt die aktuellen Positionen von Institutionen und Fonds im Unternehmen sowie die jüngsten Veränderungen der Positionsgröße. Zu den Großaktionären können Einzelanleger, Investmentfonds, Hedgefonds oder Institutionen gehören. Der Schedule 13D zeigt an, dass der Investor mehr als 5% des Unternehmens hält (oder gehalten hat) und beabsichtigt (oder beabsichtigt hat), aktiv eine Änderung der Geschäftsstrategie zu verfolgen. Schedule 13G zeigt eine passive Investition von über 5% an.
Fondsstimmung-Score
Der Fondsstimmung-Score (auch bekannt als Eigentümer-Akkumulations-Score) ermittelt die Aktien, die am meisten von Fonds gekauft werden. Er ist das Ergebnis eines ausgeklügelten quantitativen Multifaktormodells, das die Unternehmen mit den höchsten institutionellen Käufen identifiziert. Das Scoring-Modell verwendet eine Kombination aus der Gesamtzunahme der offengelegten Eigentümer, den Änderungen der Portfolioallokationen in diesen Eigentümern und anderen Metriken. Die Zahl reicht von 0 bis 100, wobei höhere Zahlen ein höheres Maß an Kapitalakkumulation als bei anderen Unternehmen anzeigen und 50 den Durchschnitt darstellt.
Aktualisierungshäufigkeit: Täglich
Siehe Ownership Explorer, der eine Liste der am höchsten bewerteten Unternehmen enthält.
13F und NPORT Einreichungen
Details zu 13F-Einreichungen sind kostenlos. Für Details zu NP-Einreichungen ist eine Premium-Mitgliedschaft erforderlich. Grüne Zeilen zeigen neue Positionen an. Rote Zeilen zeigen geschlossene Positionen an. Klicken Sie auf das Link Symbol, um den gesamten Transaktionsverlauf zu sehen.
Upgrade
um Prämiendaten freizuschalten und nach Excel zu exportieren ![]() .
.
| Datei Datum | Quelle | Anleger | Typ | Durchschnittlicher Preis (Est) |
Aktien | Δ Aktien (%) |
Gemeldeter Wert ($1000) |
Δ Wert (%) |
Port Alloc (%) |
|
|---|---|---|---|---|---|---|---|---|---|---|
| 2025-07-21 | 13F | Cliftonlarsonallen Wealth Advisors, Llc | 420.049 | 220,43 | 7.095 | 211,28 | ||||
| 2025-08-08 | 13F | Tortoise Investment Management, LLC | 502.283 | 72,53 | 8.484 | 67,58 | ||||
| 2025-07-23 | 13F | Prime Capital Investment Advisors, LLC | 0 | -100,00 | 0 | |||||
| 2025-07-31 | 13F | West Michigan Advisors, Llc | 14.815 | -39,81 | 250 | -41,59 | ||||
| 2025-08-05 | 13F | NewSquare Capital LLC | 4.115 | -47,85 | 70 | -49,64 | ||||
| 2025-08-12 | 13F | Global Retirement Partners, LLC | 788 | 0,00 | 13 | -7,14 | ||||
| 2025-08-12 | 13F | Jpmorgan Chase & Co | 415.844 | 2.657,40 | 7.024 | 2.580,53 | ||||
| 2025-08-13 | 13F | Jones Financial Companies Lllp | 96.092 | 38,05 | 1.618 | 34,19 | ||||
| 2025-08-12 | 13F | Steward Partners Investment Advisory, Llc | 6.595 | 111 | ||||||
| 2025-08-07 | 13F | Allworth Financial LP | 42.474 | 98,01 | 717 | 98,07 | ||||
| 2025-08-14 | 13F | Peapack Gladstone Financial Corp | 0 | -100,00 | 0 | |||||
| 2025-08-08 | 13F | Ogorek Anthony Joseph /ny/ /adv | 114.643 | -39,49 | 2 | -66,67 | ||||
| 2025-08-18 | 13F/A | Kestra Investment Management, LLC | 1.586.659 | -1,57 | 26.799 | -4,40 | ||||
| 2025-08-11 | 13F | Aptus Capital Advisors, LLC | 1.166 | 0,00 | 20 | -5,00 | ||||
| 2025-08-12 | 13F | Change Path, LLC | 44.676 | -26,75 | 755 | -28,87 | ||||
| 2025-07-14 | 13F | Park Avenue Securities Llc | 143.453 | 2 | ||||||
| 2025-08-14 | 13F | UBS Group AG | 7.062 | -95,77 | 119 | -95,90 | ||||
| 2025-07-30 | 13F | VCI Wealth Management LLC | 23.645 | 3,34 | 399 | 0,50 | ||||
| 2025-07-28 | 13F | Harbour Investments, Inc. | 2.165 | -21,64 | 37 | -25,00 | ||||
| 2025-08-13 | 13F | Cresset Asset Management, LLC | 21.000 | 0,00 | 355 | -3,01 | ||||
| 2025-07-07 | 13F | RDA Financial Network | 11.374 | 192 | ||||||
| 2025-08-05 | 13F | Fourth Dimension Wealth, LLC | 32.037 | 1,41 | 541 | -1,46 | ||||
| 2025-08-07 | 13F | Hennion & Walsh Asset Management, Inc. | 511.844 | -2,05 | 8.645 | -4,86 | ||||
| 2025-08-14 | 13F | Stifel Financial Corp | 428.920 | -12,28 | 7.244 | -14,80 | ||||
| 2025-08-11 | 13F | Pineridge Advisors LLC | 201.456 | 0,55 | 3.403 | -2,35 | ||||
| 2025-07-22 | 13F | White & Co Financial Planning Inc | 92.746 | -3,22 | 1.561 | -5,91 | ||||
| 2025-07-29 | 13F | Stephens Inc /ar/ | 21.503 | 2,94 | 363 | 0,00 | ||||
| 2025-08-13 | 13F | Flow Traders U.s. Llc | 34.513 | -14,56 | 1 | |||||
| 2025-08-08 | 13F | Cetera Investment Advisers | 194.521 | 261,50 | 3.285 | 251,34 | ||||
| 2025-08-07 | 13F | Resources Investment Advisors, LLC. | 213.457 | 0,60 | 3.605 | -2,30 | ||||
| 2025-08-15 | 13F | Manhattan West Asset Management, LLC | 710.167 | -8,95 | 11.995 | -11,57 | ||||
| 2025-07-24 | 13F | Jfs Wealth Advisors, Llc | 0 | -100,00 | 0 | |||||
| 2025-08-12 | 13F | MAI Capital Management | 0 | -100,00 | 0 | |||||
| 2025-07-09 | 13F | Bowman & Co S.C. | 75.354 | 1.273 | ||||||
| 2025-08-13 | 13F | Keystone Financial Group | 295.297 | 10,85 | 4.973 | 9,39 | ||||
| 2025-07-25 | 13F | Concurrent Investment Advisors, LLC | 18.977 | 75,96 | 321 | 71,12 | ||||
| 2025-08-12 | 13F | PKS Advisory Services, LLC | 16.300 | 22,56 | 275 | 19,05 | ||||
| 2025-08-14 | 13F | Mml Investors Services, Llc | 224.250 | 4 | ||||||
| 2025-08-14 | 13F | Wiley Bros.-aintree Capital, Llc | 10.519 | -51,11 | 178 | -52,42 | ||||
| 2025-05-02 | 13F | Transcendent Capital Group LLC | 0 | -100,00 | 0 | |||||
| 2025-07-07 | 13F | Versant Capital Management, Inc | 16.786 | 150,69 | 284 | 143,97 | ||||
| 2025-07-17 | 13F | Keystone Global Partners, LLC | 43 | 1 | ||||||
| 2025-07-08 | 13F | Richard P Slaughter Associates Inc | 49.342 | 833 | ||||||
| 2025-08-14 | 13F | Raymond James Financial Inc | 1.978.134 | -36,05 | 33.411 | -37,89 | ||||
| 2025-07-30 | 13F | Avidian Wealth Solutions, LLC | 0 | -100,00 | 0 | |||||
| 2025-08-13 | 13F | Green Harvest Asset Management LLC | 0 | -100,00 | 0 | |||||
| 2025-04-14 | 13F | Farther Finance Advisors, LLC | 0 | -100,00 | 0 | |||||
| 2025-08-14 | 13F | Wells Fargo & Company/mn | 184.027 | 5,94 | 3.108 | 2,91 | ||||
| 2025-07-29 | 13F | Private Trust Co Na | 0 | -100,00 | 0 | |||||
| 2025-04-24 | 13F | Legacy CG, LLC | 0 | -100,00 | 0 | -100,00 | ||||
| 2025-08-11 | 13F | Brown Brothers Harriman & Co | 973 | 0,00 | 16 | 0,00 | ||||
| 2025-08-12 | 13F | Proequities, Inc. | 0 | 0 | ||||||
| 2025-08-08 | 13F | Hedeker Wealth, LLC | 76.042 | -9,79 | 1.284 | -12,35 | ||||
| 2025-08-14 | 13F | Bank Of America Corp /de/ | 2.849.992 | 17,21 | 48.136 | 13,84 | ||||
| 2025-08-14 | 13F | Benjamin Edwards Inc | 211.338 | 7,39 | 3.570 | 4,30 | ||||
| 2025-08-14 | 13F | Warren Averett Asset Management, LLC | 88.448 | 1.494 | ||||||
| 2025-07-01 | 13F | Confluence Investment Management Llc | 250.578 | -0,50 | 4.232 | -3,36 | ||||
| 2025-07-10 | 13F | Global Financial Private Client, LLC | 0 | -100,00 | 0 | |||||
| 2025-08-14 | 13F | GWM Advisors LLC | 25.218 | -31,92 | 426 | -34,01 | ||||
| 2025-07-09 | 13F | FOCUS Wealth Advisors, LLC | 54.628 | 2,66 | 923 | -0,32 | ||||
| 2025-07-28 | 13F | Elmwood Wealth Management, Inc. | 176.628 | 0,52 | 2.983 | -2,36 | ||||
| 2025-08-12 | 13F | BlackRock, Inc. | 8.056 | 136 | ||||||
| 2025-08-04 | 13F | Haven Private, LLC | 0 | -100,00 | 0 | |||||
| 2025-08-13 | 13F | Capital Advisors Wealth Management, LLC | 70.561 | -32,26 | 1.192 | -34,24 | ||||
| 2025-08-08 | 13F | Emerald Investment Partners, Llc | 191 | -37,79 | 3 | -40,00 | ||||
| 2025-08-13 | 13F | Rsm Us Wealth Management Llc | 13.900 | 0,00 | 235 | -2,90 | ||||
| 2025-08-12 | 13F | Argent Trust Co | 11.904 | 201 | ||||||
| 2025-07-18 | 13F | Truist Financial Corp | 48.030 | -2,33 | 811 | -5,15 | ||||
| 2025-07-16 | 13F | Magnus Financial Group LLC | 16.499 | 279 | ||||||
| 2025-04-28 | 13F | Strategic Financial Concepts, LLC | 0 | -100,00 | 0 | -100,00 | ||||
| 2025-07-16 | 13F/A | CX Institutional | 359.532 | -23,88 | 6 | -25,00 | ||||
| 2025-08-14 | 13F | Jane Street Group, Llc | 1.863.224 | 290,99 | 31.470 | 279,74 | ||||
| 2025-08-19 | 13F | Advisory Services Network, LLC | 21.178 | 352 | ||||||
| 2025-08-04 | 13F | Pensionmark Financial Group, Llc | 0 | -100,00 | 0 | |||||
| 2025-08-13 | 13F | Congress Wealth Management LLC / DE / | 10.577 | 0,00 | 179 | -2,73 | ||||
| 2025-08-21 | 13F | Aveo Capital Partners, LLC | 0 | -100,00 | 0 | |||||
| 2025-07-17 | 13F | Janney Montgomery Scott LLC | 527.867 | 25,18 | 9 | 14,29 | ||||
| 2025-08-13 | 13F | Balance Wealth, LLC | 21.660 | 42,12 | 366 | 37,74 | ||||
| 2025-08-08 | 13F | Meridian Wealth Management, LLC | 13.656 | -50,50 | 231 | -51,98 | ||||
| 2025-05-06 | 13F | MY Wealth Management Inc. | 0 | -100,00 | 0 | |||||
| 2025-05-15 | 13F | Two Sigma Securities, Llc | 0 | -100,00 | 0 | |||||
| 2025-08-08 | 13F | Avantax Advisory Services, Inc. | 0 | -100,00 | 0 | |||||
| 2025-07-14 | 13F | GAMMA Investing LLC | 5.490 | -86,85 | 93 | -87,33 | ||||
| 2025-07-31 | 13F | CAP Partners, LLC | 24.261 | 3,21 | 410 | 0,25 | ||||
| 2025-08-14 | 13F | Van Eck Associates Corp | 0 | -100,00 | 0 | |||||
| 2025-08-14 | 13F | Royal Bank Of Canada | 134.002 | -2,20 | 2.263 | -5,04 | ||||
| 2025-07-18 | 13F | Bartlett & Co. Wealth Management Llc | 87.850 | -16,17 | 1.484 | -18,61 | ||||
| 2025-07-24 | 13F | Eastern Bank | 1.522 | 0,00 | 26 | -3,85 | ||||
| 2025-08-12 | 13F | LPL Financial LLC | 846.842 | 225,42 | 14.303 | 216,09 | ||||
| 2025-08-07 | 13F | Parkside Financial Bank & Trust | 2.668 | 0,98 | 45 | 0,00 | ||||
| 2025-08-04 | 13F | Keybank National Association/oh | 15.994 | 270 | ||||||
| 2025-04-30 | 13F | AlphaStar Capital Management, LLC | 0 | -100,00 | 0 | -100,00 | ||||
| 2025-08-14 | 13F/A | Rockefeller Capital Management L.P. | 37.353 | 631 | ||||||
| 2025-07-30 | 13F | Rehmann Capital Advisory Group | 14.200 | -0,64 | 240 | -3,63 | ||||
| 2025-07-24 | 13F | IFP Advisors, Inc | 34.088 | 17,08 | 576 | 13,64 | ||||
| 2025-08-05 | 13F | Westside Investment Management, Inc. | 127.613 | 36,73 | 2.155 | 32,78 | ||||
| 2025-08-13 | 13F | Townsquare Capital Llc | 0 | -100,00 | 0 | |||||
| 2025-08-11 | 13F | Private Advisor Group, LLC | 33.401 | 0,98 | 564 | -1,91 | ||||
| 2025-08-13 | 13F | Willis Johnson & Associates, Inc. | 499.315 | -3,72 | 8.433 | -6,49 | ||||
| 2025-08-14 | 13F | Hrt Financial Lp | 0 | -100,00 | 0 | |||||
| 2025-08-13 | 13F | Colonial Trust Co / SC | 8.431 | 73,33 | 142 | 67,86 | ||||
| 2025-07-29 | 13F | Foster & Motley Inc | 21.172 | 0,00 | 0 | |||||
| 2025-08-01 | 13F | Envestnet Asset Management Inc | 2.998.986 | 146,44 | 50.653 | 139,36 | ||||
| 2025-08-14 | 13F | Ameriprise Financial Inc | 173.364 | 4,92 | 2.927 | 1,84 | ||||
| 2025-08-13 | 13F | Baker Avenue Asset Management, LP | 45.540 | -0,72 | 769 | -3,51 | ||||
| 2025-08-11 | 13F | Elequin Capital Lp | 0 | -100,00 | 0 | |||||
| 2025-08-15 | 13F | Morgan Stanley | 840.846 | -50,77 | 14.202 | -52,18 | ||||
| 2025-05-05 | 13F | Csenge Advisory Group | 0 | -100,00 | 0 | -100,00 | ||||
| 2025-07-25 | 13F | Envestnet Portfolio Solutions, Inc. | 31.444 | 531 | ||||||
| 2025-08-08 | 13F | CFO4Life Group, LLC | 35.830 | -13,93 | 605 | -16,32 | ||||
| 2025-07-15 | 13F | McAdam, LLC | 61.391 | -9,51 | 1.037 | -12,13 | ||||
| 2025-08-15 | 13F | Kestra Advisory Services, LLC | 80.663 | 26,68 | 1.362 | 23,04 | ||||
| 2025-08-11 | 13F | NewEdge Wealth, LLC | 199.324 | -0,94 | 3.349 | -4,32 | ||||
| 2025-07-16 | 13F | Evergreen Private Wealth LLC | 166.991 | 28,59 | 2.820 | 24,89 | ||||
| 2025-08-06 | 13F | Commonwealth Equity Services, Llc | 116.627 | -40,02 | 2 | -66,67 | ||||
| 2025-07-30 | 13F | LGT Financial Advisors LLC | 1.022 | 17 | ||||||
| 2025-08-14 | 13F | Susquehanna International Group, Llp | 19.875 | 336 | ||||||
| 2025-07-25 | 13F | Cwm, Llc | 1.523 | 0,93 | 0 | |||||
| 2025-08-14 | 13F | Citadel Advisors Llc | Call | 23.400 | -39,06 | 395 | -40,78 | |||
| 2025-08-14 | 13F | Citadel Advisors Llc | 33.846 | 95,56 | 572 | 90,33 | ||||
| 2025-08-08 | 13F | Pnc Financial Services Group, Inc. | 1.555 | -23,55 | 26 | -25,71 | ||||
| 2025-08-06 | 13F | AE Wealth Management LLC | 148.673 | 5,80 | 2.511 | 2,78 | ||||
| 2025-08-14 | 13F | Bnp Paribas Arbitrage, Sa | 12 | 0 | ||||||
| 2025-04-21 | 13F | Nelson, Van Denburg & Campbell Wealth Management Group, LLC | 0 | -100,00 | 0 | |||||
| 2025-08-14 | 13F | Comerica Bank | 1.260 | 21 | ||||||
| 2025-08-05 | 13F | Bank of New York Mellon Corp | 1.540.372 | -42,52 | 26.017 | -44,18 | ||||
| 2025-07-14 | 13F | ABLE Financial Group, LLC | 292.847 | -26,19 | 4.946 | -28,31 | ||||
| 2025-08-05 | 13F | Code Waechter LLC | 24.423 | 0,00 | 413 | |||||
| 2025-08-14 | 13F | Citadel Advisors Llc | Put | 0 | -100,00 | 0 | ||||
| 2025-08-14 | 13F | Ausdal Financial Partners, Inc. | 24.159 | -16,43 | 408 | -18,73 | ||||
| 2025-08-14 | 13F | Fmr Llc | 1.961 | 22,95 | 33 | 22,22 | ||||
| 2025-04-30 | 13F | Synergy Investment Management, LLC | 0 | -100,00 | 0 | |||||
| 2025-07-17 | 13F | Park Place Capital Corp | 2.404 | 40 | ||||||
| 2025-08-14 | 13F | Financial Network Wealth Advisors LLC | 256 | 0,00 | 4 | 0,00 | ||||
| 2025-08-13 | 13F | Advisor Group Holdings, Inc. | 18.163 | 10,23 | 323 | 12,59 | ||||
| 2025-08-05 | 13F | EPG Wealth Management LLC | 193 | 0,00 | 3 | 0,00 | ||||
| 2025-08-14 | 13F | Diversify Advisory Services, LLC | 12.441 | 209 | ||||||
| 2025-08-07 | 13F | Kestra Private Wealth Services, Llc | 12.331 | -14,69 | 208 | -17,13 | ||||
| 2025-07-24 | 13F | Cyndeo Wealth Partners, LLC | 353.246 | -5,97 | 5.966 | -8,67 | ||||
| 2025-08-11 | 13F | Rothschild Investment Llc | 45 | 0,00 | 1 | |||||
| 2025-08-11 | 13F | HighTower Advisors, LLC | 1.497.812 | -6,42 | 25.298 | -9,10 | ||||
| 2025-08-14 | 13F | MidWestOne Financial Group, Inc. | 322.735 | 74,92 | 5.451 | 69,89 | ||||
| 2025-05-09 | 13F | GeoWealth Management, LLC | 0 | -100,00 | 0 | |||||
| 2025-04-28 | 13F | Financial Advocates Investment Management | 0 | -100,00 | 0 |
Other Listings
| US:MLN | 16,86 $ |