Basisstatistiken
| Institutionelle Eigentümer | 87 total, 87 long only, 0 short only, 0 long/short - change of 0,00% MRQ |
| Durchschnittliche Portfolioallokation | 0.0901 % - change of -5,09% MRQ |
| Institutionelle Aktien (Long) | 16.275.456 (ex 13D/G) - change of -0,14MM shares -7,83% MRQ |
| Institutioneller Wert (Long) | $ 172.186 USD ($1000) |
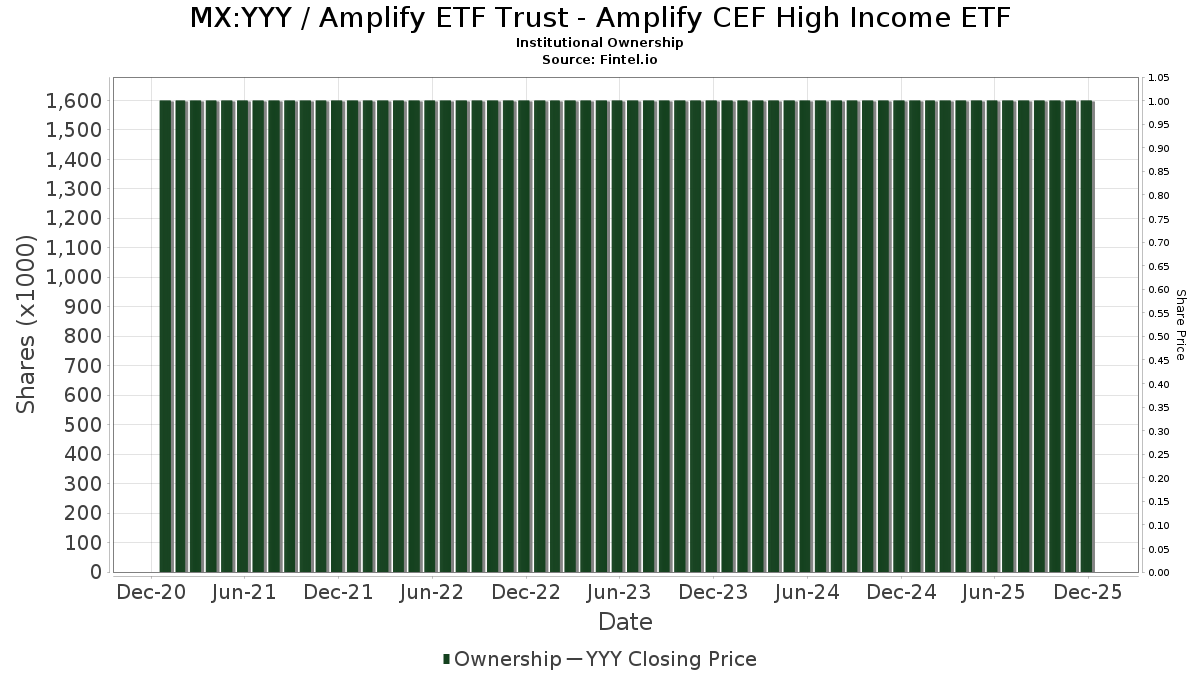
Institutioneller Eigentümerschaft und Aktionäre
Amplify ETF Trust - Amplify CEF High Income ETF (MX:YYY) hat 87 institutionelle Eigentümer und Aktionäre, die 13D/G oder 13F Formulare bei der Securities Exchange Commission (SEC) eingereicht haben. Diese Institutionen halten insgesamt 16,275,456 Aktien. Die größten Aktionäre sind Morgan Stanley, LPL Financial LLC, LJI Wealth Management, LLC, Advisor Group Holdings, Inc., Cambridge Investment Research Advisors, Inc., NWF Advisory Services Inc., Thrive Capital Management, LLC, Raymond James Financial Inc, Wells Fargo & Company/mn, and Intrua Financial, LLC .
Amplify ETF Trust - Amplify CEF High Income ETF (BMV:YYY) Die institutionelle Eigentümerstruktur zeigt die aktuellen Positionen von Institutionen und Fonds im Unternehmen sowie die jüngsten Veränderungen der Positionsgröße. Zu den Großaktionären können Einzelanleger, Investmentfonds, Hedgefonds oder Institutionen gehören. Der Schedule 13D zeigt an, dass der Investor mehr als 5% des Unternehmens hält (oder gehalten hat) und beabsichtigt (oder beabsichtigt hat), aktiv eine Änderung der Geschäftsstrategie zu verfolgen. Schedule 13G zeigt eine passive Investition von über 5% an.
Fondsstimmung-Score
Der Fondsstimmung-Score (auch bekannt als Eigentümer-Akkumulations-Score) ermittelt die Aktien, die am meisten von Fonds gekauft werden. Er ist das Ergebnis eines ausgeklügelten quantitativen Multifaktormodells, das die Unternehmen mit den höchsten institutionellen Käufen identifiziert. Das Scoring-Modell verwendet eine Kombination aus der Gesamtzunahme der offengelegten Eigentümer, den Änderungen der Portfolioallokationen in diesen Eigentümern und anderen Metriken. Die Zahl reicht von 0 bis 100, wobei höhere Zahlen ein höheres Maß an Kapitalakkumulation als bei anderen Unternehmen anzeigen und 50 den Durchschnitt darstellt.
Aktualisierungshäufigkeit: Täglich
Siehe Ownership Explorer, der eine Liste der am höchsten bewerteten Unternehmen enthält.
AI+ Ask Fintel’s AI assistant about Amplify ETF Trust - Amplify CEF High Income ETF.
Select a question to share a public post with an AI-crafted answer.
Thinking of good questions…
13F und NPORT Einreichungen
Details zu 13F-Einreichungen sind kostenlos. Für Details zu NP-Einreichungen ist eine Premium-Mitgliedschaft erforderlich. Grüne Zeilen zeigen neue Positionen an. Rote Zeilen zeigen geschlossene Positionen an. Klicken Sie auf das Link Symbol, um den gesamten Transaktionsverlauf zu sehen.
Upgrade
um Prämiendaten freizuschalten und nach Excel zu exportieren ![]() .
.
| Datei Datum | Quelle | Anleger | Typ | Durchschnittlicher Preis (Est) |
Aktien | Δ Aktien (%) |
Gemeldeter Wert ($1000) |
Δ Wert (%) |
Port Alloc (%) |
|
|---|---|---|---|---|---|---|---|---|---|---|
| 2025-11-10 | 13F | Anchor Capital Management Group Inc | 0 | -100,00 | 0 | |||||
| 2026-02-03 | 13F | International Assets Investment Management, Llc | 355.081 | 13,47 | 4.087 | 10,58 | ||||
| 2026-02-26 | 13F/A | Alpine Global Management, LLC | 12.542 | 144 | ||||||
| 2026-02-17 | 13F | Ameriprise Financial Inc | 58.239 | 670 | ||||||
| 2026-02-17 | 13F | LaSalle St. Investment Advisors, LLC | 10.000 | 0,00 | 0 | |||||
| 2026-02-05 | 13F | Intrua Financial, LLC | 387.793 | 2,60 | 4.464 | 0,00 | ||||
| 2026-02-13 | 13F | Ausdal Financial Partners, Inc. | 92.227 | 0,49 | 1.062 | -2,03 | ||||
| 2026-02-13 | 13F | Navis Wealth Advisors, LLC | 42.052 | 484 | ||||||
| 2026-02-13 | 13F | Centaurus Financial, Inc. | 17.055 | 0,48 | 0 | |||||
| 2026-02-13 | 13F | Kestra Advisory Services, LLC | 0 | -100,00 | 0 | |||||
| 2026-02-13 | 13F | Golden State Wealth Management, LLC | 15.894 | -4,32 | 183 | -7,14 | ||||
| 2026-02-09 | 13F | Valtinson Bruner Financial Planning LLC | 13.140 | -2,74 | 151 | -5,03 | ||||
| 2026-02-06 | 13F | Ignite Planners, LLC | 55.447 | 2,94 | 646 | 1,42 | ||||
| 2026-02-18 | 13F | GWM Advisors LLC | 0 | -100,00 | 0 | |||||
| 2026-02-11 | 13F | LPL Financial LLC | 2.846.681 | 3,62 | 32.765 | 0,98 | ||||
| 2026-02-12 | 13F | Commonwealth Equity Services, Llc | 122.629 | 24,11 | 1.411 | 141.000,00 | ||||
| 2026-02-13 | 13F | MAI Capital Management | 14.352 | 36,04 | 165 | 33,06 | ||||
| 2026-02-17 | 13F | Advisor Group Holdings, Inc. | 1.052.382 | 9,59 | 12.113 | 6,99 | ||||
| 2026-02-09 | 13F | Integrity Alliance, Llc. | 10.428 | -3,21 | 120 | -5,51 | ||||
| 2025-10-21 | 13F | Optimum Investment Advisors | 4.150 | -6,74 | 49 | -5,77 | ||||
| 2026-02-12 | 13F | Triumph Capital Management | 7.927 | -11,20 | 91 | -13,33 | ||||
| 2026-02-12 | 13F | Jane Street Group, Llc | 76.514 | 881 | ||||||
| 2025-11-06 | 13F | Westbourne Investments, Inc. | 0 | -100,00 | 0 | |||||
| 2026-02-10 | 13F | Continuum Advisory, LLC | 10.605 | 0,00 | 122 | -2,40 | ||||
| 2026-02-17 | 13F | WFA of San Diego, LLC | 0 | -100,00 | 0 | |||||
| 2026-02-11 | 13F | Janney Montgomery Scott LLC | 22.626 | -0,73 | 0 | |||||
| 2025-11-26 | 13F/A | Jpmorgan Chase & Co | 1.447 | 141,17 | 17 | 142,86 | ||||
| 2026-01-16 | 13F | Ronald Blue Trust, Inc. | 100 | 0,00 | 1 | 0,00 | ||||
| 2026-02-09 | 13F | Thrive Capital Management, LLC | 495.555 | 4,71 | 5.704 | 2,04 | ||||
| 2026-02-17 | 13F | Royal Bank Of Canada | 16.637 | -7,91 | 191 | -10,33 | ||||
| 2025-11-14 | 13F | Citadel Advisors Llc | Put | 0 | -100,00 | 0 | ||||
| 2026-01-29 | 13F | Kestra Private Wealth Services, Llc | 20.217 | 1,52 | 233 | -1,28 | ||||
| 2026-02-11 | 13F | Winnow Wealth Llc | 1 | -99,98 | 0 | -100,00 | ||||
| 2026-02-17 | 13F | Susquehanna International Group, Llp | 70.036 | 806 | ||||||
| 2026-02-05 | 13F | AlphaCore Capital LLC | 2.100 | 0,00 | 24 | 0,00 | ||||
| 2026-02-17 | 13F | Bank Of America Corp /de/ | 5.183 | -53,99 | 60 | -55,64 | ||||
| 2026-02-12 | 13F | Wedbush Securities Inc | 241.728 | 5,55 | 3 | 0,00 | ||||
| 2026-02-03 | 13F | LJI Wealth Management, LLC | 1.710.583 | 14,13 | 19.689 | 11,23 | ||||
| 2026-03-03 | 13F | NWF Advisory Services Inc. | 650.045 | 6,46 | 7.482 | 3,76 | ||||
| 2026-02-09 | 13F | Claudia M.p. Batlle, Crp (r) Llc | 32.057 | -39,39 | 369 | -41,03 | ||||
| 2026-01-21 | 13F | Flagship Harbor Advisors, Llc | 800 | 9 | ||||||
| 2026-02-06 | 13F | HighTower Advisors, LLC | 123.596 | 0,86 | 1.423 | -1,73 | ||||
| 2026-02-03 | 13F | SBI Securities Co., Ltd. | 33.323 | -18,71 | 384 | -20,87 | ||||
| 2026-01-21 | 13F | Capital Investment Advisory Services, LLC | 330 | 0,00 | 4 | 0,00 | ||||
| 2026-02-05 | 13F | Soltis Investment Advisors LLC | 20.073 | 0,00 | 231 | -2,53 | ||||
| 2026-02-06 | 13F | IFP Advisors, Inc | 2.315 | 0,00 | 27 | -3,70 | ||||
| 2026-02-10 | 13F | Founders Financial Securities Llc | 35.735 | -4,40 | 411 | -6,80 | ||||
| 2026-01-26 | 13F | AE Wealth Management LLC | 425 | 0,00 | 5 | -20,00 | ||||
| 2026-02-13 | 13F | Change Path, LLC | 113.549 | 20,76 | 1.307 | 17,66 | ||||
| 2026-03-24 | 13F | Armis Advisers, LLC | 44.252 | 14,71 | 488 | 7,98 | ||||
| 2026-01-26 | 13F | Independent Wealth Network Inc. | 178.945 | -0,56 | 2.060 | -3,11 | ||||
| 2026-02-06 | 13F | Larson Financial Group LLC | 206.868 | 8,86 | 2.381 | 6,11 | ||||
| 2026-02-13 | 13F | Financial Network Wealth Advisors LLC | 54 | 3,85 | 1 | |||||
| 2026-02-13 | 13F | Asset Allocation Strategies LLC | 0 | -100,00 | 0 | |||||
| 2026-02-04 | 13F | Atlantic Union Bankshares Corp | 1.400 | 0,00 | 16 | 0,00 | ||||
| 2026-01-30 | 13F | Samalin Investment Counsel, LLC | 19.418 | 88,16 | 223 | 84,30 | ||||
| 2026-02-02 | 13F | Oppenheimer & Co Inc | 0 | -100,00 | 0 | |||||
| 2026-02-13 | 13F | Wells Fargo & Company/mn | 429.483 | 21.474.050,00 | 4.943 | |||||
| 2026-01-14 | 13F | TrueMark Investments, LLC | 19.017 | 219 | ||||||
| 2025-10-22 | 13F | Geneos Wealth Management Inc. | 0 | -100,00 | 0 | -100,00 | ||||
| 2026-02-17 | 13F | Jones Financial Companies Lllp | 0 | -100,00 | 0 | |||||
| 2026-01-09 | 13F | First Heartland Consultants, Inc. | 62.735 | 9,07 | 722 | 6,33 | ||||
| 2026-02-13 | 13F | Morgan Stanley | 3.648.956 | 35,82 | 41.999 | 32,37 | ||||
| 2025-11-14 | 13F | Eqis Capital Management, Inc. | 0 | -100,00 | 0 | |||||
| 2026-02-13 | 13F | Arkadios Wealth Advisors | 13.981 | 0,00 | 161 | -3,03 | ||||
| 2026-01-28 | 13F | Key Client Fiduciary Advisors, LLC | 0 | -100,00 | 0 | |||||
| 2026-01-26 | 13F | PFG Investments, LLC | 11.085 | 3,10 | 128 | 0,79 | ||||
| 2026-02-09 | 13F | Harbour Investments, Inc. | 16.142 | 15,71 | 186 | 12,80 | ||||
| 2026-02-10 | 13F | Tidemark, LLC | 14.609 | -8,34 | 168 | -10,64 | ||||
| 2026-02-12 | 13F | Brinker Capital Investments, LLC | 18.581 | 214 | ||||||
| 2026-02-12 | 13F | CIBC Private Wealth Group, LLC | 0 | -100,00 | 0 | |||||
| 2026-02-04 | 13F | Ameritas Advisory Services, LLC | 0 | -100,00 | 0 | |||||
| 2026-02-11 | 13F | Simplex Trading, Llc | 146 | 1.360,00 | 2 | |||||
| 2026-01-29 | 13F | Concurrent Investment Advisors, LLC | 14.994 | -2,31 | 173 | -4,97 | ||||
| 2026-02-09 | 13F | Strategic Financial Concepts, LLC | 0 | -100,00 | 0 | |||||
| 2026-02-04 | 13F | Certior Financial Group, Llc | 13.988 | -40,04 | 161 | -41,45 | ||||
| 2026-01-26 | 13F | Whittier Trust Co Of Nevada Inc | 3.000 | 0,00 | 35 | -2,86 | ||||
| 2026-02-13 | 13F | Motiv8 Investments LLC | 355 | 0 | ||||||
| 2026-02-11 | 13F | J.w. Cole Advisors, Inc. | 113.535 | -7,93 | 1.307 | -10,30 | ||||
| 2026-02-17 | 13F | Cetera Investment Advisers | 207.453 | 24,77 | 2.388 | 21,60 | ||||
| 2026-02-12 | 13F | Principal Securities, Inc. | 179.874 | 2,11 | 2.070 | -0,48 | ||||
| 2026-01-26 | 13F | Oxinas Partners Wealth Management LLC | 20.163 | 0,00 | 232 | -2,52 | ||||
| 2026-02-04 | 13F | Money Concepts Capital Corp | 23.289 | 11,96 | 268 | 9,39 | ||||
| 2025-10-07 | 13F | Thurston, Springer, Miller, Herd & Titak, Inc. | 0 | -100,00 | 0 | |||||
| 2026-02-05 | 13F | Allworth Financial LP | 1.000 | 0,00 | 12 | 0,00 | ||||
| 2026-01-29 | 13F | UBS Group AG | 571 | -89,62 | 7 | -90,62 | ||||
| 2026-02-17 | 13F | Private Advisor Group, LLC | 15.575 | 0,00 | 179 | -2,19 | ||||
| 2026-01-15 | 13F | Brookstone Capital Management | 67.957 | 3,04 | 782 | 0,51 | ||||
| 2026-02-04 | 13F | Pensionmark Financial Group, Llc | 156.056 | 107,76 | 1.796 | 102,37 | ||||
| 2026-04-06 | 13F | Highline Wealth Partners Llc | 250 | 0,00 | 3 | 0,00 | ||||
| 2026-02-05 | 13F | Cambridge Investment Research Advisors, Inc. | 1.019.913 | 9,87 | 12 | 10,00 | ||||
| 2026-02-17 | 13F | Regal Investment Advisors LLC | 17.036 | 196 | ||||||
| 2025-11-14 | 13F | Consultiva Wealth Management, Corp. | 0 | -100,00 | 0 | |||||
| 2026-02-13 | 13F | Mml Investors Services, Llc | 44.886 | -2,05 | 517 | -4,62 | ||||
| 2026-02-17 | 13F | Raymond James Financial Inc | 486.544 | 64,84 | 5.600 | 60,69 | ||||
| 2026-01-30 | 13F | Us Bancorp \de\ | 2.425 | 0,00 | 28 | -3,57 | ||||
| 2026-01-27 | 13F | TD Waterhouse Canada Inc. | 32.091 | 0,00 | 370 | -2,64 | ||||
| 2026-02-06 | 13F | Creative Financial Designs Inc /adv | 3.393 | 1,62 | 39 | 0,00 | ||||
| 2026-02-05 | 13F | Tucker Asset Management Llc | 225 | 3 | ||||||
| 2026-02-17 | 13F | Advisory Services Network, LLC | 13.961 | -7,55 | 161 | -10,11 | ||||
| 2026-04-07 | 13F | Farther Finance Advisors, LLC | 20.972 | 232 | ||||||
| 2026-01-21 | 13F | Sound Income Strategies, LLC | 100 | 0,00 | 1 | 0,00 | ||||
| 2026-01-29 | 13F | Comerica Bank | 11.006 | 119,37 | 127 | 113,56 | ||||
| 2026-02-10 | 13F | Envestnet Asset Management Inc | 315.573 | 19,11 | 3.632 | 16,11 | ||||
| 2026-02-12 | 13F | Founders Financial Alliance, LLC | 0 | -100,00 | 0 |
Other Listings
| US:YYY | 11,06 $ |