Basisstatistiken
| Institutionelle Eigentümer | 6 total, 6 long only, 0 short only, 0 long/short - change of 0,00% MRQ |
| Durchschnittliche Portfolioallokation | 1.2304 % - change of 6,83% MRQ |
| Institutionelle Aktien (Long) | 14.706.251 (ex 13D/G) - change of 1,84MM shares 14,27% MRQ |
| Institutioneller Wert (Long) | $ 344.123 USD ($1000) |
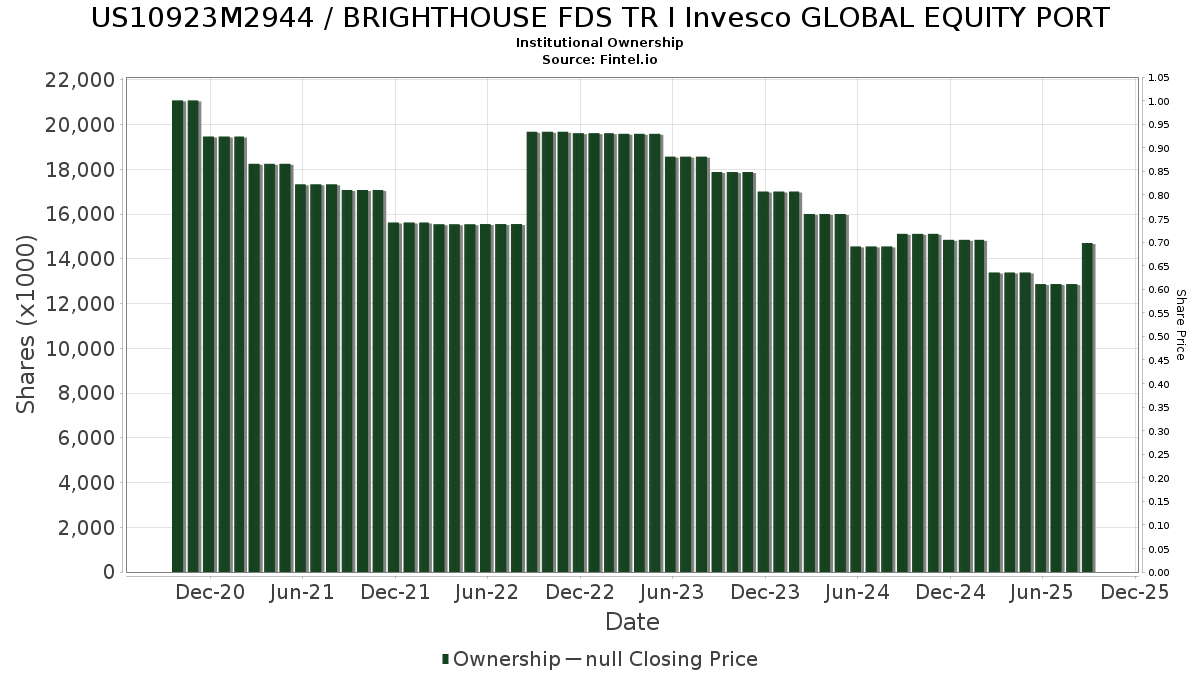
Institutioneller Eigentümerschaft und Aktionäre
BRIGHTHOUSE FDS TR I Invesco GLOBAL EQUITY PORT (US:US10923M2944) hat 6 institutionelle Eigentümer und Aktionäre, die 13D/G oder 13F Formulare bei der Securities Exchange Commission (SEC) eingereicht haben. Diese Institutionen halten insgesamt 14,706,251 Aktien. Die größten Aktionäre sind Brighthouse Funds Trust II - Brighthouse Asset Allocation 80 Portfolio Class A, Brighthouse Funds Trust II - Brighthouse Asset Allocation 60 Portfolio Class A, Brighthouse Funds Trust I - Brighthouse Balanced Plus Portfolio Class B, Brighthouse Funds Trust I - Brighthouse Asset Allocation 100 Portfolio Class A, Brighthouse Funds Trust II - Brighthouse Asset Allocation 40 Portfolio Class A, and Brighthouse Funds Trust II - Brighthouse Asset Allocation 20 Portfolio Class A .
BRIGHTHOUSE FDS TR I Invesco GLOBAL EQUITY PORT (US10923M2944) Die institutionelle Eigentümerstruktur zeigt die aktuellen Positionen von Institutionen und Fonds im Unternehmen sowie die jüngsten Veränderungen der Positionsgröße. Zu den Großaktionären können Einzelanleger, Investmentfonds, Hedgefonds oder Institutionen gehören. Der Schedule 13D zeigt an, dass der Investor mehr als 5% des Unternehmens hält (oder gehalten hat) und beabsichtigt (oder beabsichtigt hat), aktiv eine Änderung der Geschäftsstrategie zu verfolgen. Schedule 13G zeigt eine passive Investition von über 5% an.
AI+ Ask Fintel’s AI assistant about BRIGHTHOUSE FDS TR I Invesco GLOBAL EQUITY PORT.
13F und NPORT Einreichungen
Details zu 13F-Einreichungen sind kostenlos. Für Details zu NP-Einreichungen ist eine Premium-Mitgliedschaft erforderlich. Grüne Zeilen zeigen neue Positionen an. Rote Zeilen zeigen geschlossene Positionen an. Klicken Sie auf das Link Symbol, um den gesamten Transaktionsverlauf zu sehen.
Upgrade
um Prämiendaten freizuschalten und nach Excel zu exportieren ![]() .
.
| Datei Datum | Quelle | Anleger | Typ | Durchschnittlicher Preis (Est) |
Aktien | Δ Aktien (%) |
Gemeldeter Wert ($1000) |
Δ Wert (%) |
Port Alloc (%) |
|
|---|---|---|---|---|---|---|---|---|---|---|
| 2025-08-27 | NP | Brighthouse Funds Trust II - Brighthouse Asset Allocation 80 Portfolio Class A | 5.343.569 | 14,16 | 125.040 | 10,98 | ||||
| 2025-08-27 | NP | Brighthouse Funds Trust II - Brighthouse Asset Allocation 20 Portfolio Class A | 34.244 | 13,06 | 801 | 9,88 | ||||
| 2025-08-27 | NP | Brighthouse Funds Trust I - Brighthouse Asset Allocation 100 Portfolio Class A | 1.889.089 | 15,03 | 44.205 | 11,83 | ||||
| 2025-08-27 | NP | Brighthouse Funds Trust II - Brighthouse Asset Allocation 40 Portfolio Class A | 1.406.697 | 13,81 | 32.917 | 10,64 | ||||
| 2025-08-27 | NP | Brighthouse Funds Trust II - Brighthouse Asset Allocation 60 Portfolio Class A | 3.885.827 | 14,75 | 90.928 | 11,56 | ||||
| 2025-08-27 | NP | Brighthouse Funds Trust I - Brighthouse Balanced Plus Portfolio Class B | 2.146.825 | 13,36 | 50.236 | 10,20 |