Basisstatistiken
| Institutionelle Aktien (Long) | 158.982.174 - 67,15% (ex 13D/G) - change of -25,86MM shares -13,99% MRQ |
| Institutioneller Wert (Long) | $ 1.001.094 USD ($1000) |
Institutioneller Eigentümerschaft und Aktionäre
Dauch Corporation (US:AXL) hat 272 institutionelle Eigentümer und Aktionäre, die 13D/G oder 13F Formulare bei der Securities Exchange Commission (SEC) eingereicht haben. Diese Institutionen halten insgesamt 158,982,174 Aktien. Die größten Aktionäre sind BlackRock, Inc., Vanguard Group Inc, Dimensional Fund Advisors Lp, Goldman Sachs Group Inc, Fmr Llc, American Century Companies Inc, Barrow Hanley Mewhinney & Strauss Llc, Charles Schwab Investment Management Inc, State Street Corp, and UBS Group AG .
Dauch Corporation (NYSE:AXL) Die institutionelle Eigentümerstruktur zeigt die aktuellen Positionen von Institutionen und Fonds im Unternehmen sowie die jüngsten Veränderungen der Positionsgröße. Zu den Großaktionären können Einzelanleger, Investmentfonds, Hedgefonds oder Institutionen gehören. Der Schedule 13D zeigt an, dass der Investor mehr als 5% des Unternehmens hält (oder gehalten hat) und beabsichtigt (oder beabsichtigt hat), aktiv eine Änderung der Geschäftsstrategie zu verfolgen. Schedule 13G zeigt eine passive Investition von über 5% an.
The share price as of February 4, 2026 is 9,00 / share. Previously, on April 17, 2025, the share price was 3,34 / share. This represents an increase of 169,46% over that period.

Fondsstimmung-Score
Der Fondsstimmung-Score (auch bekannt als Eigentümer-Akkumulations-Score) ermittelt die Aktien, die am meisten von Fonds gekauft werden. Er ist das Ergebnis eines ausgeklügelten quantitativen Multifaktormodells, das die Unternehmen mit den höchsten institutionellen Käufen identifiziert. Das Scoring-Modell verwendet eine Kombination aus der Gesamtzunahme der offengelegten Eigentümer, den Änderungen der Portfolioallokationen in diesen Eigentümern und anderen Metriken. Die Zahl reicht von 0 bis 100, wobei höhere Zahlen ein höheres Maß an Kapitalakkumulation als bei anderen Unternehmen anzeigen und 50 den Durchschnitt darstellt.
Aktualisierungshäufigkeit: Täglich
Siehe Ownership Explorer, der eine Liste der am höchsten bewerteten Unternehmen enthält.
AI+ Ask Fintel’s AI assistant about Dauch Corporation.
Select a question to share a public post with an AI-crafted answer.
Thinking of good questions…
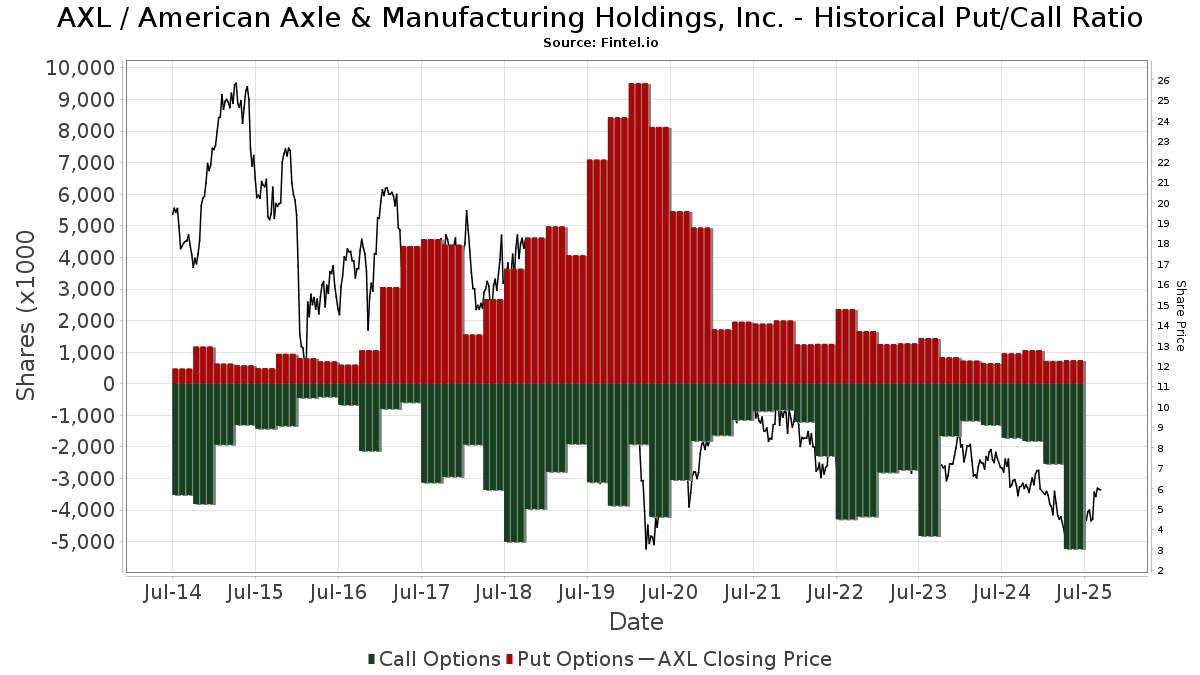
Institutionelles Put/Call-Verhältnis
Zusätzlich zur Meldung der Standardemissionen von Aktien und Schuldtiteln müssen Institute mit einem verwalteten Vermögen von mehr als 100 Mio. EUR auch ihre Bestände an Verkaufs- und Kaufoptionen offenlegen. Da Put-Optionen im Allgemeinen eine negative Stimmung und Call-Optionen eine positive Stimmung anzeigen, können wir uns ein Bild von der allgemeinen institutionellen Stimmung machen, indem wir das Verhältnis von Puts zu Calls aufzeichnen. Das Diagramm auf der rechten Seite zeigt das historische Put/Call-Verhältnis für dieses Instrument.
Die Verwendung des Put/Call-Verhältnisses als Indikator für die Anlegerstimmung überwindet einen der Hauptmängel der Verwendung des gesamten institutionellen Besitzes, der darin besteht, dass ein erheblicher Teil des verwalteten Vermögens passiv investiert wird, um Indizes abzubilden. Passiv verwaltete Fonds kaufen in der Regel keine Optionen, so dass der Indikator Put/Call-Verhältnis die Stimmung der aktiv verwalteten Fonds besser widerspiegelt.
13F und NPORT Einreichungen
Details zu 13F-Einreichungen sind kostenlos. Für Details zu NP-Einreichungen ist eine Premium-Mitgliedschaft erforderlich. Grüne Zeilen zeigen neue Positionen an. Rote Zeilen zeigen geschlossene Positionen an. Klicken Sie auf das Link Symbol, um den gesamten Transaktionsverlauf zu sehen.
Upgrade
um Prämiendaten freizuschalten und nach Excel zu exportieren ![]() .
.
| Datei Datum | Quelle | Anleger | Typ | Durchschnittlicher Preis (Est) |
Aktien | Δ Aktien (%) |
Gemeldeter Wert ($1000) |
Δ Wert (%) |
Port Alloc (%) |
|
|---|---|---|---|---|---|---|---|---|---|---|
| 2026-02-13 | 13F | Aigen Investment Management, Lp | 20.861 | 134 | ||||||
| 2026-02-17 | 13F | PharVision Advisers, LLC | 75.794 | 45,57 | 486 | 55,45 | ||||
| 2026-01-29 | 13F | IMC-Chicago, LLC | 80.089 | 513 | ||||||
| 2026-04-07 | 13F | Signaturefd, Llc | 7.008 | 0,00 | 42 | -6,82 | ||||
| 2026-01-29 | 13F | IMC-Chicago, LLC | Call | 32.700 | -55,99 | 210 | -53,14 | |||
| 2025-11-21 | 13F/A | CIBC Bancorp USA Inc. | 12.332 | 74 | ||||||
| 2026-02-17 | 13F | Optiver Holding B.V. | 742 | -36,47 | 5 | -42,86 | ||||
| 2026-02-02 | 13F | Advisors Preferred, LLC | 0 | -100,00 | 0 | |||||
| 2026-02-09 | 13F | Hartland & Co., LLC | 2.300 | -28,90 | 15 | -26,32 | ||||
| 2026-02-13 | 13F | Jacobs Levy Equity Management, Inc | 563.139 | -76,87 | 3.610 | -75,34 | ||||
| 2026-02-17 | 13F | Citadel Advisors Llc | Call | 210.200 | -36,78 | 1.347 | -32,58 | |||
| 2026-02-02 | 13F | Fifth Third Bancorp | 5.259 | 1,66 | 34 | 6,45 | ||||
| 2026-02-13 | 13F | Landscape Capital Management, L.l.c. | 50.061 | -30,18 | 321 | -25,58 | ||||
| 2026-02-13 | 13F | Sterling Capital Management LLC | 77.037 | -1,58 | 494 | 4,89 | ||||
| 2026-02-17 | 13F | Citadel Advisors Llc | 197.636 | -84,04 | 1.267 | -82,99 | ||||
| 2026-02-17 | 13F | Nomura Holdings Inc | 19.495 | 125 | ||||||
| 2026-02-17 | 13F | Susquehanna International Group, Llp | Put | 0 | -100,00 | 0 | ||||
| 2026-02-11 | 13F | Simplex Trading, Llc | Put | 0 | -100,00 | 0 | ||||
| 2026-02-17 | 13F | Citadel Advisors Llc | Put | 292.800 | 13,01 | 1.877 | 20,49 | |||
| 2026-02-17 | 13F | Nomura Holdings Inc | Put | 100.200 | 0,00 | 642 | 6,64 | |||
| 2026-02-13 | 13F | Fifth Lane Capital, Lp | Call | 10.000 | 64 | |||||
| 2026-02-13 | 13F | Umb Bank N A/mo | 487 | 139,90 | 3 | 200,00 | ||||
| 2025-11-14 | 13F | Occudo Quantitative Strategies Lp | 0 | -100,00 | 0 | |||||
| 2026-02-17 | 13F | Russell Investments Group, Ltd. | 63.311 | -58,05 | 406 | -55,24 | ||||
| 2026-02-14 | 13F | Rockefeller Capital Management L.P. | 408 | -70,37 | 3 | -75,00 | ||||
| 2026-02-03 | 13F | Mitsubishi UFJ Kokusai Asset Management Co., Ltd. | 69.482 | -28,14 | 451 | -22,55 | ||||
| 2026-02-17 | 13F | Atom Investors LP | 176.409 | 1.131 | ||||||
| 2026-01-21 | 13F | Yousif Capital Management, Llc | 31.919 | -12,95 | 247 | 12,27 | ||||
| 2026-02-06 | 13F | Global Retirement Partners, LLC | 205 | 1 | ||||||
| 2026-02-17 | 13F | Hancock Whitney Corp | 27.619 | 0,00 | 177 | 7,27 | ||||
| 2025-11-03 | 13F | SummerHaven Investment Management, LLC | 0 | -100,00 | 0 | |||||
| 2026-02-12 | 13F | MetLife Investment Management, LLC | 58.215 | -12,89 | 373 | -6,98 | ||||
| 2026-02-17 | 13F | Aqr Capital Management Llc | 803.870 | 0,29 | 5.153 | 6,95 | ||||
| 2026-02-17 | 13F | Weiss Asset Management LP | 11.989 | 77 | ||||||
| 2025-11-14 | 13F | Sofos Investments, Inc. | 0 | -100,00 | 0 | |||||
| 2025-11-12 | 13F | Bardin Hill Management Partners Lp | Put | 0 | -100,00 | 0 | -100,00 | |||
| 2026-02-06 | 13F | Profund Advisors Llc | 14.462 | 93 | ||||||
| 2025-11-13 | 13F | Eisler Capital Management Ltd. | 11.123 | 67 | ||||||
| 2026-02-13 | 13F | First Trust Advisors Lp | 377.441 | 1,82 | 2.419 | 8,62 | ||||
| 2026-02-13 | 13F | Ubs Asset Management Americas Inc | 12.010 | 19,98 | 77 | 26,67 | ||||
| 2026-02-17 | 13F | Shay Capital LLC | 89.000 | -42,95 | 570 | -39,17 | ||||
| 2026-02-12 | 13F | Nuveen, LLC | 1.921.445 | 3,06 | 12.316 | 9,92 | ||||
| 2026-04-03 | 13F | Investors Research Corp | 1.000 | 0,00 | 6 | -16,67 | ||||
| 2026-02-17 | 13F | Invenomic Capital Management LP | 1.779.895 | 71,33 | 11.409 | 82,75 | ||||
| 2026-02-17 | 13F | Lighthouse Investment Partners, LLC | 196.091 | 180,13 | 1.257 | 199,05 | ||||
| 2026-02-12 | 13F | Federated Hermes, Inc. | 77.045 | 658,84 | 494 | 708,20 | ||||
| 2026-01-28 | 13F | Salomon & Ludwin, LLC | 1.326 | 0,00 | 9 | 0,00 | ||||
| 2026-01-30 | 13F | New York State Teachers Retirement System | 128.115 | 0,08 | 1 | |||||
| 2026-02-17 | 13F | Mercer Global Advisors Inc /adv | 0 | -100,00 | 0 | |||||
| 2026-02-17 | 13F | Advisor Group Holdings, Inc. | 1.749 | 34,44 | 11 | 57,14 | ||||
| 2025-10-30 | 13F | Williams & Novak, LLC | 0 | -100,00 | 0 | |||||
| 2026-02-17 | 13F | VARCOV Co. | 154.709 | 992 | ||||||
| 2026-02-03 | 13F | Crossmark Global Holdings, Inc. | 10.294 | 0,00 | 66 | 6,56 | ||||
| 2026-02-17 | 13F | Prelude Capital Management, Llc | 52.152 | -18,32 | 334 | -12,79 | ||||
| 2026-02-17 | 13F | Quantedge Capital Pte Ltd | 40.200 | 127,12 | 258 | 142,45 | ||||
| 2026-02-17 | 13F | Hbk Investments L P | Call | 0 | -100,00 | 0 | ||||
| 2026-02-12 | 13F | DRW Securities, LLC | Put | 46.500 | 298 | |||||
| 2026-02-12 | 13F | DRW Securities, LLC | 15.300 | 98 | ||||||
| 2026-02-11 | 13F | Parallel Advisors, LLC | 687 | 0,00 | 4 | 0,00 | ||||
| 2026-04-07 | 13F | Farther Finance Advisors, LLC | 547 | 12,32 | 3 | 0,00 | ||||
| 2026-02-10 | 13F | Axq Capital, Lp | 20.104 | 129 | ||||||
| 2026-02-13 | 13F | Pinnacle Wealth Planning Services, Inc. | 3.283 | 21 | ||||||
| 2026-02-05 | 13F | Dana Investment Advisors, Inc. | 1.194.955 | -0,13 | 7.660 | 6,52 | ||||
| 2026-02-17 | 13F | Lonestar Capital Management LLC | 2.156.574 | 618,86 | 13.824 | 666,67 | ||||
| 2026-01-23 | 13F | Rsm Us Wealth Management Llc | 0 | -100,00 | 0 | |||||
| 2025-11-14 | 13F | LMR Partners LLP | Call | 0 | -100,00 | 0 | -100,00 | |||
| 2026-02-17 | 13F | Guggenheim Capital Llc | 97.364 | 337,32 | 624 | 369,17 | ||||
| 2026-02-17 | 13F | Ancora Advisors, LLC | 800 | 0,00 | 5 | 25,00 | ||||
| 2025-12-18 | 13F | Danske Bank A/s | 0 | -100,00 | 0 | |||||
| 2026-02-17 | 13F | Aquatic Capital Management LLC | 144.384 | -34,93 | 926 | -30,61 | ||||
| 2026-02-17 | 13F | Dark Forest Capital Management Lp | 0 | -100,00 | 0 | |||||
| 2026-02-11 | 13F | Franklin Resources Inc | 237.810 | -23,15 | 1.524 | -20,83 | ||||
| 2026-01-22 | 13F | Financial Consulate, Inc | 50 | 0 | ||||||
| 2026-02-10 | 13F | CIBC Asset Management Inc | 11.349 | 0,00 | 73 | 5,88 | ||||
| 2026-02-12 | 13F | Quadrant Capital Group Llc | 4.585 | 0,00 | 29 | 7,41 | ||||
| 2026-02-13 | 13F | Verition Fund Management LLC | 418.979 | -42,16 | 2.686 | -38,32 | ||||
| 2026-01-29 | 13F | Riverbend Wealth Management, LLC | 10.008 | -2,92 | 64 | 4,92 | ||||
| 2025-11-13 | 13F | Fuller & Thaler Asset Management, Inc. | 0 | -100,00 | 0 | |||||
| 2026-02-13 | 13F | Healthcare Of Ontario Pension Plan Trust Fund | 441.700 | 0,00 | 2.831 | 6,67 | ||||
| 2026-02-17 | 13F | Bank Of America Corp /de/ | 905.650 | 10,78 | 5.805 | 18,16 | ||||
| 2025-11-21 | 13F | Nebula Research & Development LLC | 0 | -100,00 | 0 | |||||
| 2026-02-17 | 13F | Readystate Asset Management Lp | 639.103 | 182,67 | 4.097 | 201,62 | ||||
| 2026-02-17 | 13F | Advisory Services Network, LLC | 0 | -100,00 | 0 | |||||
| 2026-01-15 | 13F | Founders Capital Management | 0 | -100,00 | 0 | -100,00 | ||||
| 2026-01-16 | 13F | Louisiana State Employees Retirement System | 54.400 | -0,18 | 349 | 6,42 | ||||
| 2026-02-13 | 13F | Public Sector Pension Investment Board | 0 | -100,00 | 0 | |||||
| 2026-02-12 | 13F | Hrt Financial Lp | 320.779 | 2 | ||||||
| 2026-02-10 | 13F | Bank of New York Mellon Corp | 823.078 | 3,85 | 5.276 | 10,75 | ||||
| 2026-02-13 | 13F | Walleye Capital LLC | Call | 0 | -100,00 | 0 | ||||
| 2026-01-29 | 13F | UBS Group AG | 3.918.228 | 11,83 | 25.116 | 19,27 | ||||
| 2026-02-11 | 13F | Cerity Partners LLC | 58.848 | -2,40 | 377 | 4,14 | ||||
| 2026-02-13 | 13F | Diametric Capital, LP | 209.604 | 7,98 | 1.344 | 15,18 | ||||
| 2026-02-11 | 13F | Hughes Financial Services, LLC | 160 | 0,00 | 1 | |||||
| 2026-02-17 | 13F | Caption Management, LLC | 70.000 | 166,89 | 449 | 185,35 | ||||
| 2025-11-13 | 13F | EntryPoint Capital, LLC | 0 | -100,00 | 0 | |||||
| 2026-02-10 | 13F | Semanteon Capital Management, LP | 0 | -100,00 | 0 | |||||
| 2025-11-13 | 13F | Glenmede Investment Management, LP | 0 | -100,00 | 0 | -100,00 | ||||
| 2026-02-06 | 13F | Lsv Asset Management | 193.100 | -23,62 | 1 | 0,00 | ||||
| 2026-02-17 | 13F | AYAL Capital Advisors Ltd | 800.000 | -27,21 | 5.128 | -22,36 | ||||
| 2026-02-17 | 13F | Amundi | 14.924 | -22,93 | 96 | -20,17 | ||||
| 2026-02-17 | 13F | State Of Wisconsin Investment Board | 25.654 | -85,56 | 164 | -84,63 | ||||
| 2026-02-13 | 13F | K2 Principal Fund, L.p. | 829.192 | 19,00 | 5.315 | 26,94 | ||||
| 2026-02-18 | 13F | State of Tennessee, Treasury Department | 26.190 | -7,32 | 209 | 23,08 | ||||
| 2026-02-09 | 13F | Legal & General Group Plc | 202.052 | 4,07 | 1.295 | 11,06 | ||||
| 2026-04-07 | 13F | Central Pacific Bank - Trust Division | 37.601 | 0,00 | 223 | -7,88 | ||||
| 2026-02-11 | 13F | Simplex Trading, Llc | Call | 0 | -100,00 | 0 | ||||
| 2026-02-11 | 13F | Deutsche Bank Ag\ | 73.488 | 5,89 | 471 | 12,95 | ||||
| 2026-02-17 | 13F | Schonfeld Strategic Advisors LLC | 582.754 | 14,53 | 3.735 | 22,14 | ||||
| 2026-02-06 | 13F | Covestor Ltd | 1.461 | 529,74 | 0 | |||||
| 2026-02-10 | 13F | Commonwealth Of Pennsylvania Public School Empls Retrmt Sys | 29.385 | -2,76 | 188 | 3,87 | ||||
| 2026-02-12 | 13F | Bank Of Montreal /can/ | 16.072 | 0,16 | 103 | 7,29 | ||||
| 2026-02-13 | 13F | Mariner, LLC | 480.327 | -4,35 | 3.079 | 1,99 | ||||
| 2026-02-13 | 13F | Public Employees Retirement Association Of Colorado | 13.856 | 0,00 | 0 | |||||
| 2026-04-13 | 13F | Global X Japan Co., Ltd. | 1.910 | -17,92 | 11 | -21,43 | ||||
| 2026-02-10 | 13F | Bnp Paribas Arbitrage, Sa | 750.690 | 223,13 | 4.812 | 244,63 | ||||
| 2026-02-17 | 13F | Two Sigma Advisers, Lp | 271.715 | -32,95 | 1.742 | -28,50 | ||||
| 2026-02-13 | 13F | State Street Corp | 4.700.304 | -2,70 | 30.129 | 3,77 | ||||
| 2026-02-17 | 13F | Man Group plc | 267.352 | -63,27 | 1.714 | -60,84 | ||||
| 2026-02-11 | 13F | Fox Run Management, L.l.c. | 0 | -100,00 | 0 | |||||
| 2026-02-13 | 13F | American Century Companies Inc | 5.226.668 | 5,75 | 33.503 | 12,79 | ||||
| 2026-02-11 | 13F | LPL Financial LLC | 26.766 | 38,18 | 172 | 47,41 | ||||
| 2026-02-06 | 13F | HighTower Advisors, LLC | 12.806 | 1,65 | 82 | 9,33 | ||||
| 2026-02-13 | 13F | Walleye Trading LLC | Call | 46.000 | 0,00 | 295 | 6,52 | |||
| 2026-02-13 | 13F | Morgan Stanley | 3.597.018 | 2,68 | 23.057 | 9,51 | ||||
| 2025-11-03 | 13F | LRI Investments, LLC | 0 | -100,00 | 0 | |||||
| 2026-02-13 | 13F | Wells Fargo & Company/mn | 133.078 | 44,54 | 853 | 54,25 | ||||
| 2026-02-12 | 13F | Integrated Quantitative Investments LLC | 70.683 | 453 | ||||||
| 2026-02-13 | 13F | Walleye Trading LLC | 197.608 | -19,68 | 1.267 | -14,34 | ||||
| 2026-02-17 | 13F | Canada Pension Plan Investment Board | 53.400 | 342 | ||||||
| 2026-02-10 | 13F | Mutual Of America Capital Management Llc | 13.566 | 2,06 | 87 | 8,86 | ||||
| 2025-11-12 | 13F | Neuberger Berman Group LLC | 0 | -100,00 | 0 | |||||
| 2025-11-14 | 13F | Raymond James Financial Inc | 0 | -100,00 | 0 | |||||
| 2026-01-29 | 13F | Teachers Retirement System Of The State Of Kentucky | 29.739 | -10,95 | 0 | |||||
| 2026-02-17 | 13F | Masters Capital Management Llc | 3.000.000 | 150,00 | 19.230 | 166,64 | ||||
| 2026-02-17 | 13F | Sona Asset Management (us) Llc | Call | 1.500.000 | 0,00 | 9.615 | 6,66 | |||
| 2026-02-17 | 13F | Jones Financial Companies Lllp | 1.288 | 157,60 | 8 | 166,67 | ||||
| 2026-02-17 | 13F | Sona Asset Management (us) Llc | 3.737.937 | 356,22 | 23.960 | 386,60 | ||||
| 2026-01-20 | 13F | Harbor Capital Advisors, Inc. | 2.124 | -1,67 | 0 | |||||
| 2026-02-13 | 13F | Manufacturers Life Insurance Company, The | 0 | -100,00 | 0 | -100,00 | ||||
| 2026-02-17 | 13F | Clear Street Markets Llc | 27.000 | 173 | ||||||
| 2025-11-05 | 13F | Koesten, Hirschmann & Crabtree, INC. | 0 | -100,00 | 0 | |||||
| 2026-02-13 | 13F | Squarepoint Ops LLC | 827.552 | -9,75 | 5.305 | -3,74 | ||||
| 2026-02-17 | 13F | CWM Advisors, LLC | 73.367 | -3,42 | 470 | 3,07 | ||||
| 2026-02-17 | 13F | Miller Value Partners, Llc | 1.734.780 | 1,03 | 11.120 | 7,75 | ||||
| 2026-02-03 | 13F | SBI Securities Co., Ltd. | 1.900 | 5,50 | 12 | 20,00 | ||||
| 2025-11-06 | 13F | Alpine Associates Management Inc. | Call | 0 | -100,00 | 0 | ||||
| 2026-02-13 | 13F | Prudential Financial Inc | 299.247 | -10,54 | 1.918 | -4,58 | ||||
| 2026-02-09 | 13F | Huntington National Bank | 1 | 0,00 | 0 | |||||
| 2026-02-13 | 13F | Marshall Wace, Llp | 1.256.037 | 8.051 | ||||||
| 2026-02-05 | 13F | Allworth Financial LP | 4.585 | 21,04 | 29 | 31,82 | ||||
| 2026-01-28 | 13F | Peregrine Capital Management Llc | 774.830 | 4.967 | ||||||
| 2026-02-13 | 13F | Sei Investments Co | 520.126 | 224,01 | 3.334 | 245,75 | ||||
| 2025-10-30 | 13F | Twin Peaks Wealth Advisors, LLC | 0 | -100,00 | 0 | |||||
| 2025-11-14 | 13F | Texas Permanent School Fund | 0 | -100,00 | 0 | |||||
| 2026-02-11 | 13F | Los Angeles Capital Management Llc | 164.991 | -54,59 | 1.058 | -51,58 | ||||
| 2026-02-13 | 13F | Heights Point Management, LP | 696.536 | 4.465 | ||||||
| 2026-02-11 | 13F | Barrow Hanley Mewhinney & Strauss Llc | 4.955.616 | -6,88 | 31.765 | -0,68 | ||||
| 2026-02-17 | 13F | Brevan Howard Capital Management LP | 125.192 | 524,46 | 802 | 568,33 | ||||
| 2026-02-09 | 13F | Geode Capital Management, Llc | 2.784.731 | 9,24 | 17.854 | 16,52 | ||||
| 2026-02-13 | 13F | Walleye Capital LLC | Put | 0 | -100,00 | 0 | ||||
| 2026-02-13 | 13F | Walleye Capital LLC | 0 | -100,00 | 0 | |||||
| 2026-02-19 | 13F | Invesco Ltd. | 3.352.470 | 66,10 | 21.489 | 77,16 | ||||
| 2025-11-13 | 13F | Dynamic Technology Lab Private Ltd | 0 | -100,00 | 0 | |||||
| 2026-02-17 | 13F | Bridgeway Capital Management Inc | 1.280.516 | -9,23 | 8.208 | -3,18 | ||||
| 2026-02-13 | 13F | SRS Capital Advisors, Inc. | 20 | -99,79 | 0 | -100,00 | ||||
| 2026-02-17 | 13F | Odyssean, LLC | 15.067 | 97 | ||||||
| 2026-02-13 | 13F | Quarry LP | 5.113 | -38,92 | 33 | -36,00 | ||||
| 2026-02-17 | 13F | Northern Trust Corp | 1.614.569 | -6,50 | 10.349 | -0,27 | ||||
| 2026-02-13 | 13F | Police & Firemen's Retirement System of New Jersey | 31.620 | 0,00 | 203 | 6,32 | ||||
| 2026-02-13 | 13F/A | Alberta Investment Management Corp | 0 | -100,00 | 0 | -100,00 | ||||
| 2026-02-11 | 13F | Highbridge Capital Management Llc | 135.000 | 865 | ||||||
| 2026-02-13 | 13F | Charles Schwab Investment Management Inc | 4.903.895 | 13,54 | 31.434 | 21,10 | ||||
| 2026-02-17 | 13F | PDT Partners, LLC | 306.112 | 5,70 | 1.962 | 12,76 | ||||
| 2026-02-17 | 13F | Creative Planning | 160.819 | 25,39 | 1.031 | 33,77 | ||||
| 2026-02-17 | 13F | Royal Bank Of Canada | Call | 331.600 | 41,89 | 2.126 | 51,32 | |||
| 2026-02-11 | 13F | O'shaughnessy Asset Management, Llc | 24.640 | -0,97 | 158 | 5,37 | ||||
| 2026-02-17 | 13F | Royal Bank Of Canada | 15.026 | -99,16 | 96 | -99,11 | ||||
| 2026-02-10 | 13F | State of Wyoming | 32.205 | -15,97 | 206 | -10,43 | ||||
| 2026-02-17 | 13F | Lazard Asset Management Llc | 19.128 | -0,21 | 123 | 6,09 | ||||
| 2026-02-03 | 13F | McIlrath & Eck, LLC | 377 | -33,74 | 2 | -33,33 | ||||
| 2026-04-08 | 13F | Wealth Enhancement Advisory Services, Llc | 30.357 | 8,73 | 185 | -5,61 | ||||
| 2026-02-17 | 13F | Whitebox Advisors Llc | 3.243.553 | -23,17 | 20.791 | -18,06 | ||||
| 2026-02-05 | 13F | Thrivent Financial For Lutherans | 81.559 | -56,17 | 1 | -100,00 | ||||
| 2026-02-13 | 13F | Kestra Advisory Services, LLC | 8.700 | 56 | ||||||
| 2025-11-13 | 13F | Clear Street Markets Llc | Put | 0 | -100,00 | 0 | ||||
| 2026-04-09 | 13F | Everhart Financial Group, Inc. | 12.015 | 71 | ||||||
| 2026-02-05 | 13F | Amalgamated Bank | 34.820 | 0,45 | 0 | |||||
| 2026-02-13 | 13F | Y-Intercept (Hong Kong) Ltd | 164.499 | 1.054 | ||||||
| 2026-02-13 | 13F | Barclays Plc | 579.673 | 2,64 | 3.716 | 9,46 | ||||
| 2026-02-17 | 13F | Cetera Investment Advisers | 37.985 | 1,50 | 243 | 8,48 | ||||
| 2026-02-12 | 13F | Cibc World Markets Corp | 0 | -100,00 | 0 | |||||
| 2026-02-13 | 13F | Great West Life Assurance Co /can/ | 105.819 | 29,92 | 1 | |||||
| 2026-01-26 | 13F | Ckw Financial Group | 500 | 0,00 | 0 | |||||
| 2026-02-06 | 13F | EverSource Wealth Advisors, LLC | 1.028 | -8,70 | 7 | 0,00 | ||||
| 2026-02-17 | 13F | Grantham, Mayo, Van Otterloo & Co. LLC | 26.275 | 55,34 | 168 | 66,34 | ||||
| 2026-02-11 | 13F | Jpmorgan Chase & Co | 276.014 | 52,76 | 1.769 | 63,04 | ||||
| 2026-02-05 | 13F | Center for Financial Planning, Inc. | 20.000 | 0,00 | 128 | 6,67 | ||||
| 2026-02-13 | 13F | HITE Hedge Asset Management LLC | 1.472.714 | -40,56 | 9.440 | -36,60 | ||||
| 2026-02-04 | 13F | Oregon Public Employees Retirement Fund | 27.147 | 1,50 | 174 | 8,75 | ||||
| 2026-02-11 | 13F | Invst, LLC | 219.195 | 1,14 | 1.405 | 7,91 | ||||
| 2026-02-17 | 13F | Susquehanna Portfolio Strategies, LLC | 313.568 | 160,11 | 2.010 | 177,49 | ||||
| 2026-01-26 | 13F | Cwm, Llc | 27.737 | 0,59 | 0 | |||||
| 2026-01-29 | 13F | Comerica Bank | 25.802 | -21,62 | 165 | -16,24 | ||||
| 2025-11-04 | 13F | Mutual Advisors, LLC | 0 | -100,00 | 0 | |||||
| 2026-02-17 | 13F | Tudor Investment Corp Et Al | Call | 100.000 | 0,00 | 641 | 6,66 | |||
| 2026-04-16 | 13F | Trium Capital LLP | 6 | 0 | ||||||
| 2026-02-12 | 13F | BlackRock, Inc. | 20.588.265 | 0,44 | 131.971 | 7,13 | ||||
| 2026-02-02 | 13F | Wolverine Asset Management Llc | 108.511 | -6,87 | 696 | -0,71 | ||||
| 2026-02-17 | 13F | Numerai GP LLC | 477.080 | 102,23 | 3.058 | 115,81 | ||||
| 2026-01-28 | 13F | Universal- Beteiligungs- und Servicegesellschaft mbH | 35.568 | -4,24 | 229 | 2,69 | ||||
| 2026-01-29 | 13F | Vanguard Group Inc | 9.101.519 | 2,27 | 58.341 | 9,08 | ||||
| 2026-02-13 | 13F | Citigroup Inc | 54.249 | -24,38 | 348 | -19,49 | ||||
| 2026-02-17 | 13F | Alliancebernstein L.p. | 436.925 | -8,11 | 2.801 | -2,00 | ||||
| 2026-01-23 | 13F | State of Alaska, Department of Revenue | 60.438 | 1,22 | 0 | |||||
| 2026-02-17 | 13F | Hartree Partners, LP | 0 | -100,00 | 0 | |||||
| 2026-04-06 | 13F | GAMMA Investing LLC | 2.906 | 132,67 | 17 | 112,50 | ||||
| 2026-02-13 | 13F | Headlands Technologies LLC | 0 | -100,00 | 0 | |||||
| 2026-02-13 | 13F | Centiva Capital, LP | Put | 12.700 | 0,00 | 81 | 6,58 | |||
| 2026-02-17 | 13F | Boothbay Fund Management, Llc | 752.394 | -2,64 | 4.823 | 3,83 | ||||
| 2026-02-17 | 13F | Woodline Partners LP | 1.828.383 | -4,20 | 11.720 | 2,17 | ||||
| 2026-02-13 | 13F | Panagora Asset Management Inc | 18.286 | 0,00 | 117 | 7,34 | ||||
| 2026-02-17 | 13F | Engineers Gate Manager LP | 0 | -100,00 | 0 | |||||
| 2026-04-16 | 13F | SG Americas Securities, LLC | 182.019 | 45,48 | 1 | |||||
| 2026-03-12 | 13F/A | Peak6 Llc | 143.434 | -15,81 | 919 | -10,17 | ||||
| 2026-01-29 | 13F | Golden State Equity Partners | 15.013 | 0,00 | 96 | 6,67 | ||||
| 2026-03-12 | 13F/A | Peak6 Llc | Put | 12.500 | 0,00 | 80 | 6,67 | |||
| 2026-02-13 | 13F | JustInvest LLC | 29.081 | 6,58 | 186 | 14,11 | ||||
| 2026-02-12 | 13F | Voya Investment Management Llc | 235.660 | -8,65 | 1.511 | -2,58 | ||||
| 2026-02-17 | 13F | Concentric Capital Strategies, LP | 563.311 | 3.611 | ||||||
| 2026-02-12 | 13F | State Board Of Administration Of Florida Retirement System | 280.376 | 1,70 | 1.797 | 8,51 | ||||
| 2026-01-15 | 13F | Allspring Global Investments Holdings, LLC | 67.339 | 9,76 | 437 | 18,75 | ||||
| 2026-02-17 | 13F | Ameriprise Financial Inc | 429.029 | -35,00 | 2.750 | -30,66 | ||||
| 2026-02-10 | 13F | Rothschild Investment Llc | 435 | 6,10 | 3 | 0,00 | ||||
| 2026-02-17 | 13F | Public Employees Retirement System Of Ohio | 114.968 | -36,21 | 737 | -32,04 | ||||
| 2026-02-17 | 13F | Price T Rowe Associates Inc /md/ | 67.253 | 10,02 | 0 | |||||
| 2025-11-12 | 13F/A | Norges Bank | 0 | -100,00 | 0 | |||||
| 2025-11-13 | 13F | Total Investment Management Inc | 0 | -100,00 | 0 | |||||
| 2025-11-13 | 13F | Hsbc Holdings Plc | 0 | -100,00 | 0 | |||||
| 2026-02-11 | 13F | Empowered Funds, LLC | 570.020 | -10,68 | 3.654 | -4,75 | ||||
| 2026-02-12 | 13F | Counterpoint Mutual Funds LLC | 79.022 | 37,14 | 507 | 46,24 | ||||
| 2026-02-17 | 13F | Jain Global LLC | 0 | -100,00 | 0 | |||||
| 2026-02-13 | 13F | Parkside Financial Bank & Trust | 93 | 0,00 | 1 | |||||
| 2025-11-14 | 13F | Northwestern Mutual Wealth Management Co | 0 | -100,00 | 0 | |||||
| 2026-02-12 | 13F | Renaissance Technologies Llc | 1.343.899 | 0,00 | 8.614 | 6,66 | ||||
| 2026-02-12 | 13F | Highland Peak Capital, LLC | 0 | -100,00 | 0 | |||||
| 2026-02-17 | 13F | California State Teachers Retirement System | 7.121 | -16,28 | 46 | -11,76 | ||||
| 2026-02-11 | 13F | Gilpin Wealth Management, Llc | 11 | 0 | ||||||
| 2026-01-26 | 13F | Mirae Asset Global Investments Co., Ltd. | 87.789 | -4,01 | 563 | 2,37 | ||||
| 2026-02-17 | 13F | Gotham Asset Management, LLC | 144.003 | 141,80 | 923 | 158,54 | ||||
| 2026-02-10 | 13F | Connor, Clark & Lunn Investment Management Ltd. | 496.225 | 103,35 | 3.181 | 116,92 | ||||
| 2026-02-13 | 13F | Pathstone Holdings, LLC | 0 | -100,00 | 0 | |||||
| 2026-02-17 | 13F | Two Sigma Investments, Lp | 757.375 | -0,05 | 4.855 | 6,59 | ||||
| 2026-02-13 | 13F | Victory Capital Management Inc | 16.243 | 2,25 | 104 | 9,47 | ||||
| 2026-02-17 | 13F | XTX Topco Ltd | 104.019 | -56,61 | 667 | -53,75 | ||||
| 2026-02-13 | 13F | Hudson Bay Capital Management LP | 135.205 | 703,79 | 867 | 757,43 | ||||
| 2026-02-11 | 13F | Winton Capital Group Ltd | 14.500 | 93 | ||||||
| 2026-02-17 | 13F | Atlantic Investment Management Inc | 1.883.000 | 12.070 | ||||||
| 2026-02-10 | 13F | Goldman Sachs Group Inc | 6.620.411 | 17,78 | 42.437 | 25,62 | ||||
| 2026-02-10 | 13F | Quantbot Technologies LP | 85.436 | -65,18 | 548 | -62,89 | ||||
| 2025-11-14 | 13F | Wolverine Trading, Llc | Call | 108.300 | 653 | |||||
| 2025-11-14 | 13F | Wolverine Trading, Llc | Put | 18.200 | 110 | |||||
| 2026-02-17 | 13F | Mangrove Partners | 37.477 | 240 | ||||||
| 2026-02-13 | 13F | Rhumbline Advisers | 350.180 | -2,61 | 2.245 | 3,89 | ||||
| 2026-02-17 | 13F/A | RBF Capital, LLC | 0 | -100,00 | 0 | |||||
| 2026-02-03 | 13F | Farmers & Merchants Investments Inc | 85 | 0,00 | 1 | |||||
| 2026-01-20 | 13F | Fundamentun, Llc | 13.928 | 89 | ||||||
| 2026-04-13 | 13F | True Wealth Design, LLC | 1.366 | -2,64 | 8 | 0,00 | ||||
| 2026-02-09 | 13F | Hantz Financial Services, Inc. | 8.511 | 94,18 | 0 | |||||
| 2026-02-12 | 13F | Dimensional Fund Advisors Lp | 6.778.415 | 1,63 | 43.450 | 8,40 | ||||
| 2026-02-14 | 13F | Militia Capital Partners, LP | 36.812 | 0,00 | 236 | 6,33 | ||||
| 2026-02-17 | 13F | Alpine Global Management, LLC | Put | 0 | -100,00 | 0 | -100,00 | |||
| 2026-02-02 | 13F | Principal Financial Group Inc | 565.649 | -1,22 | 3.626 | 5,35 | ||||
| 2026-02-11 | 13F | Cedar Mountain Advisors, LLC | 190 | 0,00 | 1 | 0,00 | ||||
| 2026-02-13 | 13F | Truvestments Capital Llc | 100 | 0,00 | 1 | |||||
| 2026-01-23 | 13F | Avion Wealth | 274 | 0,00 | 0 | |||||
| 2026-02-13 | 13F | Ieq Capital, Llc | 0 | -100,00 | 0 | |||||
| 2026-02-17 | 13F | Mirabella Financial Services Llp | 10.152 | 65 | ||||||
| 2025-11-07 | 13F | Shell Asset Management Co | 7.306 | -75,59 | 0 | |||||
| 2026-02-17 | 13F | Millennium Management Llc | 3.811.680 | 14,15 | 24.433 | 21,75 | ||||
| 2026-02-17 | 13F | Trexquant Investment LP | 476.855 | 5,17 | 3.057 | 12,19 | ||||
| 2026-02-04 | 13F | Kailix Advisors LLC | 1.579.500 | 115,78 | 10.125 | 130,14 | ||||
| 2026-02-06 | 13F | IFP Advisors, Inc | 0 | -100,00 | 0 | |||||
| 2026-02-17 | 13F | Aristeia Capital Llc | 121.592 | 96,77 | 779 | 109,97 | ||||
| 2026-02-11 | 13F | Inceptionr Llc | 12.204 | -38,54 | 78 | -34,45 | ||||
| 2026-02-12 | 13F | Jane Street Group, Llc | 172.297 | 1.104 | ||||||
| 2026-02-12 | 13F | Jane Street Group, Llc | Call | 73.500 | -13,63 | 471 | -7,83 | |||
| 2026-02-24 | 13F | Bell Investment Advisors, Inc | 1.028 | 290,87 | 7 | 500,00 | ||||
| 2026-04-15 | 13F | Fortitude Family Office, LLC | 622 | -15,49 | 4 | -25,00 | ||||
| 2026-02-17 | 13F | Algert Global Llc | 995.453 | 0,00 | 6 | 20,00 | ||||
| 2026-02-11 | 13F | Allianz Asset Management GmbH | 0 | -100,00 | 0 | |||||
| 2026-02-17 | 13F | Quantessence Capital LLC | 15.114 | 97 | ||||||
| 2026-02-06 | 13F | Legato Capital Management LLC | 70.683 | 453 | ||||||
| 2026-04-13 | 13F | Massmutual Trust Co Fsb/adv | 701 | 3,24 | 4 | 0,00 | ||||
| 2026-02-17 | 13F | Cantor Fitzgerald, L. P. | 53.135 | 341 | ||||||
| 2026-04-06 | 13F | Versant Capital Management, Inc | 143 | 1 | ||||||
| 2026-02-17 | 13F | Susquehanna International Group, Llp | 882.429 | -4,61 | 5.656 | 1,74 | ||||
| 2026-02-17 | 13F | Susquehanna International Group, Llp | Call | 86.600 | -55,06 | 555 | -52,07 | |||
| 2026-02-17 | 13F | Jump Financial, LLC | 273.410 | 88,10 | 1.753 | 100,69 | ||||
| 2026-02-13 | 13F | Macquarie Group Ltd | 0 | -100,00 | 0 | |||||
| 2025-11-12 | 13F | Simplex Trading, Llc | 0 | -100,00 | 0 | |||||
| 2026-02-17 | 13F | Quantinno Capital Management LP | 23.954 | -6,20 | 154 | 0,00 | ||||
| 2026-01-26 | 13F | Private Trust Co Na | 447 | 0,00 | 3 | 0,00 | ||||
| 2026-02-05 | 13F | Bessemer Group Inc | 516.824 | 67.813,80 | 3 | |||||
| 2026-02-17 | 13F | Bank Of America Corp /de/ | Call | 0 | -100,00 | 0 | ||||
| 2026-02-12 | 13F | Campbell & CO Investment Adviser LLC | 71.289 | 13,86 | 457 | 21,28 | ||||
| 2026-02-11 | 13F | Stonebrook Private Inc. | 29.561 | 189 | ||||||
| 2026-02-17 | 13F | SageView Advisory Group, LLC | 417 | 3 | ||||||
| 2026-02-13 | 13F | Jb Capital Partners Lp | 1.005.000 | -9,26 | 6.442 | -3,22 | ||||
| 2026-02-17 | 13F | D. E. Shaw & Co., Inc. | 358.999 | -54,11 | 2.301 | -51,06 | ||||
| 2026-02-17 | 13F | Lombard Odier Asset Management (USA) Corp | 490.000 | -4,85 | 3.141 | 1,45 | ||||
| 2026-01-30 | 13F | Us Bancorp \de\ | 789 | 0,00 | 5 | 25,00 | ||||
| 2026-02-10 | 13F | Intech Investment Management Llc | 513.730 | 435,48 | 3.293 | 471,70 | ||||
| 2026-02-17 | 13F | Maryland State Retirement & Pension System | 17.242 | 0,00 | 111 | 6,80 | ||||
| 2026-02-17 | 13F | Susquehanna Fundamental Investments, Llc | 36.706 | 0,00 | 235 | 6,82 | ||||
| 2026-02-03 | 13F | Ethic Inc. | 13.536 | 5,06 | 87 | 11,69 | ||||
| 2026-02-17 | 13F | Balyasny Asset Management Llc | 1.017.626 | 164,54 | 6.523 | 182,22 | ||||
| 2026-02-03 | 13F | Sequoia Financial Advisors, LLC | 2.247.585 | -0,00 | 14.407 | 6,66 | ||||
| 2026-02-17 | 13F | Newbrook Capital Advisors LP | 2.101.984 | 46,95 | 13.474 | 56,74 | ||||
| 2026-02-17 | 13F | Lombard Odier Asset Management (USA) Corp | Call | 100.000 | 0,00 | 641 | 6,66 | |||
| 2026-02-17 | 13F | Lombard Odier Asset Management (USA) Corp | Put | 100.000 | 0,00 | 641 | 6,66 | |||
| 2026-02-11 | 13F | Group One Trading, L.p. | Call | 233.100 | -57,46 | 1.494 | -54,63 | |||
| 2026-02-11 | 13F | Ameritas Investment Partners, Inc. | 9.665 | 62 | ||||||
| 2026-02-05 | 13F | Plante Moran Financial Advisors, LLC | 5.450 | 0,00 | 35 | 6,25 | ||||
| 2026-02-11 | 13F | Group One Trading, L.p. | Put | 92.700 | -21,84 | 594 | -16,57 | |||
| 2026-02-11 | 13F | Group One Trading, L.p. | 79.990 | -56,40 | 513 | -53,54 | ||||
| 2026-02-12 | 13F | New York State Common Retirement Fund | 23.263 | 0,00 | 149 | 7,19 | ||||
| 2026-02-13 | 13F | Colony Group, LLC | 114.508 | -1,89 | 690 | -1,43 | ||||
| 2026-02-06 | 13F | ProShare Advisors LLC | 22.528 | 3,13 | 144 | 9,92 | ||||
| 2026-02-13 | 13F | Smartleaf Asset Management LLC | 924 | 0,00 | 6 | 0,00 | ||||
| 2026-01-15 | 13F | Nisa Investment Advisors, Llc | 19.343 | 1,22 | 124 | 7,89 | ||||
| 2026-02-17 | 13F | Sherbrooke Park Advisers Llc | 0 | -100,00 | 0 | |||||
| 2026-02-18 | 13F | EP Wealth Advisors, Inc. | 21.143 | -6,43 | 136 | 46,74 | ||||
| 2026-02-17 | 13F | Tower Research Capital LLC (TRC) | 47.665 | 699,08 | 306 | 771,43 | ||||
| 2026-02-17 | 13F | Captrust Financial Advisors | 10.977 | -0,47 | 70 | 6,06 | ||||
| 2026-02-02 | 13F | Wolverine Asset Management Llc | Put | 2.500 | 16 | |||||
| 2026-02-05 | 13F | Abacus Wealth Partners, LLC | 12.772 | 82 | ||||||
| 2026-02-02 | 13F | Strs Ohio | 80.100 | 0,00 | 513 | 6,65 | ||||
| 2026-02-10 | 13F | Nomura Asset Management Co Ltd | 2.900 | 0,00 | 19 | 5,88 | ||||
| 2026-02-06 | 13F | Pnc Financial Services Group, Inc. | 8.593 | -8,87 | 55 | -1,79 | ||||
| 2026-03-03 | 13F/A | Caitong International Asset Management Co., Ltd | 10 | 0 | ||||||
| 2026-02-13 | 13F | Arrowstreet Capital, Limited Partnership | 1.307.935 | -61,33 | 8.384 | -58,76 | ||||
| 2026-02-12 | 13F | BRYN MAWR TRUST Co | 0 | -100,00 | 0 | -100,00 | ||||
| 2026-02-11 | 13F | Illinois Municipal Retirement Fund | 67.797 | 10,18 | 435 | 17,62 | ||||
| 2026-02-17 | 13F | Fmr Llc | 6.334.934 | 8,86 | 40.607 | 16,11 | ||||
| 2025-11-14 | 13F/A | Skopos Labs, Inc. | 0 | -100,00 | 0 | -100,00 | ||||
| 2026-02-06 | 13F | Gsa Capital Partners Llp | 10.941 | -79,62 | 0 | |||||
| 2026-02-12 | 13F | Wealthspire Advisors, LLC | 0 | -100,00 | 0 | |||||
| 2026-02-17 | 13F | Quadrature Capital Ltd | 119.864 | 470,32 | 768 | 509,52 | ||||
| 2026-02-17 | 13F | Delaware Management Holdings, Inc. | 93.200 | 597 | ||||||
| 2025-11-13 | 13F | PSquared Asset Management AG | 0 | -100,00 | 0 | |||||
| 2026-02-17 | 13F | MIRAE ASSET GLOBAL ETFS HOLDINGS Ltd. | 672.214 | -7,01 | 4.309 | -0,83 | ||||
| 2026-02-17 | 13F | Shay Capital LLC | Call | 0 | -100,00 | 0 | ||||
| 2025-11-14 | 13F | Bayesian Capital Management, LP | 0 | -100,00 | 0 | |||||
| 2026-01-22 | 13F | Red Tortoise LLC | 869 | 0,00 | 6 | 0,00 |