Basisstatistiken
| Institutionelle Eigentümer | 11 total, 11 long only, 0 short only, 0 long/short - change of 10,00% MRQ |
| Durchschnittliche Portfolioallokation | 0.0134 % - change of 21,98% MRQ |
| Institutionelle Aktien (Long) | 12.197 (ex 13D/G) - change of -0,00MM shares -3,52% MRQ |
| Institutioneller Wert (Long) | $ 2.352 USD ($1000) |
Institutioneller Eigentümerschaft und Aktionäre
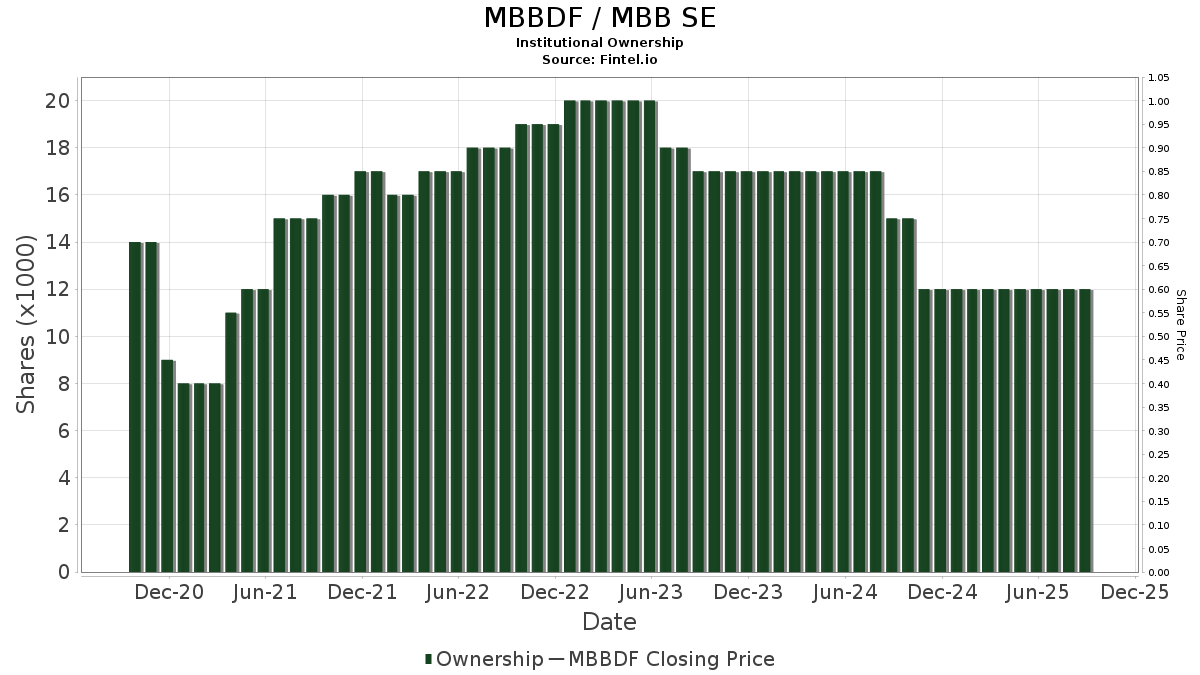
MBB SE (US:MBBDF) hat 11 institutionelle Eigentümer und Aktionäre, die 13D/G oder 13F Formulare bei der Securities Exchange Commission (SEC) eingereicht haben. Diese Institutionen halten insgesamt 12,197 Aktien. Die größten Aktionäre sind SCZ - iShares MSCI EAFE Small-Cap ETF, IEFA - iShares Core MSCI EAFE ETF, QCSTRX - Stock Account Class R1, SSEAX - SIIT Screened World Equity Ex-US Fund - Class A, OWSMX - Old Westbury Small & Mid Cap Strategies Fund, FSISX - Fidelity SAI International Small Cap Index Fund, SSGVX - State Street Global Equity ex-U.S. Index Portfolio State Street Global All Cap Equity ex-U.S. Index Portfolio, WLCTX - Wilshire International Equity Fund Investment Class, IEUS - iShares MSCI Europe Small-Cap ETF, and AVDS - Avantis International Small Cap Equity ETF .
MBB SE (OTCPK:MBBDF) Die institutionelle Eigentümerstruktur zeigt die aktuellen Positionen von Institutionen und Fonds im Unternehmen sowie die jüngsten Veränderungen der Positionsgröße. Zu den Großaktionären können Einzelanleger, Investmentfonds, Hedgefonds oder Institutionen gehören. Der Schedule 13D zeigt an, dass der Investor mehr als 5% des Unternehmens hält (oder gehalten hat) und beabsichtigt (oder beabsichtigt hat), aktiv eine Änderung der Geschäftsstrategie zu verfolgen. Schedule 13G zeigt eine passive Investition von über 5% an.
Fondsstimmung-Score
Der Fondsstimmung-Score (auch bekannt als Eigentümer-Akkumulations-Score) ermittelt die Aktien, die am meisten von Fonds gekauft werden. Er ist das Ergebnis eines ausgeklügelten quantitativen Multifaktormodells, das die Unternehmen mit den höchsten institutionellen Käufen identifiziert. Das Scoring-Modell verwendet eine Kombination aus der Gesamtzunahme der offengelegten Eigentümer, den Änderungen der Portfolioallokationen in diesen Eigentümern und anderen Metriken. Die Zahl reicht von 0 bis 100, wobei höhere Zahlen ein höheres Maß an Kapitalakkumulation als bei anderen Unternehmen anzeigen und 50 den Durchschnitt darstellt.
Aktualisierungshäufigkeit: Täglich
Siehe Ownership Explorer, der eine Liste der am höchsten bewerteten Unternehmen enthält.
AI+ Ask Fintel’s AI assistant about MBB SE.
Select a question to share a public post with an AI-crafted answer.
Thinking of good questions…
Institutionelles Put/Call-Verhältnis
Zusätzlich zur Meldung der Standardemissionen von Aktien und Schuldtiteln müssen Institute mit einem verwalteten Vermögen von mehr als 100 Mio. EUR auch ihre Bestände an Verkaufs- und Kaufoptionen offenlegen. Da Put-Optionen im Allgemeinen eine negative Stimmung und Call-Optionen eine positive Stimmung anzeigen, können wir uns ein Bild von der allgemeinen institutionellen Stimmung machen, indem wir das Verhältnis von Puts zu Calls aufzeichnen. Das Diagramm auf der rechten Seite zeigt das historische Put/Call-Verhältnis für dieses Instrument.
Die Verwendung des Put/Call-Verhältnisses als Indikator für die Anlegerstimmung überwindet einen der Hauptmängel der Verwendung des gesamten institutionellen Besitzes, der darin besteht, dass ein erheblicher Teil des verwalteten Vermögens passiv investiert wird, um Indizes abzubilden. Passiv verwaltete Fonds kaufen in der Regel keine Optionen, so dass der Indikator Put/Call-Verhältnis die Stimmung der aktiv verwalteten Fonds besser widerspiegelt.
13F und NPORT Einreichungen
Details zu 13F-Einreichungen sind kostenlos. Für Details zu NP-Einreichungen ist eine Premium-Mitgliedschaft erforderlich. Grüne Zeilen zeigen neue Positionen an. Rote Zeilen zeigen geschlossene Positionen an. Klicken Sie auf das Link Symbol, um den gesamten Transaktionsverlauf zu sehen.
Upgrade
um Prämiendaten freizuschalten und nach Excel zu exportieren ![]() .
.