Basisstatistiken
| Institutionelle Eigentümer | 72 total, 72 long only, 0 short only, 0 long/short - change of -8,86% MRQ |
| Durchschnittliche Portfolioallokation | 0.0263 % - change of -5,40% MRQ |
| Institutionelle Aktien (Long) | 3.102.774 (ex 13D/G) - change of -0,29MM shares -8,56% MRQ |
| Institutioneller Wert (Long) | $ 72.158 USD ($1000) |
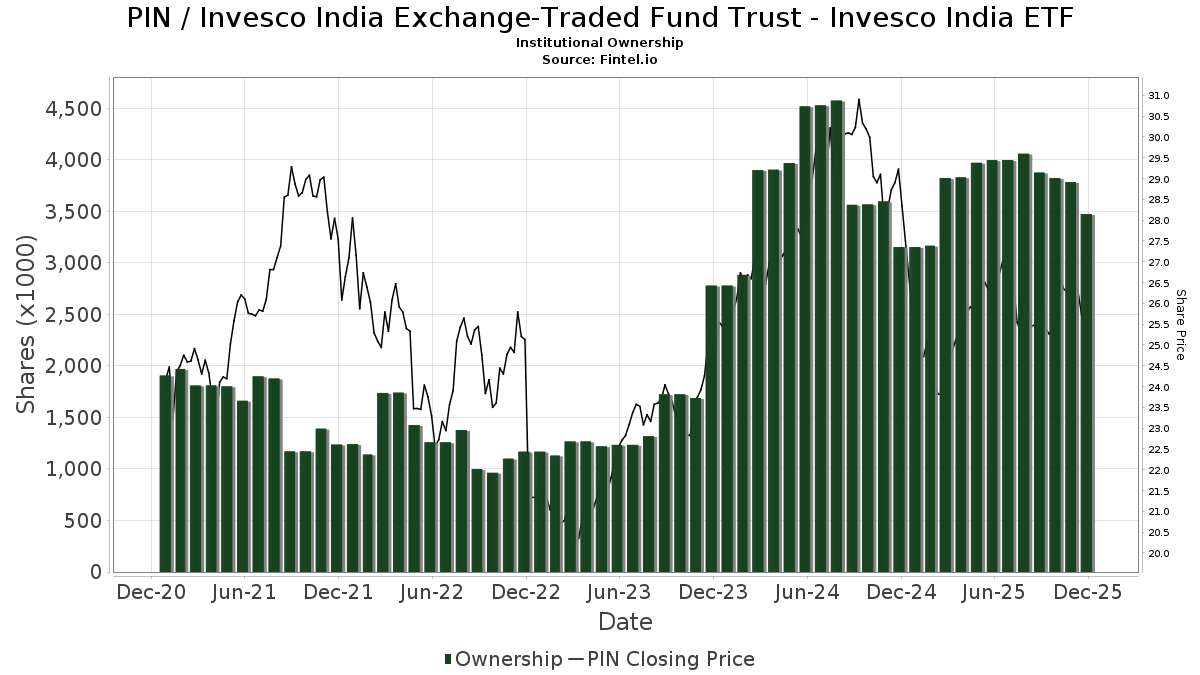
Institutioneller Eigentümerschaft und Aktionäre
Invesco India Exchange-Traded Fund Trust - Invesco India ETF (US:PIN) hat 72 institutionelle Eigentümer und Aktionäre, die 13D/G oder 13F Formulare bei der Securities Exchange Commission (SEC) eingereicht haben. Diese Institutionen halten insgesamt 3,102,774 Aktien. Die größten Aktionäre sind Bank Of America Corp /de/, McAdam, LLC, Morgan Stanley, Ameriprise Financial Inc, Arvest Investments, Inc., Wells Fargo & Company/mn, LPL Financial LLC, Jane Street Group, Llc, Brinker Capital Investments, LLC, and Sei Investments Co .
Invesco India Exchange-Traded Fund Trust - Invesco India ETF (ARCA:PIN) Die institutionelle Eigentümerstruktur zeigt die aktuellen Positionen von Institutionen und Fonds im Unternehmen sowie die jüngsten Veränderungen der Positionsgröße. Zu den Großaktionären können Einzelanleger, Investmentfonds, Hedgefonds oder Institutionen gehören. Der Schedule 13D zeigt an, dass der Investor mehr als 5% des Unternehmens hält (oder gehalten hat) und beabsichtigt (oder beabsichtigt hat), aktiv eine Änderung der Geschäftsstrategie zu verfolgen. Schedule 13G zeigt eine passive Investition von über 5% an.
The share price as of February 20, 2026 is 23,98 / share. Previously, on April 28, 2025, the share price was 25,73 / share. This represents a decline of 6,80% over that period.
Fondsstimmung-Score
Der Fondsstimmung-Score (auch bekannt als Eigentümer-Akkumulations-Score) ermittelt die Aktien, die am meisten von Fonds gekauft werden. Er ist das Ergebnis eines ausgeklügelten quantitativen Multifaktormodells, das die Unternehmen mit den höchsten institutionellen Käufen identifiziert. Das Scoring-Modell verwendet eine Kombination aus der Gesamtzunahme der offengelegten Eigentümer, den Änderungen der Portfolioallokationen in diesen Eigentümern und anderen Metriken. Die Zahl reicht von 0 bis 100, wobei höhere Zahlen ein höheres Maß an Kapitalakkumulation als bei anderen Unternehmen anzeigen und 50 den Durchschnitt darstellt.
Aktualisierungshäufigkeit: Täglich
Siehe Ownership Explorer, der eine Liste der am höchsten bewerteten Unternehmen enthält.
AI+ Ask Fintel’s AI assistant about Invesco India Exchange-Traded Fund Trust - Invesco India ETF.
Select a question to share a public post with an AI-crafted answer.
Thinking of good questions…
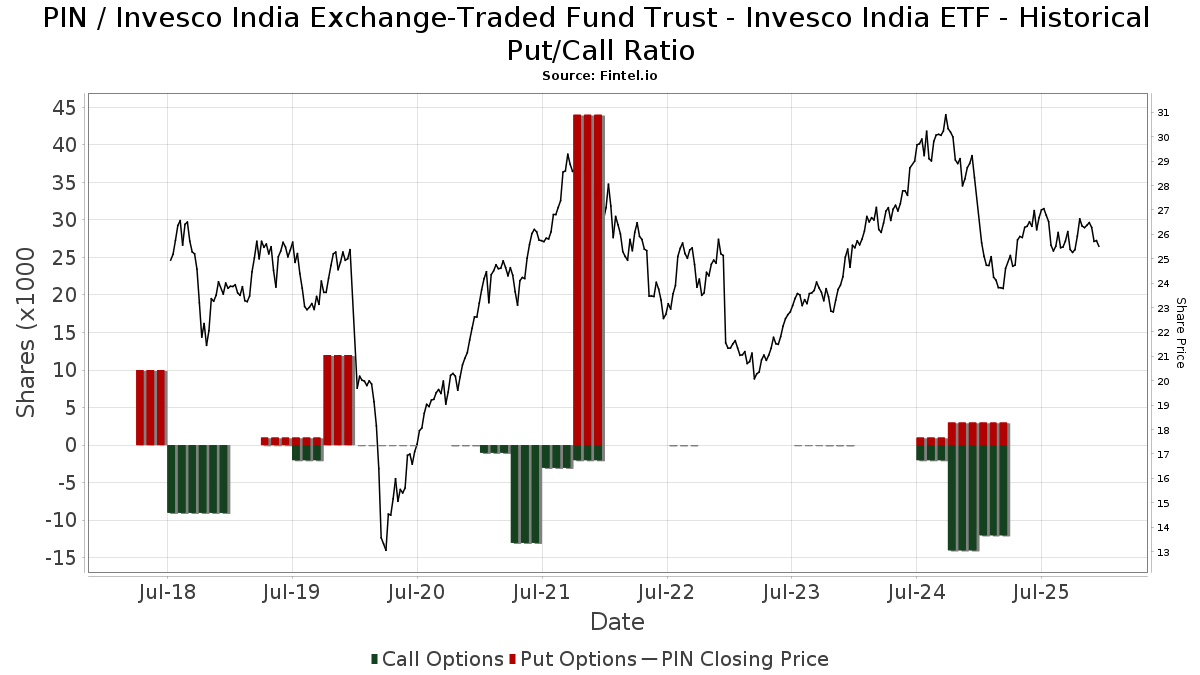
Institutionelles Put/Call-Verhältnis
Zusätzlich zur Meldung der Standardemissionen von Aktien und Schuldtiteln müssen Institute mit einem verwalteten Vermögen von mehr als 100 Mio. EUR auch ihre Bestände an Verkaufs- und Kaufoptionen offenlegen. Da Put-Optionen im Allgemeinen eine negative Stimmung und Call-Optionen eine positive Stimmung anzeigen, können wir uns ein Bild von der allgemeinen institutionellen Stimmung machen, indem wir das Verhältnis von Puts zu Calls aufzeichnen. Das Diagramm auf der rechten Seite zeigt das historische Put/Call-Verhältnis für dieses Instrument.
Die Verwendung des Put/Call-Verhältnisses als Indikator für die Anlegerstimmung überwindet einen der Hauptmängel der Verwendung des gesamten institutionellen Besitzes, der darin besteht, dass ein erheblicher Teil des verwalteten Vermögens passiv investiert wird, um Indizes abzubilden. Passiv verwaltete Fonds kaufen in der Regel keine Optionen, so dass der Indikator Put/Call-Verhältnis die Stimmung der aktiv verwalteten Fonds besser widerspiegelt.
13F und NPORT Einreichungen
Details zu 13F-Einreichungen sind kostenlos. Für Details zu NP-Einreichungen ist eine Premium-Mitgliedschaft erforderlich. Grüne Zeilen zeigen neue Positionen an. Rote Zeilen zeigen geschlossene Positionen an. Klicken Sie auf das Link Symbol, um den gesamten Transaktionsverlauf zu sehen.
Upgrade
um Prämiendaten freizuschalten und nach Excel zu exportieren ![]() .
.
| Datei Datum | Quelle | Anleger | Typ | Durchschnittlicher Preis (Est) |
Aktien | Δ Aktien (%) |
Gemeldeter Wert ($1000) |
Δ Wert (%) |
Port Alloc (%) |
|
|---|---|---|---|---|---|---|---|---|---|---|
| 2026-02-17 | 13F | Royal Bank Of Canada | 35.359 | -11,32 | 859 | -14,01 | ||||
| 2026-04-24 | 13F | National Asset Management, Inc. | 57.729 | 14,06 | 1.145 | -6,91 | ||||
| 2026-01-27 | 13F | TD Waterhouse Canada Inc. | 88 | -87,21 | 2 | -88,24 | ||||
| 2026-04-24 | 13F | Private Advisor Group, LLC | 31.868 | 4,75 | 654 | -11,50 | ||||
| 2026-02-12 | 13F | Commonwealth Equity Services, Llc | 32.830 | 9,48 | 798 | |||||
| 2026-02-17 | 13F | Ameriprise Financial Inc | 227.751 | 2,80 | 5.537 | -0,34 | ||||
| 2025-11-14 | 13F | Binnacle Investments Inc | 701 | 0,00 | 18 | -5,56 | ||||
| 2025-10-29 | 13F | Nordwand Advisors, LLC | 0 | -100,00 | 0 | |||||
| 2026-01-26 | 13F | Whittier Trust Co Of Nevada Inc | 63 | 0,00 | 2 | 0,00 | ||||
| 2026-02-13 | 13F | National Bank Of Canada /fi/ | 1.375 | 0,00 | 33 | -2,94 | ||||
| 2026-02-14 | 13F | Rockefeller Capital Management L.P. | 200 | -34,64 | 5 | -42,86 | ||||
| 2025-11-12 | 13F | Clare Market Investments LLC | 13.242 | 64,66 | 332 | 53,24 | ||||
| 2025-11-12 | 13F | Simplex Trading, Llc | 0 | -100,00 | 0 | |||||
| 2026-04-08 | 13F | Wealth Enhancement Advisory Services, Llc | 0 | -100,00 | 0 | |||||
| 2026-02-05 | 13F | Cambridge Investment Research Advisors, Inc. | 10.418 | -2,97 | 0 | |||||
| 2026-04-07 | 13F | Farther Finance Advisors, LLC | 1.521 | -40,35 | 31 | -49,18 | ||||
| 2026-02-09 | 13F | Harbour Investments, Inc. | 2 | 0 | ||||||
| 2026-02-12 | 13F | Federation des caisses Desjardins du Quebec | 1.150 | 0,00 | 28 | -3,57 | ||||
| 2026-04-06 | 13F | GAMMA Investing LLC | 0 | -100,00 | 0 | |||||
| 2026-02-09 | 13F | Hartland & Co., LLC | 86 | 7,50 | 2 | 0,00 | ||||
| 2026-02-12 | 13F | Principal Securities, Inc. | 0 | -100,00 | 0 | |||||
| 2026-02-13 | 13F | Smartleaf Asset Management LLC | 203 | 5 | ||||||
| 2026-02-06 | 13F | GPS Wealth Strategies Group, LLC | 0 | -100,00 | 0 | |||||
| 2026-02-13 | 13F | Morgan Stanley | 232.830 | 0,48 | 5.660 | -2,56 | ||||
| 2026-01-27 | 13F | Checchi Capital Advisers, LLC | 18.975 | -24,05 | 461 | -26,36 | ||||
| 2026-02-06 | 13F | HighTower Advisors, LLC | 0 | -100,00 | 0 | |||||
| 2026-02-13 | 13F | Neuberger Berman Group LLC | 67.148 | 0,21 | 1.632 | -2,80 | ||||
| 2026-02-17 | 13F | Russell Investments Group, Ltd. | 146 | 0,00 | 4 | 0,00 | ||||
| 2026-02-11 | 13F | Parallel Advisors, LLC | 10 | 0,00 | 0 | |||||
| 2025-11-14 | 13F | Equitable Holdings, Inc. | 0 | -100,00 | 0 | |||||
| 2026-02-13 | 13F | Sei Investments Co | 72.042 | -3,34 | 1.751 | -6,26 | ||||
| 2025-11-13 | 13F | Riggs Asset Managment Co. Inc. | 0 | -100,00 | 0 | |||||
| 2026-02-13 | 13F | Golden State Wealth Management, LLC | 264 | 6,02 | 6 | 0,00 | ||||
| 2026-02-13 | 13F | Resources Investment Advisors, LLC. | 15.695 | -10,32 | 382 | -13,01 | ||||
| 2026-04-08 | 13F | Birchbrook, Inc. | 227 | 0,00 | 5 | -20,00 | ||||
| 2026-02-12 | 13F | Sepio Capital, LP | 44.851 | 7,39 | 1.090 | 4,11 | ||||
| 2025-11-12 | 13F | Stifel Financial Corp | 0 | -100,00 | 0 | |||||
| 2026-04-13 | 13F | IFP Advisors, Inc | 100 | 0,00 | 2 | 0,00 | ||||
| 2026-02-13 | 13F | Pinnacle Wealth Planning Services, Inc. | 150 | 4 | ||||||
| 2026-02-17 | 13F | Advisor Group Holdings, Inc. | 12.452 | -24,84 | 303 | -27,23 | ||||
| 2026-02-13 | 13F | Wells Fargo & Company/mn | 153.936 | -2,70 | 3.742 | -5,65 | ||||
| 2026-01-30 | 13F | Bogart Wealth, LLC | 38 | 0,00 | 1 | |||||
| 2026-02-12 | 13F | Jane Street Group, Llc | 121.787 | -26,92 | 2.961 | -29,15 | ||||
| 2026-04-20 | 13F | Ronald Blue Trust, Inc. | 28.138 | -14,36 | 578 | -27,69 | ||||
| 2026-02-13 | 13F | Integrated Wealth Concepts LLC | 59.863 | 4,44 | 1.455 | 1,32 | ||||
| 2026-02-17 | 13F | Jones Financial Companies Lllp | 24.194 | -10,25 | 588 | -13,27 | ||||
| 2026-01-23 | 13F | Westside Investment Management, Inc. | 116 | 3 | ||||||
| 2026-02-17 | 13F | Cetera Investment Advisers | 68.000 | 8,05 | 1.653 | 4,82 | ||||
| 2026-02-05 | 13F | Allworth Financial LP | 1 | -99,93 | 0 | -100,00 | ||||
| 2026-02-13 | 13F | MAI Capital Management | 58 | 0,00 | 1 | 0,00 | ||||
| 2026-02-17 | 13F | Old Mission Capital Llc | 16.659 | 405 | ||||||
| 2026-04-14 | 13F | Arvest Investments, Inc. | 197.842 | 41,87 | 4.062 | 19,79 | ||||
| 2025-11-14 | 13F | Mpwm Advisory Solutions, Llc | 0 | -100,00 | 0 | |||||
| 2026-02-17 | 13F | Bank Of America Corp /de/ | 695.041 | -1,14 | 16.896 | -4,14 | ||||
| 2026-04-03 | 13F | Adirondack Trust Co | 0 | -100,00 | 0 | -100,00 | ||||
| 2026-04-08 | 13F | Sharper & Granite LLC | 10.380 | -17,72 | 213 | -30,39 | ||||
| 2026-04-14 | 13F | Nbc Securities, Inc. | 104 | 0,00 | 2 | 0,00 | ||||
| 2026-02-12 | 13F | Brinker Capital Investments, LLC | 77.804 | -6,20 | 1.891 | -9,04 | ||||
| 2026-02-10 | 13F | IAG Wealth Partners, LLC | 1.195 | 7,46 | 29 | 7,41 | ||||
| 2026-02-13 | 13F | Ieq Capital, Llc | 29.525 | 0,00 | 718 | -3,11 | ||||
| 2026-02-17 | 13F | Raymond James Financial Inc | 22.739 | -2,95 | 553 | -5,96 | ||||
| 2026-02-17 | 13F | Citadel Advisors Llc | 45.921 | -4,69 | 1.116 | -7,54 | ||||
| 2026-01-27 | 13F | Krilogy Financial LLC | 0 | -100,00 | 0 | |||||
| 2026-01-05 | 13F | Union Bancaire Privee, UBP SA | 0 | -100,00 | 0 | |||||
| 2026-02-12 | 13F | Collier Financial | 0 | -100,00 | 0 | |||||
| 2026-02-13 | 13F | Barclays Plc | 0 | -100,00 | 0 | |||||
| 2026-04-21 | 13F | Washington Growth Strategies Llc | 11.163 | 0,00 | 229 | -15,50 | ||||
| 2026-02-05 | 13F | Bessemer Group Inc | 124 | 0,00 | 0 | |||||
| 2026-02-06 | 13F | Global Retirement Partners, LLC | 13.003 | 147,68 | 316 | 141,22 | ||||
| 2025-11-03 | 13F | Truist Financial Corp | 0 | -100,00 | 0 | |||||
| 2026-02-13 | 13F | Mml Investors Services, Llc | 21.820 | -93,63 | 530 | -93,83 | ||||
| 2025-11-07 | 13F | Fifth Third Bancorp | 0 | -100,00 | 0 | -100,00 | ||||
| 2026-02-12 | 13F | Steward Partners Investment Advisory, Llc | 1.923 | 491,69 | 47 | 475,00 | ||||
| 2026-04-13 | 13F | Creative Financial Designs Inc /adv | 169 | 0,00 | 3 | -25,00 | ||||
| 2026-02-17 | 13F | Fmr Llc | 2.286 | -1,00 | 56 | -3,51 | ||||
| 2026-02-13 | 13F | Kestra Advisory Services, LLC | 0 | -100,00 | 0 | |||||
| 2026-02-10 | 13F | Envestnet Asset Management Inc | 17.834 | 1,86 | 434 | -1,14 | ||||
| 2026-02-13 | 13F | McAdam, LLC | 292.967 | 24,43 | 7.122 | 20,67 | ||||
| 2026-02-11 | 13F | LPL Financial LLC | 126.348 | -39,81 | 3.072 | -41,64 | ||||
| 2026-02-17 | 13F | Wiley Bros.-aintree Capital, Llc | 59.057 | 1,44 | 1.436 | -1,64 | ||||
| 2026-04-15 | 13F | Weatherly Asset Management L. P. | 38.866 | 17,77 | 798 | -0,62 | ||||
| 2026-02-13 | 13F | Citigroup Inc | 1.614 | -82,86 | 39 | -83,47 | ||||
| 2026-01-29 | 13F | Comerica Bank | 1.088 | -1,54 | 26 | -3,70 | ||||
| 2026-01-26 | 13F | Cwm, Llc | 69 | -26,60 | 0 | |||||
| 2026-02-13 | 13F | Flow Traders U.s. Llc | 60.131 | -33,53 | 1 | -50,00 | ||||
| 2026-04-21 | 13F | Yoffe Investment Management, LLC | 16.402 | 0,00 | 337 | -15,58 | ||||
| 2026-02-10 | 13F/A | Northwestern Mutual Wealth Management Co | 3.503 | 1,48 | 85 | -1,16 | ||||
| 2026-02-18 | 13F | GWM Advisors LLC | 571 | 6,13 | 14 | 0,00 | ||||
| 2026-02-17 | 13F | Consultiva Wealth Management, Corp. | 115 | 0,00 | 3 | 0,00 | ||||
| 2026-02-19 | 13F | Invesco Ltd. | 0 | -100,00 | 0 | |||||
| 2026-01-29 | 13F | UBS Group AG | 903 | -67,33 | 22 | -69,57 | ||||
| 2025-11-20 | 13F | Centaurus Financial, Inc. | 0 | -100,00 | 0 | |||||
| 2025-11-06 | 13F | Ameritas Advisory Services, LLC | 0 | -100,00 | 0 | |||||
| 2026-02-17 | 13F | Advisory Services Network, LLC | 0 | -100,00 | 0 | |||||
| 2026-02-11 | 13F | Strategic Advocates LLC | 1 | 0 |
Other Listings
| US:IMVP | 21,56 $ |