Starbucks Corporation
In portfolio
| Security | SBUX / Starbucks Corporation |
| Institution | NorthRock Partners, LLC |
| Latest Disclosed Ownership | 23,626 shares |
| Latest Disclosed Value | $ 2,414,346 |
NorthRock Partners, LLC ownership in SBUX / Starbucks Corporation
IMPORTANT: This company has reported a 1 to 2 split as of 2015-04-09. The ownership data on this page IS NOT adjusted for this split. It is incumbent upon the reader to determine if this split affects this data and adjust the figures appropriately. Our engineering team is working on a solution to provide split-adjusted figures in the future.
NorthRock Partners, LLC has a history of taking positions in derivatives of the underlying security (SBUX) in the form of stock options.
Institutional Ownership: 13F and NPORT Filings
The Security and Class in the table below are shown exactly as filed by the investor. We do our best to track continuity of investments through acquisitions, and this will be reflected in the table as changes in names. In addition to descriptive data, performance of the investment is shown over time. To calculate quarterly performance, we first calculate cost basis of the shares purchased during the quarter, then use that to calculate gross profit. Quarterly return is Gross Profit / Starting Portfolio value.
Note that cost basis is calculated and stored in thousands, so small quarterly changes in shares frequently result in a cost basis of zero.
Upgrade
to unlock premium data and export to Excel  .
Institutional Put/Call Ratios
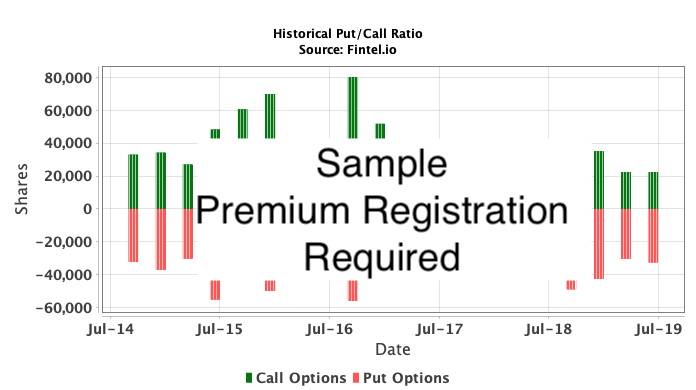
(Premium Subscription Required)In addition to reporting standard equity and debt issues, institutions with more than 100MM assets under management must also disclose their put and call option holdings. Since put options generally indicate negative sentiment, and call options indicate positive sentiment, we can get a sense of the overall institutional sentiment by plotting the ratio of puts to calls. The chart to the right plots the historical put/call ratio for this instrument.
Using Put/Call Ratio as an indicator of investor sentiment overcomes one of the key deficiencies of using total institutional ownership, which is that a significant amount of assets under management are invested passively to track indices. Passively-managed funds do not typically buy options, so the put/call ratio indicator more closely tracks the sentiment of actively-managed funds.
Disclosed Equity Positions (from 13F/NPORT Filings)
| File Date |
Effective Date | Form | Security | Class | ID | Avg Price Paid (Est) |
Reported Shares |
ΔShares | ΔShares (%) |
Reported Value (x1000) |
ΔValue (%) |
Alloc (%) |
ΔAlloc | ΔAlloc (%) | Cost Basis (x1000) |
Unrealized Gain/Loss (x1000) |
|---|---|---|---|---|---|---|---|---|---|---|---|---|---|---|---|---|
| 2026-08-11 | 2026-06-30 | 13F | STARBUCKS | COM | 855244109 | 23,626 | 2,806 | 13.48 | 2,414 | 29.44 | 0.0350 | |||||
| 2026-05-15 | 2026-03-31 | 13F | STARBUCKS | COM | 855244109 | 20,820 | 3,430 | 19.72 | 1,865 | 27.39 | 0.0301 | |||||
| 2026-02-17 | 2025-12-31 | 13F | STARBUCKS | COM | 855244109 | 17,390 | -12,293 | -41.41 | 1,464 | -41.70 | 0.0247 | |||||
| 2025-11-14 | 2025-09-30 | 13F | STARBUCKS | COM | 855244109 | 29,683 | 4,601 | 18.34 | 2,511 | 9.27 | 0.0453 | |||||
| 2025-11-14 | 2025-06-30 | 13F/A-1 | STARBUCKS | COM | 855244109 | 25,082 | -1,307 | -4.95 | 2,298 | -11.21 | 0.0599 | |||||
| 2025-07-25 | 2025-06-30 | 13F | STARBUCKS | COM | 855244109 | 25,082 | -1,307 | 2,298 | 0.0594 | |||||||
| 2025-05-08 | 2025-03-31 | 13F | STARBUCKS | COM | 855244109 | 26,389 | 507 | 1.96 | 2,588 | 9.61 | 0.0869 | |||||
| 2025-04-22 | 2024-12-31 | 13F/A-1 | STARBUCKS | COM | 855244109 | 25,882 | -3,408 | -11.64 | 2,362 | -17.30 | 0.0769 | |||||
| 2025-02-14 | 2024-12-31 | 13F | STARBUCKS | COM | 855244109 | 25,902 | -3,388 | 2,364 | 0.0773 | |||||||
| 2025-04-22 | 2024-09-30 | 13F/A-1 | STARBUCKS | COM | 855244109 | 29,290 | -13 | -0.04 | 2,855 | 25.16 | 0.0939 | |||||
| 2024-10-30 | 2024-09-30 | 13F | STARBUCKS | COM | 855244109 | 9,436 | -19,867 | 920 | 0.0813 | |||||||
| 2025-04-22 | 2024-06-30 | 13F/A-1 | STARBUCKS | COM | 855244109 | 29,303 | -5,199 | -15.07 | 2,281 | -27.66 | 0.0858 | |||||
| 2024-08-06 | 2024-06-30 | 13F | STARBUCKS | COM | 855244109 | 9,542 | -24,960 | 743 | 0.0665 | |||||||
| 2025-04-22 | 2024-03-31 | 13F/A-1 | STARBUCKS | COM | 855244109 | 34,502 | 5,639 | 19.54 | 3,153 | 13.79 | 0.1210 | |||||
| 2024-05-07 | 2024-03-31 | 13F | STARBUCKS | COM | 855244109 | 14,599 | -14,264 | 1,334 | 0.1129 | |||||||
| 2025-04-22 | 2023-12-31 | 13F/A-1 | STARBUCKS | COM | 855244109 | 28,863 | 13,958 | 93.65 | 2,771 | 103.75 | 0.1159 | |||||
| 2024-02-08 | 2023-12-31 | 13F | STARBUCKS | COM | 855244109 | 12,372 | -2,533 | 1,188 | 0.1108 | |||||||
| 2023-10-24 | 2023-09-30 | 13F | STARBUCKS | COM | 855244109 | 14,905 | 5,094 | 51.92 | 1,360 | 40.06 | 0.1419 | |||||
| 2023-08-02 | 2023-06-30 | 13F | STARBUCKS | COM | 855244109 | 9,811 | -1,245 | -11.26 | 972 | -15.64 | 0.1064 | |||||
| 2023-05-04 | 2023-03-31 | 13F | STARBUCKS | COM | 855244109 | 11,056 | -619 | -5.30 | 1,151 | -0.60 | 0.1225 | |||||
| 2023-02-01 | 2022-12-31 | 13F | STARBUCKS | COM | 855244109 | 11,675 | -1,578 | -11.91 | 1,158 | 3.67 | 0.1318 | |||||
| 2022-11-02 | 2022-09-30 | 13F | STARBUCKS | COM | 855244109 | 13,253 | 492 | 3.86 | 1,117 | 14.56 | 0.1298 | |||||
| 2022-08-04 | 2022-06-30 | 13F | STARBUCKS | COM | 855244109 | 12,761 | -166 | -1.28 | 975 | -17.09 | 0.1013 | |||||
| 2022-05-05 | 2022-03-31 | 13F | STARBUCKS | COM | 855244109 | 12,927 | -1,914 | -12.90 | 1,176 | -32.26 | 0.1058 | |||||
| 2022-02-07 | 2021-12-31 | 13F | STARBUCKS | COM | 855244109 | 14,841 | 1,128 | 8.23 | 1,736 | 14.74 | 0.1300 | |||||
| 2021-11-12 | 2021-09-30 | 13F | STARBUCKS | COM | 855244109 | 13,713 | 1,116 | 8.86 | 1,513 | 7.38 | 0.1237 | |||||
| 2021-08-12 | 2021-06-30 | 13F | STARBUCKS | COM | 855244109 | 12,597 | 221 | 1.79 | 1,409 | 4.22 | 0.1177 | |||||
| 2021-05-11 | 2021-03-31 | 13F | STARBUCKS | COM | 855244109 | 12,376 | 417 | 3.49 | 1,352 | 5.71 | 0.1230 | |||||
| 2021-02-08 | 2020-12-31 | 13F | STARBUCKS | COM | 855244109 | 11,959 | -475 | -3.82 | 1,279 | 19.76 | 0.1260 | |||||
| 2020-11-12 | 2020-09-30 | 13F | STARBUCKS | COM | 855244109 | 12,434 | -1,277 | -9.31 | 1,068 | 5.85 | 0.1185 | |||||
| 2020-08-13 | 2020-06-30 | 13F/A-1 | STARBUCKS | COM | 855244109 | 13,711 | 2,459 | 21.85 | 1,009 | 36.35 | 0.1195 | |||||
| 2020-08-11 | 2020-06-30 | 13F | STARBUCKS | COM | 855244109 | 13,705 | 2,453 | 1,009 | 119,473.1813 | |||||||
| 2020-05-13 | 2020-03-31 | 13F | STARBUCKS | COM | 855244109 | 11,252 | -1,589 | -12.37 | 740 | -34.46 | 0.1036 | |||||
| 2020-02-12 | 2019-12-31 | 13F/A-1 | STARBUCKS | COM | 855244109 | 12,841 | 3,150 | 32.50 | 1,129 | 31.74 | 0.1193 | |||||
| 2020-02-12 | 2019-12-31 | 13F | STARBUCKS | COM | 855244109 | 115,847 | 106,156 | 1,129 | 119,260.8993 | |||||||
| 2019-11-12 | 2019-09-30 | 13F | STARBUCKS | COM | 855244109 | 9,691 | 2,085 | 27.41 | 857 | 34.12 | 0.1168 | |||||
| 2019-08-12 | 2019-06-30 | 13F | STARBUCKS | COM | 855244109 | 7,606 | -205 | -2.62 | 639 | 9.79 | 0.1827 | |||||
| 2019-05-14 | 2019-03-31 | 13F | STARBUCKS | COM | 855244109 | 7,811 | -1,144 | -12.77 | 582 | 1.04 | 0.1534 | |||||
| 2019-02-13 | 2018-12-31 | 13F | STARBUCKS | COM | 855244109 | 8,955 | 283 | 3.26 | 576 | 16.84 | 0.1717 | |||||
| 2018-11-13 | 2018-09-30 | 13F | STARBUCKS | COM | 855244109 | 8,672 | 0 | 0.00 | 493 | 16.00 | 0.1420 | |||||
| 2018-08-13 | 2018-06-30 | 13F | STARBUCKS | COM | 855244109 | 8,672 | 112 | 1.31 | 425 | -14.49 | 0.1450 | |||||
| 2018-05-15 | 2018-03-31 | 13F | STARBUCKS | COM | 855244109 | 8,560 | 8,560 | 497 | 0.1618 |
Disclosed Put Options
| File Date |
Effective Date | Form | Security | Class | ID | Opt | Avg Share Price | Shares | ΔShares (%) |
Value (x1000) |
ΔValue (%) |
Prior Allocation (%) |
Allocation (%) |
ΔAllocation (%) |
Cost Basis (x1000) |
Profit (x1000) |
Return (%) |
|---|---|---|---|---|---|---|---|---|---|---|---|---|---|---|---|---|---|
| 2026-08-11 | 2026-06-30 | STARBUCKS | COM | Put | 0 | -100.00 | 0 | -100.00 | n/a | n/a | n/a | ||||||
| 2026-05-15 | 2026-03-31 | STARBUCKS | COM | Put | 200 | 18 | n/a | n/a | n/a |
Legend
- Shares
- The total number of shares held by the institution at the end of the reporting period (the effective date). This is provided in the filing.
- Value
- The total value of the shares as of the effective date. This is provided in the filing.
- Avg. Share Price
- The weighted average share price of the shares held by the institution. We use FIFO accounting to determine this price
- Class
- This is the security class as indicated by the filer. There are a variety of values for this field. Common values include "EC" = equity common, "EP" - equity preferred
- Allocation (%)
- The percent of the institution's portfolio that this position represents. This is provided in NPORT filings. For 13F filings, we calculate it.
- Change in Allocation
- The change in allocation from the prior reporting period. This is calculated as current allocation - prior allocation.
- Change in Allocation (%)
- The percent change in allocation from the prior reporting period. This is calculated as (current allocation - prior allocation) / prior allocation.
- Cost Basis
- The total cost of the shares held. This is calculated as reported shares * avg. share price
- Unrealized Gain/Loss
- This is the market value of the position as of the effective date minus the cost basis.


