Basisstatistiken
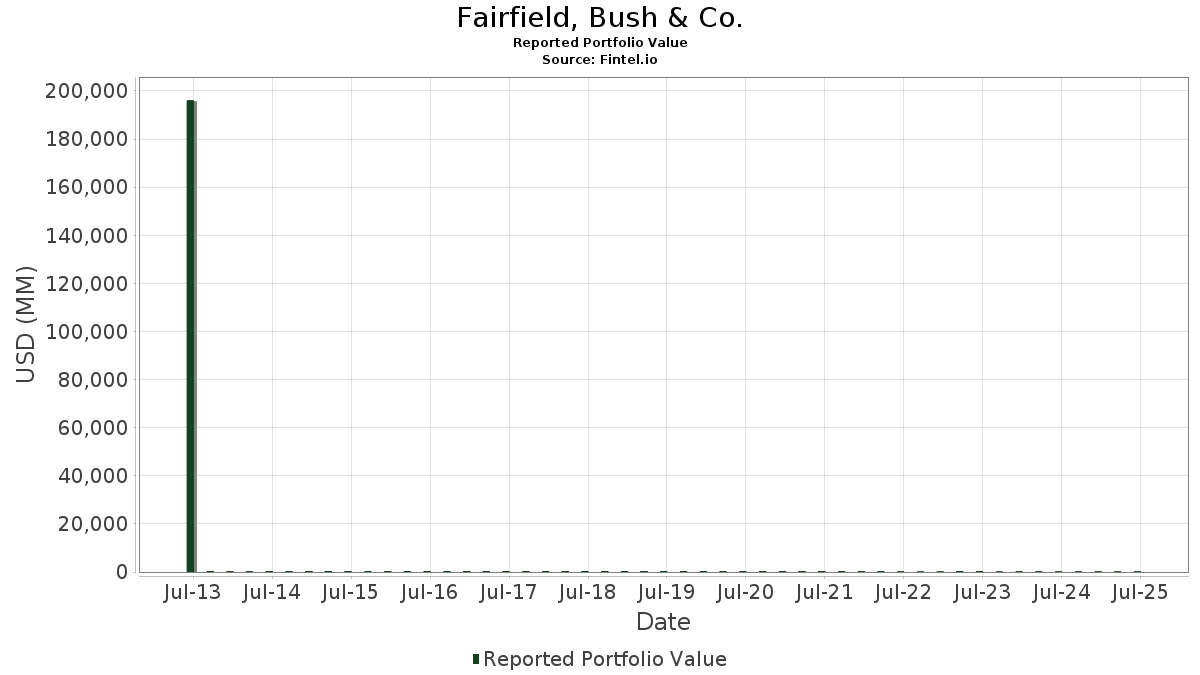
| Portfolio-Wert | $ 194.779.745 |
| Aktuelle Positionen | 120 |
Neueste Bestände, Performance, AUM (aus 13F, 13D)
Fairfield, Bush & Co. hat 120 Gesamtbeteiligungen in seinen letzten SEC-Einreichungen offengelegt. Der jüngste Portfoliowert wird auf $ 194.779.745 USD berechnet. Das tatsächliche verwaltete Vermögen (AUM) ist dieser Wert plus Barmittel (die nicht offengelegt werden). Fairfield, Bush & Co.s Top-Bestände sind Microsoft Corporation (US:MSFT) , Oracle Corporation (US:ORCL) , Amazon.com, Inc. (US:AMZN) , Taiwan Semiconductor Manufacturing Company Limited - Depositary Receipt (Common Stock) (US:TSM) , and Broadcom Inc. (US:AVGO) . Fairfield, Bush & Co.s neue Positionen sind iShares Trust - iShares 20+ Year Treasury Bond ETF (US:TLT) , Rocket Companies, Inc. (US:RKT) , Schwab Strategic Trust - Schwab High Yield Bond ETF (US:SCYB) , Schwab Strategic Trust - Schwab U.S. Small-Cap ETF (US:SCHA) , and VanEck ETF Trust - VanEck Africa Index ETF (US:AFK) .
Top-Zuwächse in diesem Quartal
Wir verwenden die Veränderung der Portfolioallokation, weil dies die aussagekräftigste Kennzahl ist. Die Änderungen können auf Trades oder Änderungen der Aktienkurse zurückzuführen sein.
| Wertpapier | Aktien (MM) |
Wert (MM$) |
Portfolio % | ΔPortfolio % |
|---|---|---|---|---|
| ORCL / Oracle Corporation | 0,04 | 12,19 | 6,2587 | 0,7816 |
| GOOG / Alphabet Inc. | 0,03 | 8,16 | 4,1870 | 0,7574 |
| TLT / iShares Trust - iShares 20+ Year Treasury Bond ETF | 0,01 | 0,78 | 0,4000 | 0,4000 |
| ANET / Arista Networks, Inc. | 0,02 | 3,12 | 1,6007 | 0,3517 |
| RKT / Rocket Companies, Inc. | 0,02 | 0,45 | 0,2324 | 0,2324 |
| AAPL / Apple Inc. | 0,02 | 5,03 | 2,5807 | 0,2246 |
| METC / Ramaco Resources, Inc. | 0,01 | 0,40 | 0,2054 | 0,2054 |
| AVGO / Broadcom Inc. | 0,03 | 8,62 | 4,4268 | 0,1848 |
| SCYB / Schwab Strategic Trust - Schwab High Yield Bond ETF | 0,01 | 0,31 | 0,1586 | 0,1586 |
| TSM / Taiwan Semiconductor Manufacturing Company Limited - Depositary Receipt (Common Stock) | 0,03 | 9,03 | 4,6336 | 0,1541 |
Top-Rückgänge in diesem Quartal
Wir verwenden die Veränderung der Portfolioallokation, weil dies die aussagekräftigste Kennzahl ist. Änderungen können auf Handelsgeschäfte oder Änderungen der Aktienkurse zurückzuführen sein.
| Wertpapier | Aktien (MM) |
Wert (MM$) |
Portfolio % | ΔPortfolio % |
|---|---|---|---|---|
| AMZN / Amazon.com, Inc. | 0,04 | 9,37 | 4,8127 | -0,5457 |
| MSFT / Microsoft Corporation | 0,03 | 13,59 | 6,9789 | -0,4910 |
| INTU / Intuit Inc. | 0,00 | 2,28 | 1,1703 | -0,3425 |
| ADBE / Adobe Inc. | 0,00 | 0,92 | 0,4747 | -0,2673 |
| PM / Philip Morris International Inc. | 0,01 | 2,18 | 1,1193 | -0,2647 |
| CRWD / CrowdStrike Holdings, Inc. | 0,01 | 3,11 | 1,5990 | -0,2367 |
| CHD / Church & Dwight Co., Inc. | 0,02 | 2,17 | 1,1162 | -0,2306 |
| HON / Honeywell International Inc. | 0,01 | 1,64 | 0,8426 | -0,2100 |
| JPM / JPMorgan Chase & Co. | 0,02 | 5,81 | 2,9806 | -0,1815 |
| NVO / Novo Nordisk A/S - Depositary Receipt (Common Stock) | 0,02 | 0,97 | 0,4994 | -0,1720 |
13F und Fondseinreichungen
Dieses Formular wurde am 2025-11-14 für den Berichtszeitraum eingereicht 2025-09-30. Klicken Sie auf das Link-Symbol , um den gesamten Transaktionsverlauf zu sehen.
Upgrade um die Prämiendaten zu entsperren und nach Excel zu exportieren ![]() .
.
| Wertpapier | Typ | Durchschnittlicher Aktienkurs | Aktien (MM) |
ΔAktien (%) |
Wert ($MM) |
ΔAktien (%) |
Portfolio (%) |
ΔPortfolio (%) |
|
|---|---|---|---|---|---|---|---|---|---|
| MSFT / Microsoft Corporation | 0,03 | -1,21 | 13,59 | 2,87 | 6,9789 | -0,4910 | |||
| ORCL / Oracle Corporation | 0,04 | -2,20 | 12,19 | 25,81 | 6,2587 | 0,7816 | |||
| AMZN / Amazon.com, Inc. | 0,04 | -1,19 | 9,37 | -1,11 | 4,8127 | -0,5457 | |||
| TSM / Taiwan Semiconductor Manufacturing Company Limited - Depositary Receipt (Common Stock) | 0,03 | -7,64 | 9,03 | 13,89 | 4,6336 | 0,1541 | |||
| AVGO / Broadcom Inc. | 0,03 | -4,00 | 8,62 | 14,90 | 4,4268 | 0,1848 | |||
| ADM / Archer-Daniels-Midland Company | 0,14 | -1,64 | 8,25 | 11,33 | 4,2333 | 0,0468 | |||
| GOOG / Alphabet Inc. | 0,03 | -2,10 | 8,16 | 34,42 | 4,1870 | 0,7574 | |||
| JPM / JPMorgan Chase & Co. | 0,02 | -4,62 | 5,81 | 3,79 | 2,9806 | -0,1815 | |||
| AAPL / Apple Inc. | 0,02 | -2,83 | 5,03 | 20,59 | 2,5807 | 0,2246 | |||
| LOW / Lowe's Companies, Inc. | 0,02 | 0,93 | 4,15 | 14,31 | 2,1323 | 0,0787 | |||
| QCOM / QUALCOMM Incorporated | 0,02 | -0,90 | 4,14 | 3,52 | 2,1276 | -0,1352 | |||
| WMT / Walmart Inc. | 0,04 | -3,05 | 3,63 | 2,20 | 1,8611 | -0,1441 | |||
| SHOP / Shopify Inc. | 0,02 | -6,00 | 3,27 | 21,09 | 1,6807 | 0,1528 | |||
| NFLX / Netflix, Inc. | 0,00 | 12,54 | 3,23 | 0,75 | 1,6576 | -0,1538 | |||
| ANET / Arista Networks, Inc. | 0,02 | -0,93 | 3,12 | 41,10 | 1,6007 | 0,3517 | |||
| CRWD / CrowdStrike Holdings, Inc. | 0,01 | -0,39 | 3,11 | -4,10 | 1,5990 | -0,2367 | |||
| NVS / Novartis AG - Depositary Receipt (Common Stock) | 0,02 | -5,66 | 2,93 | -0,03 | 1,5047 | -0,1523 | |||
| CVX / Chevron Corporation | 0,02 | -5,16 | 2,85 | 2,85 | 1,4630 | -0,1030 | |||
| RY / Royal Bank of Canada | 0,02 | -1,37 | 2,85 | 10,44 | 1,4609 | 0,0046 | |||
| LH / Labcorp Holdings Inc. | 0,01 | -0,43 | 2,82 | 8,89 | 1,4460 | -0,0162 | |||
| NVDD / Direxion Shares ETF Trust - Direxion Daily NVDA Bear 1X Shares | 0,01 | -3,25 | 2,66 | 14,29 | 1,3678 | 0,0498 | |||
| CCJ / Cameco Corporation | 0,03 | 5,20 | 2,35 | 18,83 | 1,2059 | 0,0888 | |||
| GE / General Electric Company | 0,01 | -8,09 | 2,31 | 7,41 | 1,1837 | -0,0296 | |||
| INTU / Intuit Inc. | 0,00 | -1,77 | 2,28 | -14,84 | 1,1703 | -0,3425 | |||
| LLY / Eli Lilly and Company | 0,00 | 4,64 | 2,26 | 2,41 | 1,1580 | -0,0869 | |||
| PM / Philip Morris International Inc. | 0,01 | -0,01 | 2,18 | -10,95 | 1,1193 | -0,2647 | |||
| CHD / Church & Dwight Co., Inc. | 0,02 | 0,08 | 2,17 | -8,73 | 1,1162 | -0,2306 | |||
| XOM / Exxon Mobil Corporation | 0,02 | 4,32 | 2,05 | 9,11 | 1,0517 | -0,0095 | |||
| ASML / ASML Holding N.V. - Depositary Receipt (Common Stock) | 0,00 | -2,33 | 2,03 | 18,01 | 1,0427 | 0,0697 | |||
| MRKCL / Merck & Co., Inc. | 0,02 | 20,79 | 1,94 | 28,06 | 0,9935 | 0,1394 | |||
| JNJ / Johnson & Johnson | 0,01 | -3,59 | 1,87 | 16,99 | 0,9584 | 0,0567 | |||
| PEP / PepsiCo, Inc. | 0,01 | -0,22 | 1,70 | 6,11 | 0,8734 | -0,0328 | |||
| HON / Honeywell International Inc. | 0,01 | -2,49 | 1,64 | -11,87 | 0,8426 | -0,2100 | |||
| GEV / GE Vernova Inc. | 0,00 | 9,04 | 1,63 | 26,73 | 0,8375 | 0,1098 | |||
| UNP / Union Pacific Corporation | 0,01 | 0,00 | 1,50 | 2,75 | 0,7682 | -0,0551 | |||
| AMD / Advanced Micro Devices, Inc. | 0,01 | -3,57 | 1,49 | 9,94 | 0,7668 | -0,0011 | |||
| ABBV / AbbVie Inc. | 0,01 | 2,53 | 1,43 | 27,87 | 0,7330 | 0,1019 | |||
| SJM / The J. M. Smucker Company | 0,01 | -2,70 | 1,43 | 7,62 | 0,7330 | -0,0170 | |||
| IBM / International Business Machines Corporation | 0,00 | -3,22 | 1,38 | -7,38 | 0,7090 | -0,1338 | |||
| NOW / ServiceNow, Inc. | 0,00 | 6,35 | 1,31 | -4,80 | 0,6723 | -0,1052 | |||
| GLD_KZ / SPDR Gold Shares | 0,00 | -5,21 | 1,29 | 10,52 | 0,6636 | 0,0026 | |||
| WRB / W. R. Berkley Corporation | 0,02 | 0,47 | 1,18 | 4,78 | 0,6082 | -0,0309 | |||
| AMGN / Amgen Inc. | 0,00 | 3,34 | 1,14 | 4,51 | 0,5833 | -0,0316 | |||
| PANW / Palo Alto Networks, Inc. | 0,01 | 2,72 | 1,12 | 2,20 | 0,5728 | -0,0442 | |||
| REGN / Regeneron Pharmaceuticals, Inc. | 0,00 | -14,45 | 1,05 | -8,36 | 0,5401 | -0,1089 | |||
| LMT / Lockheed Martin Corporation | 0,00 | 6,55 | 1,01 | 14,84 | 0,5210 | 0,0216 | |||
| UBER / Uber Technologies, Inc. | 0,01 | 4,46 | 1,01 | 9,71 | 0,5168 | -0,0019 | |||
| TMO / Thermo Fisher Scientific Inc. | 0,00 | 14,63 | 1,00 | 37,21 | 0,5150 | 0,1015 | |||
| PLTR / Palantir Technologies Inc. | 0,01 | -16,18 | 0,99 | 12,22 | 0,5094 | 0,0094 | |||
| NVO / Novo Nordisk A/S - Depositary Receipt (Common Stock) | 0,02 | 1,87 | 0,97 | -18,11 | 0,4994 | -0,1720 | |||
| GNRC / Generac Holdings Inc. | 0,01 | -0,98 | 0,95 | 15,71 | 0,4879 | 0,0238 | |||
| DHR / Danaher Corporation | 0,00 | -6,69 | 0,93 | -6,28 | 0,4755 | -0,0835 | |||
| ADBE / Adobe Inc. | 0,00 | -22,75 | 0,92 | -29,57 | 0,4747 | -0,2673 | |||
| PSX / Phillips 66 | 0,01 | -11,87 | 0,91 | 0,44 | 0,4655 | -0,0446 | |||
| FITB / Fifth Third Bancorp | 0,02 | -0,96 | 0,90 | 7,28 | 0,4618 | -0,0121 | |||
| VTI / Vanguard Index Funds - Vanguard Total Stock Market ETF | 0,00 | -12,83 | 0,86 | -5,83 | 0,4396 | -0,0746 | |||
| BHP / BHP Group Limited - Depositary Receipt (Common Stock) | 0,01 | -1,27 | 0,83 | 14,34 | 0,4261 | 0,0162 | |||
| NTR / Nutrien Ltd. | 0,01 | -3,21 | 0,79 | -2,35 | 0,4057 | -0,0521 | |||
| V / Visa Inc. | 0,00 | -2,76 | 0,78 | -6,47 | 0,4007 | -0,0712 | |||
| TLT / iShares Trust - iShares 20+ Year Treasury Bond ETF | 0,01 | 0,78 | 0,4000 | 0,4000 | |||||
| PFE / Pfizer Inc. | 0,03 | -6,96 | 0,76 | -2,18 | 0,3926 | -0,0494 | |||
| GOOG / Alphabet Inc. | 0,00 | -11,07 | 0,75 | 22,82 | 0,3842 | 0,0394 | |||
| LHX / L3Harris Technologies, Inc. | 0,00 | -4,06 | 0,72 | 16,86 | 0,3704 | 0,0213 | |||
| DIS / The Walt Disney Company | 0,01 | 0,00 | 0,63 | -7,76 | 0,3239 | -0,0623 | |||
| BK / The Bank of New York Mellon Corporation | 0,01 | -0,43 | 0,62 | 18,89 | 0,3204 | 0,0241 | |||
| CAT / Caterpillar Inc. | 0,00 | -1,67 | 0,56 | 21,08 | 0,2891 | 0,0257 | |||
| IWR / iShares Trust - iShares Russell Mid-Cap ETF | 0,01 | -0,17 | 0,56 | 4,72 | 0,2852 | -0,0144 | |||
| CMG / Chipotle Mexican Grill, Inc. | 0,01 | -2,05 | 0,53 | -31,63 | 0,2743 | -0,1675 | |||
| ALL / The Allstate Corporation | 0,00 | -5,78 | 0,52 | 0,38 | 0,2695 | -0,0259 | |||
| AXP / American Express Company | 0,00 | 0,00 | 0,52 | 4,17 | 0,2694 | -0,0154 | |||
| RSP / Invesco Exchange-Traded Fund Trust - Invesco S&P 500 Equal Weight ETF | 0,00 | -0,37 | 0,52 | 4,03 | 0,2653 | -0,0156 | |||
| VUG / Vanguard Index Funds - Vanguard Growth ETF | 0,00 | 0,00 | 0,51 | 9,42 | 0,2627 | -0,0016 | |||
| DUK / Duke Energy Corporation | 0,00 | 10,18 | 0,51 | 15,68 | 0,2614 | 0,0123 | |||
| VO / Vanguard Index Funds - Vanguard Mid-Cap ETF | 0,00 | 0,00 | 0,47 | 4,88 | 0,2433 | -0,0119 | |||
| CSX / CSX Corporation | 0,01 | -2,98 | 0,46 | 5,71 | 0,2377 | -0,0102 | |||
| ILMN / Illumina, Inc. | 0,00 | -7,01 | 0,45 | -7,55 | 0,2330 | -0,0441 | |||
| RKT / Rocket Companies, Inc. | 0,02 | 0,45 | 0,2324 | 0,2324 | |||||
| KBE / SPDR Series Trust - State Street SPDR S&P Bank ETF | 0,01 | 61,91 | 0,42 | 72,73 | 0,2148 | 0,0777 | |||
| CSCO / Cisco Systems, Inc. | 0,01 | 23,66 | 0,40 | 21,88 | 0,2063 | 0,0201 | |||
| METC / Ramaco Resources, Inc. | 0,01 | 0,40 | 0,2054 | 0,2054 | |||||
| BRK.B / Berkshire Hathaway Inc. | 0,00 | -6,53 | 0,40 | -3,42 | 0,2031 | -0,0281 | |||
| RTX / RTX Corporation | 0,00 | -1,07 | 0,39 | 13,24 | 0,1979 | 0,0057 | |||
| DE / Deere & Company | 0,00 | 10,14 | 0,37 | -1,06 | 0,1913 | -0,0214 | |||
| VFH / Vanguard World Fund - Vanguard Financials ETF | 0,00 | -0,25 | 0,37 | 2,79 | 0,1897 | -0,0134 | |||
| BAC / Bank of America Corporation | 0,01 | 0,00 | 0,36 | 9,17 | 0,1833 | -0,0018 | |||
| COST / Costco Wholesale Corporation | 0,00 | 11,63 | 0,36 | 4,41 | 0,1826 | -0,0100 | |||
| USB / U.S. Bancorp | 0,01 | 0,00 | 0,34 | 6,85 | 0,1766 | -0,0054 | |||
| SCHD / Schwab Strategic Trust - Schwab U.S. Dividend Equity ETF | 0,01 | 4,59 | 0,34 | 7,96 | 0,1742 | -0,0038 | |||
| MCD / McDonald's Corporation | 0,00 | -0,18 | 0,33 | 3,76 | 0,1704 | -0,0103 | |||
| SHY / iShares Trust - iShares 1-3 Year Treasury Bond ETF | 0,00 | 0,00 | 0,32 | 0,32 | 0,1618 | -0,0161 | |||
| BX / Blackstone Inc. | 0,00 | -10,17 | 0,31 | 2,66 | 0,1588 | -0,0116 | |||
| SCYB / Schwab Strategic Trust - Schwab High Yield Bond ETF | 0,01 | 0,31 | 0,1586 | 0,1586 | |||||
| GJR / Strats Trust For Procter & Gambel Security - Preferred Security | 0,00 | 0,00 | 0,30 | -3,49 | 0,1563 | -0,0221 | |||
| MO / Altria Group, Inc. | 0,00 | -2,65 | 0,30 | 9,78 | 0,1556 | -0,0006 | |||
| VOO / Vanguard Index Funds - Vanguard S&P 500 ETF | 0,00 | -1,20 | 0,30 | 6,34 | 0,1553 | -0,0052 | |||
| IVV / iShares Trust - iShares Core S&P 500 ETF | 0,00 | 0,00 | 0,30 | 7,89 | 0,1546 | -0,0033 | |||
| KMI / Kinder Morgan, Inc. | 0,01 | 0,00 | 0,29 | -3,65 | 0,1491 | -0,0214 | |||
| QQQ / Invesco QQQ Trust, Series 1 | 0,00 | 0,21 | 0,29 | 9,02 | 0,1491 | -0,0016 | |||
| FI / Fiserv, Inc. | 0,00 | 0,29 | 0,1481 | 0,1481 | |||||
| HOOD / Robinhood Markets, Inc. | 0,00 | -28,08 | 0,28 | 9,92 | 0,1425 | -0,0002 | |||
| GILD / Gilead Sciences, Inc. | 0,00 | 0,00 | 0,27 | 0,37 | 0,1383 | -0,0138 | |||
| VRTX / Vertex Pharmaceuticals Incorporated | 0,00 | -2,89 | 0,26 | -14,66 | 0,1349 | -0,0390 | |||
| GEHC / GE HealthCare Technologies Inc. | 0,00 | 0,26 | 0,1315 | 0,1315 | |||||
| EMR / Emerson Electric Co. | 0,00 | -0,52 | 0,25 | -2,36 | 0,1278 | -0,0160 | |||
| GSCE / GS Connect S&P GSCI Enhanced Commodity Total Return ETN | 0,00 | 0,00 | 0,25 | 12,33 | 0,1267 | 0,0027 | |||
| CB / Chubb Limited | 0,00 | 0,00 | 0,24 | -2,46 | 0,1224 | -0,0159 | |||
| TRV / The Travelers Companies, Inc. | 0,00 | 0,00 | 0,23 | 4,48 | 0,1198 | -0,0066 | |||
| MU / Micron Technology, Inc. | 0,00 | 0,23 | 0,1170 | 0,1170 | |||||
| SNOW / Snowflake Inc. | 0,00 | 0,00 | 0,23 | 0,44 | 0,1170 | -0,0108 | |||
| TIP / iShares Trust - iShares TIPS Bond ETF | 0,00 | 0,00 | 0,23 | 0,90 | 0,1159 | -0,0104 | |||
| SBR / Sabine Royalty Trust | 0,00 | -29,74 | 0,22 | -16,03 | 0,1132 | -0,0353 | |||
| ITW / Illinois Tool Works Inc. | 0,00 | 0,00 | 0,22 | 5,83 | 0,1121 | -0,0049 | |||
| VZ / Verizon Communications Inc. | 0,00 | 0,22 | 0,1114 | 0,1114 | |||||
| SCHA / Schwab Strategic Trust - Schwab U.S. Small-Cap ETF | 0,01 | 0,22 | 0,1108 | 0,1108 | |||||
| AMT / American Tower Corporation | 0,00 | -2,19 | 0,21 | -14,74 | 0,1100 | -0,0323 | |||
| KMB / Kimberly-Clark Corporation | 0,00 | 0,21 | 0,1063 | 0,1063 | |||||
| MRVL / Marvell Technology, Inc. | 0,00 | 0,21 | 0,1056 | 0,1056 | |||||
| AFK / VanEck ETF Trust - VanEck Africa Index ETF | 0,00 | 0,20 | 0,1049 | 0,1049 | |||||
| NEOG / Neogen Corporation | 0,02 | -0,47 | 0,12 | 18,63 | 0,0625 | 0,0046 | |||
| TE / T1 Energy Inc. | 0,01 | 0,00 | 0,03 | 81,25 | 0,0153 | 0,0058 | |||
| FIS / Fidelity National Information Services, Inc. | 0,00 | -100,00 | 0,00 | -100,00 | -0,1334 | ||||
| XYZ / Block, Inc. | 0,00 | -100,00 | 0,00 | -100,00 | -0,1134 |