Basisstatistiken
| Institutionelle Aktien (Long) | 86.854.711 - 28,86% (ex 13D/G) - change of 11,18MM shares 14,77% MRQ |
| Institutioneller Wert (Long) | $ 208.271 USD ($1000) |
Institutioneller Eigentümerschaft und Aktionäre
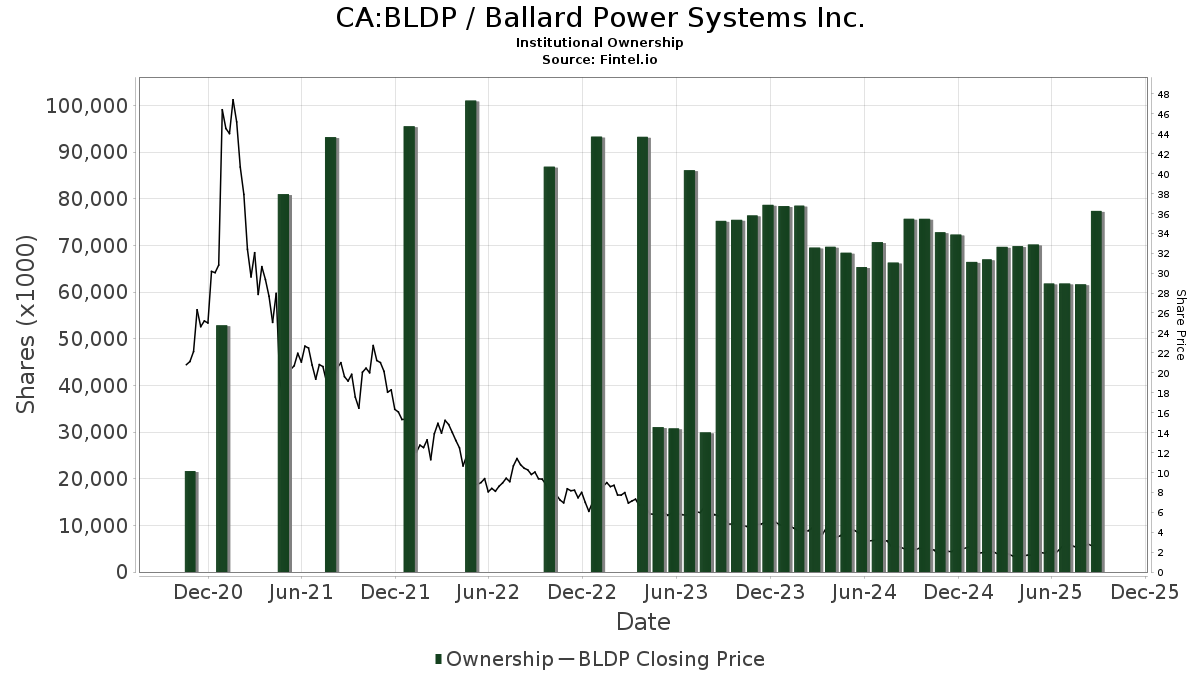
Ballard Power Systems Inc. (CA:BLDP) hat 144 institutionelle Eigentümer und Aktionäre, die 13D/G oder 13F Formulare bei der Securities Exchange Commission (SEC) eingereicht haben. Diese Institutionen halten insgesamt 86,854,711 Aktien. Die größten Aktionäre sind Morgan Stanley, Two Sigma Investments, Lp, Legal & General Group Plc, Two Sigma Advisers, Lp, Invesco Ltd., D. E. Shaw & Co., Inc., State Street Corp, Bnp Paribas Arbitrage, Sa, Citadel Advisors Llc, and UBS Group AG .
Ballard Power Systems Inc. (TSX:BLDP) Die institutionelle Eigentümerstruktur zeigt die aktuellen Positionen von Institutionen und Fonds im Unternehmen sowie die jüngsten Veränderungen der Positionsgröße. Zu den Großaktionären können Einzelanleger, Investmentfonds, Hedgefonds oder Institutionen gehören. Der Schedule 13D zeigt an, dass der Investor mehr als 5% des Unternehmens hält (oder gehalten hat) und beabsichtigt (oder beabsichtigt hat), aktiv eine Änderung der Geschäftsstrategie zu verfolgen. Schedule 13G zeigt eine passive Investition von über 5% an.
The share price as of April 17, 2026 is 4,04 / share. Previously, on April 21, 2025, the share price was 1,52 / share. This represents an increase of 165,79% over that period.
Fondsstimmung-Score
Der Fondsstimmung-Score (auch bekannt als Eigentümer-Akkumulations-Score) ermittelt die Aktien, die am meisten von Fonds gekauft werden. Er ist das Ergebnis eines ausgeklügelten quantitativen Multifaktormodells, das die Unternehmen mit den höchsten institutionellen Käufen identifiziert. Das Scoring-Modell verwendet eine Kombination aus der Gesamtzunahme der offengelegten Eigentümer, den Änderungen der Portfolioallokationen in diesen Eigentümern und anderen Metriken. Die Zahl reicht von 0 bis 100, wobei höhere Zahlen ein höheres Maß an Kapitalakkumulation als bei anderen Unternehmen anzeigen und 50 den Durchschnitt darstellt.
Aktualisierungshäufigkeit: Täglich
Siehe Ownership Explorer, der eine Liste der am höchsten bewerteten Unternehmen enthält.
AI+ Ask Fintel’s AI assistant about Ballard Power Systems Inc..
Select a question to share a public post with an AI-crafted answer.
Thinking of good questions…
13F und NPORT Einreichungen
Details zu 13F-Einreichungen sind kostenlos. Für Details zu NP-Einreichungen ist eine Premium-Mitgliedschaft erforderlich. Grüne Zeilen zeigen neue Positionen an. Rote Zeilen zeigen geschlossene Positionen an. Klicken Sie auf das Link Symbol, um den gesamten Transaktionsverlauf zu sehen.
Upgrade
um Prämiendaten freizuschalten und nach Excel zu exportieren ![]() .
.
| Datei Datum | Quelle | Anleger | Typ | Durchschnittlicher Preis (Est) |
Aktien | Δ Aktien (%) |
Gemeldeter Wert ($1000) |
Δ Wert (%) |
Port Alloc (%) |
|
|---|---|---|---|---|---|---|---|---|---|---|
| 2026-02-11 | 13F | Simplex Trading, Llc | 0 | -100,00 | 0 | |||||
| 2026-02-10 | 13F | CIBC Asset Management Inc | 34.749 | 89 | ||||||
| 2026-02-17 | 13F | Aquatic Capital Management LLC | 497.046 | 1.262 | ||||||
| 2026-02-09 | 13F | Huntington National Bank | 2.301 | 0,00 | 6 | -16,67 | ||||
| 2026-01-23 | 13F | Westside Investment Management, Inc. | 2.000 | 0,00 | 5 | 0,00 | ||||
| 2026-02-06 | 13F | Leonteq Securities AG | 120.936 | -22,79 | 319 | -30,50 | ||||
| 2026-02-12 | 13F | Groupe la Francaise | 0 | -100,00 | 0 | |||||
| 2026-01-12 | 13F | Salem Investment Counselors Inc | 0 | -100,00 | 0 | |||||
| 2026-02-17 | 13F | Schonfeld Strategic Advisors LLC | 35.751 | 91 | ||||||
| 2026-02-17 | 13F | Toronto Dominion Bank | 23.940 | -46,59 | 61 | -49,59 | ||||
| 2025-11-14 | 13F | Wolverine Trading, Llc | Call | 55.800 | 153 | |||||
| 2025-11-14 | 13F | Wolverine Trading, Llc | Put | 27.400 | 75 | |||||
| 2026-02-12 | 13F | Hrt Financial Lp | 12.240 | -89,36 | 0 | |||||
| 2026-02-13 | 13F | Citigroup Inc | 21.579 | -3,17 | 55 | -8,33 | ||||
| 2026-02-13 | 13F | Police & Firemen's Retirement System of New Jersey | 92.597 | 236 | ||||||
| 2026-02-12 | 13F | Bank Of Montreal /can/ | 49.374 | 43,30 | 126 | 34,41 | ||||
| 2026-02-13 | 13F | Morgan Stanley | 12.793.799 | 129,14 | 32.496 | 113,97 | ||||
| 2026-01-22 | 13F | Financial Consulate, Inc | 100 | 0,00 | 0 | |||||
| 2026-02-12 | 13F | Alps Advisors Inc | 357.702 | -6,13 | 909 | -12,36 | ||||
| 2026-02-19 | 13F | Invesco Ltd. | 4.968.824 | 48,62 | 12.621 | 38,79 | ||||
| 2026-02-10 | 13F | Goldman Sachs Group Inc | 1.652.874 | -58,04 | 4.198 | -60,82 | ||||
| 2026-04-07 | 13F | CoreCap Advisors, LLC | 1.000 | 0,00 | 2 | 0,00 | ||||
| 2026-02-13 | 13F | Stifel Financial Corp | 92.406 | -2,56 | 235 | -8,95 | ||||
| 2026-02-17 | 13F | Millennium Management Llc | 2.414.800 | 16,97 | 6.142 | 9,68 | ||||
| 2026-02-17 | 13F | Amundi | 207.296 | -6,53 | 527 | -34,98 | ||||
| 2026-01-29 | 13F | Vanguard Group Inc | 244.319 | 623 | ||||||
| 2026-02-17 | 13F | Clear Street Markets Llc | 0 | -100,00 | 0 | |||||
| 2026-01-29 | 13F | UBS Group AG | 2.825.009 | -17,75 | 7.176 | -23,19 | ||||
| 2026-02-23 | 13F | Virtu Financial LLC | 0 | -100,00 | 0 | |||||
| 2026-02-13 | 13F | Vontobel Holding Ltd. | 46.097 | 27,70 | 118 | 20,62 | ||||
| 2026-02-04 | 13F | Swiss Life Asset Management Ltd | 10.147 | 26 | ||||||
| 2026-01-30 | 13F | Sigma Planning Corp | 15.093 | -0,63 | 38 | -7,32 | ||||
| 2026-02-13 | 13F | Kilter Group LLC | 500 | -33,33 | 1 | -50,00 | ||||
| 2026-02-17 | 13F | Raymond James Financial Inc | 14.943 | 16,30 | 38 | 8,82 | ||||
| 2026-01-26 | 13F | Cwm, Llc | 100 | 0,00 | 0 | |||||
| 2025-11-13 | 13F | Acadian Asset Management Llc | 0 | -100,00 | 0 | |||||
| 2026-02-17 | 13F | Two Sigma Investments, Lp | 6.769.185 | 7,74 | 17.194 | 0,61 | ||||
| 2026-02-09 | 13F | Harbour Investments, Inc. | 397 | 0,00 | 1 | 0,00 | ||||
| 2026-02-10 | 13F | State of Wyoming | 0 | -100,00 | 0 | |||||
| 2026-04-10 | 13F | Quaker Wealth Management, LLC | 15 | 0,00 | 0 | |||||
| 2026-02-11 | 13F | Simplex Trading, Llc | Call | 210.200 | 142,17 | 534 | ||||
| 2026-02-13 | 13F | Great West Life Assurance Co /can/ | 1.834.806 | -33,67 | 5 | -42,86 | ||||
| 2026-02-17 | 13F | DZ BANK AG Deutsche Zentral Genossenschafts Bank, Frankfurt am Main | 0 | -100,00 | 0 | |||||
| 2026-02-13 | 13F | MAI Capital Management | 0 | -100,00 | 0 | |||||
| 2026-02-17 | 13F | Gotham Asset Management, LLC | 0 | -100,00 | 0 | -100,00 | ||||
| 2026-03-06 | 13F | Hsbc Holdings Plc | 151.574 | 24,37 | 385 | 16,36 | ||||
| 2026-04-13 | 13F | Clayton Financial Group LLC | 852 | 0,00 | 2 | 0,00 | ||||
| 2026-02-06 | 13F | Banque Cantonale Vaudoise | 51.384 | -41,70 | 131 | |||||
| 2026-02-17 | 13F | Occudo Quantitative Strategies Lp | 100.023 | 254 | ||||||
| 2026-02-17 | 13F | Engineers Gate Manager LP | 125.995 | 320 | ||||||
| 2026-02-02 | 13F | Benjamin Edwards Inc | 167.550 | 1,92 | 426 | -4,92 | ||||
| 2026-02-13 | 13F | Itau Unibanco Holding S.A. | 0 | -100,00 | 0 | |||||
| 2026-02-13 | 13F | Walleye Capital LLC | Call | 100 | 0 | |||||
| 2026-02-13 | 13F | Walleye Capital LLC | Put | 14.200 | 36 | |||||
| 2026-04-07 | 13F | Signaturefd, Llc | 0 | -100,00 | 0 | |||||
| 2026-02-13 | 13F | Walleye Capital LLC | 442.763 | 1.866,61 | 1.125 | 1.742,62 | ||||
| 2026-02-17 | 13F | Graham Capital Management, L.P. | 144.145 | 43,85 | 366 | 34,56 | ||||
| 2026-02-13 | 13F | MYDA Advisors LLC | 0 | -100,00 | 0 | |||||
| 2026-02-10 | 13F | Daiwa Securities Group Inc. | 24.099 | -28,23 | 0 | |||||
| 2026-02-11 | 13F | Simplex Trading, Llc | Put | 9.400 | -13,76 | 24 | ||||
| 2026-02-13 | 13F | JustInvest LLC | 24.107 | -4,05 | 61 | -10,29 | ||||
| 2026-02-06 | 13F | Pnc Financial Services Group, Inc. | 1.600 | 0,00 | 4 | 0,00 | ||||
| 2026-02-12 | 13F | Federation des caisses Desjardins du Quebec | 66.075 | -5,71 | 168 | -9,68 | ||||
| 2026-02-06 | 13F | ProShare Advisors LLC | 56.784 | 99,61 | 144 | 87,01 | ||||
| 2026-02-13 | 13F | Headlands Technologies LLC | 407.189 | -3,42 | 1.034 | -9,77 | ||||
| 2026-02-13 | 13F | Caitong International Asset Management Co., Ltd | 6.193 | 115,41 | 16 | 114,29 | ||||
| 2025-11-06 | 13F | Endowment Wealth Management, Inc. | 0 | -100,00 | 0 | -100,00 | ||||
| 2026-02-17 | 13F | SIG North Trading, ULC | Call | 100.800 | -33,16 | 256 | -37,56 | |||
| 2026-02-12 | 13F | Douglass Winthrop Advisors, LLC | 11.000 | 0,00 | 28 | -6,90 | ||||
| 2026-02-17 | 13F | Fmr Llc | 702 | 0,00 | 2 | 0,00 | ||||
| 2026-02-13 | 13F | Hudson Bay Capital Management LP | 0 | -100,00 | 0 | |||||
| 2026-02-18 | 13F | Mackenzie Financial Corp | 240.494 | 63,98 | 613 | 54,41 | ||||
| 2025-11-07 | 13F | Skandinaviska Enskilda Banken AB (publ) | 0 | -100,00 | 0 | |||||
| 2026-02-17 | 13F | XTX Topco Ltd | 372.895 | 1.074,36 | 947 | 1.001,16 | ||||
| 2026-02-03 | 13F | McIlrath & Eck, LLC | 96 | 0,00 | 0 | |||||
| 2026-02-10 | 13F/A | Northwestern Mutual Wealth Management Co | 46 | 0 | ||||||
| 2026-03-12 | 13F/A | Peak6 Llc | Call | 1.401.000 | -31,92 | 3.559 | -36,43 | |||
| 2026-04-06 | 13F | CX Institutional | 300 | 0 | ||||||
| 2026-02-10 | 13F | Belvedere Trading LLC | 0 | -100,00 | 0 | |||||
| 2026-02-06 | 13F | EverSource Wealth Advisors, LLC | 942 | 64,97 | 2 | 100,00 | ||||
| 2026-02-12 | 13F | Swiss National Bank | 506.100 | 1.293 | ||||||
| 2026-02-17 | 13F | SIG North Trading, ULC | 46.338 | -22,29 | 118 | -27,78 | ||||
| 2026-02-12 | 13F | Dimensional Fund Advisors Lp | 1.547.865 | 69,66 | 3.932 | 58,44 | ||||
| 2026-02-17 | 13F | SIG North Trading, ULC | Put | 53.000 | -10,32 | 135 | -16,25 | |||
| 2026-02-17 | 13F | Royal Bank Of Canada | 328.326 | -87,65 | 835 | -88,45 | ||||
| 2026-02-10 | 13F | Td Asset Management Inc | 349.341 | 6,39 | 892 | 0,22 | ||||
| 2026-01-21 | 13F | Sound Income Strategies, LLC | 906 | 0,00 | 3 | -33,33 | ||||
| 2026-02-05 | 13F | Baader Bank INC | 0 | -100,00 | 0 | -100,00 | ||||
| 2026-02-13 | 13F/A | Ontario Teachers Pension Plan Board | 0 | -100,00 | 0 | |||||
| 2026-02-17 | 13F | Susquehanna International Group, Llp | Put | 152.600 | 8,30 | 388 | 1,04 | |||
| 2025-11-14 | 13F | Mount Yale Investment Advisors, LLC | 0 | -100,00 | 0 | |||||
| 2026-02-17 | 13F | Susquehanna International Group, Llp | Call | 852.900 | 144,38 | 2.166 | 128,24 | |||
| 2026-01-07 | 13F | Aventura Private Wealth, LLC | 0 | -100,00 | 0 | -100,00 | ||||
| 2026-04-07 | 13F | Farther Finance Advisors, LLC | 200 | 100,00 | 0 | |||||
| 2026-02-17 | 13F | Russell Investments Group, Ltd. | 7.741 | 20 | ||||||
| 2026-02-17 | 13F/A | Intesa Sanpaolo S.p.a. | 11.150 | 28 | ||||||
| 2026-02-12 | 13F | Marex Group plc | 152.761 | 0,00 | 388 | -6,51 | ||||
| 2026-02-12 | 13F | Steward Partners Investment Advisory, Llc | 1.859 | 0,00 | 5 | -20,00 | ||||
| 2026-02-17 | 13F | Susquehanna International Group, Llp | 99.204 | -72,09 | 252 | -74,02 | ||||
| 2026-04-15 | 13F | Murphy, Middleton, Hinkle & Parker, Inc. | 0 | -100,00 | 0 | |||||
| 2026-02-17 | 13F | Public Employees Retirement System Of Ohio | 65.675 | 168 | ||||||
| 2026-02-06 | 13F | Tortoise Investment Management, LLC | 0 | -100,00 | 0 | |||||
| 2026-02-17 | 13F | Tower Research Capital LLC (TRC) | 20.713 | 144,95 | 53 | 126,09 | ||||
| 2026-02-17 | 13F | Qube Research & Technologies Ltd | 1.018.323 | 2.587 | ||||||
| 2026-01-30 | 13F | Us Bancorp \de\ | 77 | 0,00 | 0 | |||||
| 2026-02-13 | 13F | Van Eck Associates Corp | 2.270.333 | -3,19 | 6 | -16,67 | ||||
| 2026-02-05 | 13F | Allworth Financial LP | 325 | 0,00 | 1 | |||||
| 2026-04-16 | 13F | SG Americas Securities, LLC | 57.100 | -62,97 | 0 | |||||
| 2025-11-07 | 13F | Shell Asset Management Co | 0 | -100,00 | 0 | |||||
| 2025-11-03 | 13F | Mirae Asset Global Investments Co., Ltd. | 0 | -100,00 | 0 | -100,00 | ||||
| 2026-02-05 | 13F | Freemont Management S.A. | 30.000 | 0,00 | 76 | -6,17 | ||||
| 2025-11-14 | 13F | Credit Agricole S A | 0 | -100,00 | 0 | |||||
| 2026-02-17 | 13F | Bank Of America Corp /de/ | 333.775 | 241,66 | 848 | 219,62 | ||||
| 2026-04-09 | 13F | Pacifica Partners Inc. | 100 | 0 | ||||||
| 2026-04-17 | 13F | Bell Investment Advisors, Inc | 255 | 1 | ||||||
| 2026-02-17 | 13F | Jump Financial, LLC | 40.650 | 103 | ||||||
| 2026-02-17 | 13F | MIRAE ASSET GLOBAL ETFS HOLDINGS Ltd. | 2.762.046 | 62,59 | 7.016 | 51,64 | ||||
| 2026-01-27 | 13F | Zurcher Kantonalbank (Zurich Cantonalbank) | 1.202.472 | -17,34 | 3.070 | -22,10 | ||||
| 2026-02-13 | 13F | Wells Fargo & Company/mn | 6.830 | -15,90 | 17 | -19,05 | ||||
| 2026-02-17 | 13F | Voleon Capital Management Lp | 56.654 | 144 | ||||||
| 2026-02-03 | 13F | Mitsubishi UFJ Kokusai Asset Management Co., Ltd. | 606.241 | -46,54 | 1.625 | -47,34 | ||||
| 2026-02-17 | 13F | Fairscale Capital, LLC | 500 | 1 | ||||||
| 2026-02-11 | 13F | Group One Trading, L.p. | Put | 11.700 | 72,06 | 30 | 61,11 | |||
| 2026-02-10 | 13F | Bnp Paribas Arbitrage, Sa | 3.993.972 | 204,51 | 10.145 | 184,38 | ||||
| 2026-02-11 | 13F | Group One Trading, L.p. | Call | 280.500 | 12,56 | 712 | 5,17 | |||
| 2026-02-11 | 13F | Group One Trading, L.p. | 14.560 | -94,68 | 37 | -95,16 | ||||
| 2026-02-12 | 13F | Scotia Capital Inc. | 95.344 | 648,38 | 242 | 633,33 | ||||
| 2026-01-28 | 13F | WPG Advisers, LLC | 418 | 0,00 | 1 | 0,00 | ||||
| 2026-02-11 | 13F | LPL Financial LLC | 86.133 | 2,47 | 219 | -4,39 | ||||
| 2026-02-26 | 13F/A | Banque Transatlantique SA | 665 | 0,00 | 2 | 0,00 | ||||
| 2025-11-05 | 13F | Sherman Asset Management, Inc. | 0 | -100,00 | 0 | |||||
| 2026-02-12 | 13F | Nuveen, LLC | 180.638 | 461 | ||||||
| 2026-02-13 | 13F | Arete Wealth Advisors, LLC | 0 | -100,00 | 0 | |||||
| 2026-02-13 | 13F | Motiv8 Investments LLC | 100 | 0 | ||||||
| 2026-02-14 | 13F | Rockefeller Capital Management L.P. | 10.000 | 228,08 | 25 | 212,50 | ||||
| 2026-02-12 | 13F | Jane Street Group, Llc | Call | 24.800 | 19,23 | 63 | 10,71 | |||
| 2026-02-12 | 13F | Jane Street Group, Llc | 2.290.146 | 273,52 | 5.817 | 248,89 | ||||
| 2026-02-17 | 13F | Balyasny Asset Management Llc | 0 | -100,00 | 0 | |||||
| 2026-03-23 | 13F | J. Derek Lewis & Associates Inc. | 46.000 | 117 | ||||||
| 2025-11-14 | 13F | Susquehanna Advisors Group, Inc. | 0 | -100,00 | 0 | -100,00 | ||||
| 2026-01-26 | 13F | Northwest Capital Management Inc | 0 | -100,00 | 0 | |||||
| 2026-02-17 | 13F | Citadel Advisors Llc | Put | 50.800 | -23,26 | 129 | -28,33 | |||
| 2026-01-14 | 13F | Spire Wealth Management | 0 | -100,00 | 0 | |||||
| 2026-02-17 | 13F | Citadel Advisors Llc | Call | 158.100 | 191,16 | 402 | 172,79 | |||
| 2026-01-28 | 13F | DekaBank Deutsche Girozentrale | 15.071 | 0,00 | 0 | |||||
| 2026-02-17 | 13F | Citadel Advisors Llc | 3.598.614 | 215,53 | 9.140 | 194,65 | ||||
| 2026-02-09 | 13F | Gs Investments, Inc. | 125 | 0,00 | 0 | |||||
| 2026-02-17 | 13F | First Commonwealth Financial Corp /pa/ | 14.881 | 38 | ||||||
| 2026-02-17 | 13F | Scientech Research LLC | 0 | -100,00 | 0 | |||||
| 2026-02-10 | 13F | Bruni J V & Co /co | 135.470 | -33,19 | 344 | -37,57 | ||||
| 2026-01-16 | 13F | DiNuzzo Private Wealth, Inc. | 0 | -100,00 | 0 | |||||
| 2026-02-17 | 13F | D. E. Shaw & Co., Inc. | 4.953.075 | 492,63 | 12.592 | 454,47 | ||||
| 2025-11-17 | 13F | Triumph Capital Management | 50 | 0 | ||||||
| 2026-01-16 | 13F | Crewe Advisors LLC | 50 | 0,00 | 0 | |||||
| 2026-02-09 | 13F | Geode Capital Management, Llc | 380.369 | 85,29 | 968 | 73,30 | ||||
| 2026-02-12 | 13F | Commonwealth Equity Services, Llc | 58.554 | -3,67 | 149 | |||||
| 2026-02-13 | 13F | Golden State Wealth Management, LLC | 0 | -100,00 | 0 | |||||
| 2026-02-17 | 13F | Optiver Holding B.V. | 0 | -100,00 | 0 | |||||
| 2026-01-22 | 13F | Apollon Wealth Management, LLC | 14.450 | 0,00 | 37 | -7,69 | ||||
| 2026-02-17 | 13F | Oxford Asset Management Llp | 79.142 | 201 | ||||||
| 2025-10-30 | 13F | WFA Asset Management Corp | 463 | 0,00 | 1 | -100,00 | ||||
| 2026-02-13 | 13F | State Street Corp | 4.923.220 | -13,32 | 12.505 | -19,06 | ||||
| 2026-02-17 | 13F | Two Sigma Securities, Llc | 19.981 | 62,75 | 51 | 51,52 | ||||
| 2026-02-06 | 13F | VSM Wealth Advisory, LLC | 0 | -100,00 | 0 | |||||
| 2026-02-17 | 13F | Quadrature Capital Ltd | 301.074 | 660,52 | 765 | 614,02 | ||||
| 2026-02-13 | 13F | Walleye Trading LLC | Put | 5.200 | -92,06 | 13 | -92,70 | |||
| 2026-02-13 | 13F | Walleye Trading LLC | Call | 5.700 | 850,00 | 14 | 1.300,00 | |||
| 2026-02-11 | 13F | Jpmorgan Chase & Co | 1.418.389 | 104,91 | 3.603 | 91,39 | ||||
| 2026-04-17 | 13F | Vermillion Wealth Management, Inc. | 8 | 0,00 | 0 | |||||
| 2026-02-13 | 13F | Walleye Trading LLC | 553.779 | 6,26 | 1.407 | -0,78 | ||||
| 2026-02-13 | 13F | First Trust Advisors Lp | 715.013 | 0,41 | 1.816 | -6,20 | ||||
| 2026-01-27 | 13F | TD Waterhouse Canada Inc. | 8.185 | -7,72 | 21 | -23,08 | ||||
| 2026-04-06 | 13F | GAMMA Investing LLC | 1.790 | 4 | ||||||
| 2026-02-18 | 13F | GWM Advisors LLC | 1.900 | 0,00 | 5 | -20,00 | ||||
| 2026-02-12 | 13F | Counterpoint Mutual Funds LLC | 0 | -100,00 | 0 | |||||
| 2026-02-17 | 13F | Manatuck Hill Partners, LLC | 0 | -100,00 | 0 | |||||
| 2026-02-05 | 13F | Bank Julius Baer & Co. Ltd, Zurich | 0 | -100,00 | 0 | |||||
| 2026-02-13 | 13F | Squarepoint Ops LLC | 141.095 | 358 | ||||||
| 2026-02-12 | 13F | BlackRock, Inc. | 36.875 | -4,32 | 94 | -10,58 | ||||
| 2025-11-12 | 13F | Creekmur Asset Management LLC | 150 | 0,00 | 0 | |||||
| 2026-02-17 | 13F | Advisor Group Holdings, Inc. | 11.577 | 11,27 | 29 | 26,09 | ||||
| 2026-02-03 | 13F | SBI Securities Co., Ltd. | 12.672 | -4,14 | 32 | -8,57 | ||||
| 2026-02-10 | 13F | CIBC World Markets Inc. | 29.556 | 0,34 | 75 | -5,06 | ||||
| 2026-02-13 | 13F | Aigen Investment Management, Lp | 21.026 | 53 | ||||||
| 2026-02-17 | 13F | Ameriflex Group, Inc. | 149 | -50,00 | 0 | |||||
| 2026-02-17 | 13F | Two Sigma Advisers, Lp | 6.242.000 | 3,39 | 15.855 | -3,45 | ||||
| 2026-02-10 | 13F | Belvedere Trading LLC | Call | 50.000 | 0,00 | 128 | -5,93 | |||
| 2026-02-13 | 13F | Mariner, LLC | 22.971 | 5,55 | 58 | -1,69 | ||||
| 2026-02-13 | 13F | American Century Companies Inc | 68.831 | 21,19 | 176 | 14,38 | ||||
| 2025-11-14 | 13F | Ardsley Advisory Partners Lp | 0 | -100,00 | 0 | -100,00 | ||||
| 2026-02-11 | 13F | Deutsche Bank Ag\ | 7.156 | 18 | ||||||
| 2026-02-13 | 13F | National Bank Of Canada /fi/ | 52.593 | -1,15 | 111 | -5,98 | ||||
| 2026-02-17 | 13F | Jones Financial Companies Lllp | 3.605 | -9,99 | 9 | -18,18 | ||||
| 2026-02-13 | 13F | Barclays Plc | 214 | -98,96 | 1 | -100,00 | ||||
| 2026-02-13 | 13F | Toroso Investments, LLC | 11.307 | 29 | ||||||
| 2026-02-09 | 13F | Legal & General Group Plc | 6.430.198 | -52,23 | 16.405 | -55,04 | ||||
| 2025-11-20 | 13F | First Affirmative Financial Network | 26.023 | -11,37 | 71 | 52,17 | ||||
| 2026-02-06 | 13F | Gsa Capital Partners Llp | 709.304 | 108,52 | 2 | |||||
| 2026-01-28 | 13F | Hoey Investments, Inc | 500 | 0,00 | 1 | 0,00 | ||||
| 2026-01-29 | 13F | Pictet Asset Management Holding SA | 52.687 | 135 |