Basisstatistiken
| Institutionelle Aktien (Long) | 64.562.687 - 37,42% (ex 13D/G) - change of 14,41MM shares 28,73% MRQ |
| Institutioneller Wert (Long) | $ 277.644 USD ($1000) |
Institutioneller Eigentümerschaft und Aktionäre
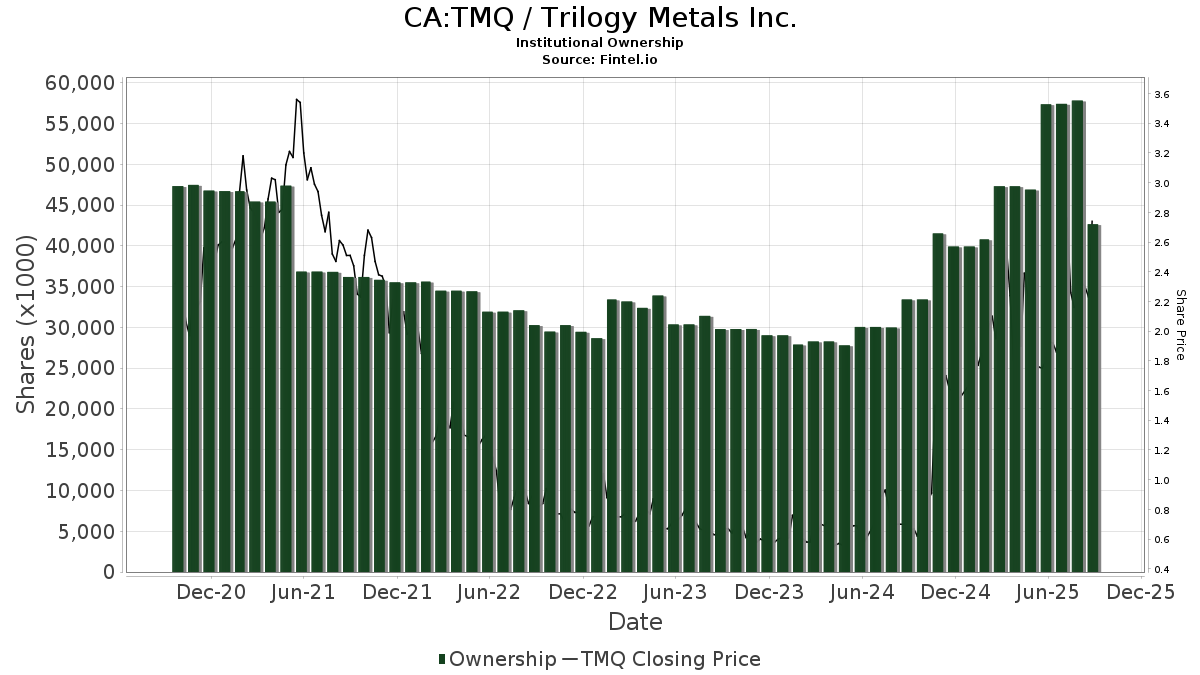
Trilogy Metals Inc. (CA:TMQ) hat 126 institutionelle Eigentümer und Aktionäre, die 13D/G oder 13F Formulare bei der Securities Exchange Commission (SEC) eingereicht haben. Diese Institutionen halten insgesamt 64,562,687 Aktien. Die größten Aktionäre sind Electrum Group Llc, Toroso Investments, LLC, Old West Investment Management, LLC, Goehring & Rozencwajg Associates, LLC, Jane Street Group, Llc, Envestnet Asset Management Inc, Susquehanna International Group, Llp, Alps Advisors Inc, Susquehanna International Group, Llp, and Susquehanna International Group, Llp .
Trilogy Metals Inc. (TSX:TMQ) Die institutionelle Eigentümerstruktur zeigt die aktuellen Positionen von Institutionen und Fonds im Unternehmen sowie die jüngsten Veränderungen der Positionsgröße. Zu den Großaktionären können Einzelanleger, Investmentfonds, Hedgefonds oder Institutionen gehören. Der Schedule 13D zeigt an, dass der Investor mehr als 5% des Unternehmens hält (oder gehalten hat) und beabsichtigt (oder beabsichtigt hat), aktiv eine Änderung der Geschäftsstrategie zu verfolgen. Schedule 13G zeigt eine passive Investition von über 5% an.
The share price as of March 9, 2026 is 5,45 / share. Previously, on March 10, 2025, the share price was 1,80 / share. This represents an increase of 202,78% over that period.
Fondsstimmung-Score
Der Fondsstimmung-Score (auch bekannt als Eigentümer-Akkumulations-Score) ermittelt die Aktien, die am meisten von Fonds gekauft werden. Er ist das Ergebnis eines ausgeklügelten quantitativen Multifaktormodells, das die Unternehmen mit den höchsten institutionellen Käufen identifiziert. Das Scoring-Modell verwendet eine Kombination aus der Gesamtzunahme der offengelegten Eigentümer, den Änderungen der Portfolioallokationen in diesen Eigentümern und anderen Metriken. Die Zahl reicht von 0 bis 100, wobei höhere Zahlen ein höheres Maß an Kapitalakkumulation als bei anderen Unternehmen anzeigen und 50 den Durchschnitt darstellt.
Aktualisierungshäufigkeit: Täglich
Siehe Ownership Explorer, der eine Liste der am höchsten bewerteten Unternehmen enthält.
AI+ Ask Fintel’s AI assistant about Trilogy Metals Inc..
Select a question to share a public post with an AI-crafted answer.
Thinking of good questions…
13F und NPORT Einreichungen
Details zu 13F-Einreichungen sind kostenlos. Für Details zu NP-Einreichungen ist eine Premium-Mitgliedschaft erforderlich. Grüne Zeilen zeigen neue Positionen an. Rote Zeilen zeigen geschlossene Positionen an. Klicken Sie auf das Link Symbol, um den gesamten Transaktionsverlauf zu sehen.
Upgrade
um Prämiendaten freizuschalten und nach Excel zu exportieren ![]() .
.
| Datei Datum | Quelle | Anleger | Typ | Durchschnittlicher Preis (Est) |
Aktien | Δ Aktien (%) |
Gemeldeter Wert ($1000) |
Δ Wert (%) |
Port Alloc (%) |
|
|---|---|---|---|---|---|---|---|---|---|---|
| 2026-01-30 | 13F | Us Bancorp \de\ | 6 | 0,00 | 0 | |||||
| 2026-02-12 | 13F | Steward Partners Investment Advisory, Llc | 425 | 2 | ||||||
| 2026-01-14 | 13F | Cypress Wealth Services, LLC | 21.100 | 7,65 | 91 | 119,51 | ||||
| 2025-11-14 | 13F | Hrt Financial Lp | 0 | -100,00 | 0 | |||||
| 2026-01-27 | 13F | TD Waterhouse Canada Inc. | 50 | 0,00 | 0 | |||||
| 2026-02-12 | 13F | Dimensional Fund Advisors Lp | 27.514 | 26,83 | 119 | 162,22 | ||||
| 2026-02-17 | 13F | Two Sigma Securities, Llc | 21.947 | 95 | ||||||
| 2026-01-14 | 13F | Spire Wealth Management | 12.114 | -35,47 | 52 | 33,33 | ||||
| 2026-02-17 | 13F | Tower Research Capital LLC (TRC) | 9.751 | 42 | ||||||
| 2026-02-06 | 13F | IFP Advisors, Inc | 12 | 0 | ||||||
| 2026-02-17 | 13F | Raymond James Financial Inc | 21.015 | 109,23 | 91 | 328,57 | ||||
| 2026-02-06 | 13F | New Millennium Group LLC | 280 | 1 | ||||||
| 2026-02-17 | 13F | Northern Trust Corp | 35.075 | 151 | ||||||
| 2026-02-13 | 13F | Pathstone Holdings, LLC | 20.000 | 0,00 | 86 | 104,76 | ||||
| 2026-02-11 | 13F | LPL Financial LLC | 54.506 | 90,69 | 235 | 290,00 | ||||
| 2026-02-10 | 13F/A | Northwestern Mutual Wealth Management Co | 62 | 0,00 | 0 | |||||
| 2026-02-13 | 13F | Morgan Stanley | 198.430 | 280,35 | 855 | 684,40 | ||||
| 2026-02-12 | 13F | Jane Street Group, Llc | 941.892 | 109,75 | 4.060 | 330,89 | ||||
| 2026-01-28 | 13F | Geneos Wealth Management Inc. | 300 | 1 | ||||||
| 2026-01-29 | 13F | Vanguard Group Inc | 99.298 | 430 | ||||||
| 2026-02-12 | 13F | Jane Street Group, Llc | Put | 19.200 | 83 | |||||
| 2026-02-10 | 13F | State of Wyoming | 7.534 | 32 | ||||||
| 2026-02-12 | 13F | Jane Street Group, Llc | Call | 96.600 | 416 | |||||
| 2026-02-13 | 13F | National Bank Of Canada /fi/ | 378 | 641,18 | 1 | |||||
| 2026-02-13 | 13F | American Century Companies Inc | 10.294 | 45 | ||||||
| 2026-02-13 | 13F | Truvestments Capital Llc | 8 | 0,00 | 0 | |||||
| 2026-02-11 | 13F | Tradition Wealth Management, LLC | 10.000 | 43 | ||||||
| 2026-02-17 | 13F | Susquehanna International Group, Llp | 655.971 | 916,73 | 2.827 | 1.994,07 | ||||
| 2026-01-30 | 13F | Activest Wealth Management | 1.000 | 4 | ||||||
| 2026-02-11 | 13F | Electrum Group Llc | 31.604.741 | 136.216 | ||||||
| 2026-02-17 | 13F | Susquehanna International Group, Llp | Put | 672.000 | 2.896 | |||||
| 2026-02-17 | 13F | Susquehanna International Group, Llp | Call | 748.800 | 945,81 | 3.227 | 2.051,33 | |||
| 2026-02-06 | 13F | Global Retirement Partners, LLC | 2.056 | 6.130,30 | 9 | |||||
| 2026-02-11 | 13F | Legacy Capital Wealth Management, Llc | 43.107 | 186 | ||||||
| 2026-02-11 | 13F | Simplex Trading, Llc | Put | 61.800 | 10.200,00 | 266 | ||||
| 2026-02-11 | 13F | Simplex Trading, Llc | Call | 155.000 | 46,36 | 668 | ||||
| 2026-01-29 | 13F | UBS Group AG | 71.308 | 712.980,00 | 307 | |||||
| 2026-02-17 | 13F | Signature Equity Partners, LLC | 500 | 2 | ||||||
| 2026-01-27 | 13F | Atlantic Edge Private Wealth Management, LLC | 200 | 1 | ||||||
| 2026-02-17 | 13F | Scientech Research LLC | 20.626 | 89 | ||||||
| 2026-02-13 | 13F | Gen-Wealth Partners Inc | 458 | 2 | ||||||
| 2025-11-14 | 13F | Wolverine Trading, Llc | Call | 17.400 | -19,07 | 37 | 23,33 | |||
| 2026-02-17 | 13F | Cetera Investment Advisers | Call | 4.500 | 1 | |||||
| 2026-02-09 | 13F | Hantz Financial Services, Inc. | 1.116 | 21,83 | 0 | |||||
| 2026-02-17 | 13F | Cetera Investment Advisers | 12.603 | 54 | ||||||
| 2026-02-12 | 13F | Colonial Trust Advisors | 1.000 | 4 | ||||||
| 2026-02-12 | 13F | Federation des caisses Desjardins du Quebec | 7.223 | -52,48 | 31 | -3,23 | ||||
| 2026-02-12 | 13F | Alps Advisors Inc | 674.396 | 74,96 | 2.907 | 259,21 | ||||
| 2025-11-14 | 13F | GeoSphere Capital Management | 0 | -100,00 | 0 | -100,00 | ||||
| 2026-02-11 | 13F | Jpmorgan Chase & Co | 46 | -99,98 | 0 | -100,00 | ||||
| 2026-02-17 | 13F | Rangeley Capital, LLC | 87.000 | 0,00 | 375 | 105,49 | ||||
| 2026-02-13 | 13F | Toroso Investments, LLC | 18.752.440 | 417,29 | 80.823 | 961,78 | ||||
| 2026-01-29 | 13F | Pictet Asset Management Holding SA | 19.576 | 84 | ||||||
| 2026-02-17 | 13F | Jump Financial, LLC | 14.035 | 60 | ||||||
| 2026-02-17 | 13F | California State Teachers Retirement System | 96.400 | 415 | ||||||
| 2026-02-17 | 13F | Old West Investment Management, LLC | 4.679.087 | -61,54 | 20.167 | -21,06 | ||||
| 2026-02-06 | 13F | Larson Financial Group LLC | 2.000 | 9 | ||||||
| 2026-02-09 | 13F | Harbour Investments, Inc. | 326 | 1.937,50 | 1 | |||||
| 2026-02-17 | 13F | Advisor Group Holdings, Inc. | 22.685 | 141.681,25 | 98 | |||||
| 2026-01-21 | 13F | Sound Income Strategies, LLC | 0 | -100,00 | 0 | |||||
| 2026-02-13 | 13F | Marshall Wace, Llp | 0 | -100,00 | 0 | |||||
| 2026-01-20 | 13F | AdvisorNet Financial, Inc | 7.837 | -28,00 | 34 | 50,00 | ||||
| 2026-02-02 | 13F | New England Capital Financial Advisors LLC | 333 | 0,00 | 1 | |||||
| 2026-01-23 | 13F | Rsm Us Wealth Management Llc | 22.500 | 97 | ||||||
| 2026-02-13 | 13F | State Street Corp | 168.538 | 726 | ||||||
| 2026-01-28 | 13F | Klp Kapitalforvaltning As | 31.000 | 134 | ||||||
| 2026-02-17 | 13F | Two Sigma Investments, Lp | 325.091 | -0,50 | 1.401 | 104,23 | ||||
| 2026-02-05 | 13F | Allworth Financial LP | 300 | 1 | ||||||
| 2025-11-14 | 13F | Credit Agricole S A | 0 | -100,00 | 0 | |||||
| 2026-02-09 | 13F | Legal & General Group Plc | 87.195 | 376 | ||||||
| 2026-02-13 | 13F | DLD Asset Management, LP | Call | 0 | -100,00 | 0 | ||||
| 2026-02-23 | 13F | Virtu Financial LLC | 21.207 | 64,78 | 0 | |||||
| 2026-02-11 | 13F | Total Wealth Planning & Management, Inc. | 45.220 | -55,00 | 195 | 43,70 | ||||
| 2026-02-10 | 13F | Envestnet Asset Management Inc | 925.740 | -8,66 | 3.990 | 87,45 | ||||
| 2026-02-14 | 13F | Rockefeller Capital Management L.P. | 87.049 | 569,61 | 375 | 1.288,89 | ||||
| 2026-02-05 | 13F | Tucker Asset Management Llc | 1.598 | 7 | ||||||
| 2026-02-13 | 13F | Glen Eagle Advisors, LLC | 0 | -100,00 | 0 | |||||
| 2026-02-13 | 13F | Alyeska Investment Group, L.P. | 0 | -100,00 | 0 | |||||
| 2026-02-11 | 13F | Simplex Trading, Llc | 0 | -100,00 | 0 | |||||
| 2026-02-18 | 13F | Mackenzie Financial Corp | 96.699 | 416 | ||||||
| 2026-01-14 | 13F | Tradewinds Capital Management, LLC | 475 | 2 | ||||||
| 2026-01-28 | 13F | Chicago Partners Investment Group LLC | Call | 24.000 | 43 | |||||
| 2026-01-13 | 13F | CoreCap Advisors, LLC | 1.066 | 0,00 | 5 | 100,00 | ||||
| 2026-02-12 | 13F | Triumph Capital Management | 200 | 1 | ||||||
| 2026-02-17 | 13F | Engineers Gate Manager LP | 20.682 | 89 | ||||||
| 2025-11-14 | 13F | XTX Topco Ltd | 0 | -100,00 | 0 | -100,00 | ||||
| 2026-01-21 | 13F | Stone House Investment Management, LLC | 500 | 2 | ||||||
| 2026-02-13 | 13F | Integrated Wealth Concepts LLC | 10.500 | 5,00 | 45 | 114,29 | ||||
| 2026-01-14 | 13F | ORG Partners LLC | 250 | 1 | ||||||
| 2026-02-12 | 13F | BlackRock, Inc. | 282.584 | 1.218 | ||||||
| 2026-02-11 | 13F | Winton Capital Group Ltd | 15.990 | 69 | ||||||
| 2026-02-13 | 13F | Wexford Capital Lp | 0 | -100,00 | 0 | |||||
| 2026-02-13 | 13F | Citigroup Inc | 24.041 | 104 | ||||||
| 2026-01-23 | 13F | Farther Finance Advisors, LLC | 2.400 | 10 | ||||||
| 2026-02-17 | 13F | GAM Holding AG | 0 | -100,00 | 0 | |||||
| 2026-02-17 | 13F | Captrust Financial Advisors | 13.256 | 57 | ||||||
| 2026-01-22 | 13F | Financial Consulate, Inc | 1.105 | 5 | ||||||
| 2026-02-12 | 13F | Swiss National Bank | 212.100 | 914 | ||||||
| 2026-02-17 | 13F | Point72 Asset Management, L.P. | 141.900 | 612 | ||||||
| 2026-02-13 | 13F | DLD Asset Management, LP | 0 | -100,00 | 0 | |||||
| 2026-02-11 | 13F | Parallel Advisors, LLC | 20.325 | 88 | ||||||
| 2026-02-17 | 13F | Caption Management, LLC | Call | 140.000 | 603 | |||||
| 2026-01-29 | 13F | IMC-Chicago, LLC | Put | 84.900 | 366 | |||||
| 2026-01-29 | 13F | IMC-Chicago, LLC | Call | 117.200 | 505 | |||||
| 2026-02-17 | 13F | Wiley Bros.-aintree Capital, Llc | 39.866 | -21,86 | 172 | 59,81 | ||||
| 2026-01-26 | 13F | Cwm, Llc | 314 | 318,67 | 0 | |||||
| 2026-02-04 | 13F | Pensionmark Financial Group, Llc | 42.079 | 181 | ||||||
| 2026-01-30 | 13F | Exencial Wealth Advisors, Llc | 0 | -100,00 | 0 | |||||
| 2026-02-17 | 13F | Qube Research & Technologies Ltd | 0 | -100,00 | 0 | |||||
| 2026-01-23 | 13F | Avion Wealth | 8.400 | 0,00 | 0 | |||||
| 2026-02-13 | 13F | Bornite Capital Management LP | 0 | -100,00 | 0 | |||||
| 2026-01-27 | 13F | Zurcher Kantonalbank (Zurich Cantonalbank) | 60.677 | 262 | ||||||
| 2026-02-13 | 13F | Caitong International Asset Management Co., Ltd | 6.173 | 27 | ||||||
| 2026-02-10 | 13F | Quantbot Technologies LP | 86.910 | 375 | ||||||
| 2026-02-13 | 13F | MAI Capital Management | 14.800 | 64 | ||||||
| 2026-01-07 | 13F | Massmutual Trust Co Fsb/adv | 300 | 1 | ||||||
| 2026-02-13 | 13F | Manufacturers Life Insurance Company, The | 0 | -100,00 | 0 | |||||
| 2025-11-14 | 13F | Cubist Systematic Strategies, LLC | 74.381 | 43,61 | 156 | 126,09 | ||||
| 2026-02-13 | 13F | Stifel Financial Corp | 25.625 | 110 | ||||||
| 2026-02-12 | 13F | Pettinga Financial Advisors, LLC | 15.233 | 66 | ||||||
| 2026-02-17 | 13F | Royal Bank Of Canada | 4.469 | 55.762,50 | 19 | |||||
| 2026-02-17 | 13F | Millennium Management Llc | 328.446 | -18,23 | 1.416 | 67,85 | ||||
| 2026-01-29 | 13F | IMC-Chicago, LLC | 49.083 | 212 | ||||||
| 2026-02-11 | 13F | Modus Advisors, LLC | 1.000 | 4 | ||||||
| 2026-02-12 | 13F | Renaissance Technologies Llc | 0 | -100,00 | 0 | |||||
| 2026-02-18 | 13F | GWM Advisors LLC | 1.050 | 5 | ||||||
| 2026-02-13 | 13F | Great West Life Assurance Co /can/ | 28.202 | 0 | ||||||
| 2026-02-06 | 13F | Pnc Financial Services Group, Inc. | 2.000 | 0,00 | 9 | 100,00 | ||||
| 2026-01-28 | 13F | Arizona State Retirement System | 29.923 | 129 | ||||||
| 2026-01-28 | 13F | Legacy Capital Group California, Inc. | 174.649 | -38,34 | 753 | 26,60 | ||||
| 2026-02-05 | 13F | Cambridge Investment Research Advisors, Inc. | 42.950 | 0 | ||||||
| 2026-02-17 | 13F | Janus Henderson Group Plc | 51.800 | 223 | ||||||
| 2026-02-10 | 13F | Goldman Sachs Group Inc | 159.914 | 34,32 | 689 | 175,60 | ||||
| 2026-02-13 | 13F | Barclays Plc | 3.342 | 14 | ||||||
| 2026-02-17 | 13F | Bank Of America Corp /de/ | 357.328 | 202,70 | 1.540 | 523,48 | ||||
| 2026-02-10 | 13F | Td Asset Management Inc | 135.888 | 589 | ||||||
| 2026-02-03 | 13F | SBI Securities Co., Ltd. | 4.804 | 21 | ||||||
| 2026-02-17 | 13F | Citadel Advisors Llc | 16.044 | -94,50 | 69 | -88,73 | ||||
| 2026-02-17 | 13F | Citadel Advisors Llc | Call | 263.800 | 1.977,17 | 1.137 | 4.269,23 | |||
| 2026-02-04 | 13F | Atlantic Union Bankshares Corp | 250 | 1 | ||||||
| 2026-02-17 | 13F | Citadel Advisors Llc | Put | 532.800 | 2.236,84 | 2.296 | 4.785,11 | |||
| 2026-02-17 | 13F | Jones Financial Companies Lllp | 7.882 | 34 | ||||||
| 2026-02-13 | 13F | Rhumbline Advisers | 275 | 1 | ||||||
| 2026-01-09 | 13F | Silverlake Wealth Management Llc | 12.244 | 53 | ||||||
| 2026-02-17 | 13F | Toronto Dominion Bank | 408 | 2 | ||||||
| 2026-02-13 | 13F | Dynamic Technology Lab Private Ltd | 66.875 | 288 | ||||||
| 2026-02-11 | 13F | Group One Trading, L.p. | Call | 558.100 | 12.584,09 | 2.405 | 26.622,22 | |||
| 2026-02-13 | 13F | Goehring & Rozencwajg Associates, LLC | 1.408.204 | 5,22 | 6.105 | 114,55 | ||||
| 2026-02-11 | 13F | Group One Trading, L.p. | Put | 239.200 | 59.700,00 | 1.031 | ||||
| 2026-01-21 | 13F | TSP Capital Management Group, LLC | 29.011 | 105,73 | ||||||
| 2026-02-09 | 13F | IPG Investment Advisors LLC | 14.850 | 0,00 | 64 | 106,45 | ||||
| 2026-02-11 | 13F | Group One Trading, L.p. | 2.771 | -96,48 | 12 | -93,33 | ||||
| 2026-03-03 | 13F | Targeted Financial Services LLC | 51.302 | 221 | ||||||
| 2025-10-15 | 13F | Financial Management Professionals, Inc. | 0 | -100,00 | 0 | |||||
| 2026-02-13 | 13F | Walleye Capital LLC | 254.411 | 332,63 | 1.097 | 791,06 | ||||
| 2026-02-17 | 13F | Two Sigma Advisers, Lp | 0 | -100,00 | 0 | |||||
| 2026-02-06 | 13F | Leonteq Securities AG | 10.000 | 43 | ||||||
| 2026-02-12 | 13F | Sprott Inc. | 135.566 | -37,70 | 584 | 28,07 | ||||
| 2026-02-13 | 13F | Wells Fargo & Company/mn | 2.427 | -78,62 | 11 | -58,33 | ||||
| 2026-02-17 | 13F | Paulson & Co. Inc. | 0 | -100,00 | 0 |