Basisstatistiken
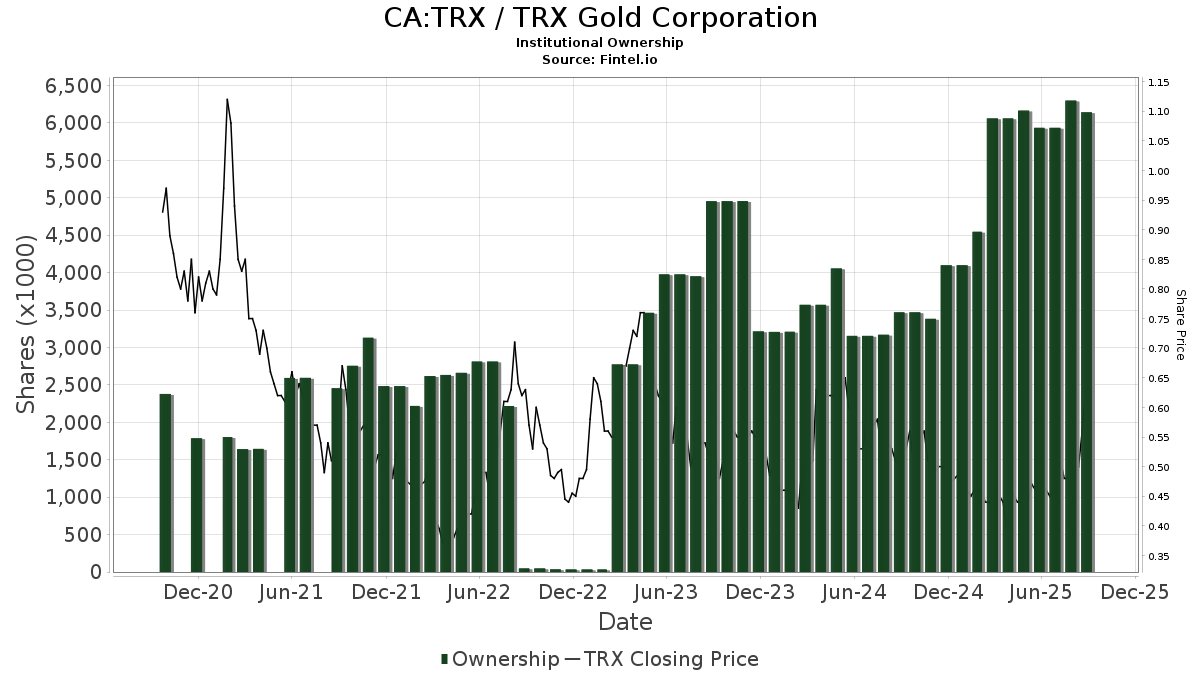
| Institutionelle Aktien (Long) | 6.618.608 - 2,30% (ex 13D/G) - change of 0,68MM shares 11,46% MRQ |
| Institutioneller Wert (Long) | $ 4.354 USD ($1000) |
Institutioneller Eigentümerschaft und Aktionäre
TRX Gold Corporation (CA:TRX) hat 51 institutionelle Eigentümer und Aktionäre, die 13D/G oder 13F Formulare bei der Securities Exchange Commission (SEC) eingereicht haben. Diese Institutionen halten insgesamt 6,618,608 Aktien. Die größten Aktionäre sind Morgan Stanley, Rossby Financial, LCC, Hillsdale Investment Management Inc., Bnp Paribas Arbitrage, Sa, Citadel Advisors Llc, Strategic Planning, Inc., HighTower Advisors, LLC, Integrity Wealth Solutions LLC, Bank Of Montreal /can/, and Financial Sense Advisors, Inc. .
TRX Gold Corporation (TSX:TRX) Die institutionelle Eigentümerstruktur zeigt die aktuellen Positionen von Institutionen und Fonds im Unternehmen sowie die jüngsten Veränderungen der Positionsgröße. Zu den Großaktionären können Einzelanleger, Investmentfonds, Hedgefonds oder Institutionen gehören. Der Schedule 13D zeigt an, dass der Investor mehr als 5% des Unternehmens hält (oder gehalten hat) und beabsichtigt (oder beabsichtigt hat), aktiv eine Änderung der Geschäftsstrategie zu verfolgen. Schedule 13G zeigt eine passive Investition von über 5% an.
The share price as of February 4, 2026 is 2,19 / share. Previously, on February 5, 2025, the share price was 0,46 / share. This represents an increase of 376,09% over that period.
Fondsstimmung-Score
Der Fondsstimmung-Score (auch bekannt als Eigentümer-Akkumulations-Score) ermittelt die Aktien, die am meisten von Fonds gekauft werden. Er ist das Ergebnis eines ausgeklügelten quantitativen Multifaktormodells, das die Unternehmen mit den höchsten institutionellen Käufen identifiziert. Das Scoring-Modell verwendet eine Kombination aus der Gesamtzunahme der offengelegten Eigentümer, den Änderungen der Portfolioallokationen in diesen Eigentümern und anderen Metriken. Die Zahl reicht von 0 bis 100, wobei höhere Zahlen ein höheres Maß an Kapitalakkumulation als bei anderen Unternehmen anzeigen und 50 den Durchschnitt darstellt.
Aktualisierungshäufigkeit: Täglich
Siehe Ownership Explorer, der eine Liste der am höchsten bewerteten Unternehmen enthält.
AI+ Ask Fintel’s AI assistant about TRX Gold Corporation.
Select a question to share a public post with an AI-crafted answer.
Thinking of good questions…
13F und NPORT Einreichungen
Details zu 13F-Einreichungen sind kostenlos. Für Details zu NP-Einreichungen ist eine Premium-Mitgliedschaft erforderlich. Grüne Zeilen zeigen neue Positionen an. Rote Zeilen zeigen geschlossene Positionen an. Klicken Sie auf das Link Symbol, um den gesamten Transaktionsverlauf zu sehen.
Upgrade
um Prämiendaten freizuschalten und nach Excel zu exportieren ![]() .
.
| Datei Datum | Quelle | Anleger | Typ | Durchschnittlicher Preis (Est) |
Aktien | Δ Aktien (%) |
Gemeldeter Wert ($1000) |
Δ Wert (%) |
Port Alloc (%) |
|
|---|---|---|---|---|---|---|---|---|---|---|
| 2025-11-14 | 13F | Wiley Bros.-aintree Capital, Llc | 0 | -100,00 | 0 | -100,00 | ||||
| 2025-11-12 | 13F | Simplex Trading, Llc | 607 | -14,14 | 0 | |||||
| 2026-01-27 | 13F | Evergreen Capital Management Llc | 0 | -100,00 | 0 | |||||
| 2026-01-21 | 13F | Stone House Investment Management, LLC | 6.240 | 6 | ||||||
| 2025-11-19 | 13F | Captrust Financial Advisors | 30.486 | 0,00 | 19 | 111,11 | ||||
| 2025-11-14 | 13F | National Bank Of Canada /fi/ | 2.116 | -30,10 | 1 | |||||
| 2025-08-14 | 13F | Susquehanna International Group, Llp | 0 | -100,00 | 0 | -100,00 | ||||
| 2025-11-10 | 13F | Rossby Financial, LCC | 980.000 | 0,51 | 612 | 87,73 | ||||
| 2025-08-14 | 13F | Citadel Advisors Llc | Put | 0 | -100,00 | 0 | -100,00 | |||
| 2025-10-20 | 13F | Strategic Planning, Inc. | 329.133 | 0,00 | 205 | 100,98 | ||||
| 2025-11-13 | 13F | Bank Of Montreal /can/ | 220.200 | -5,49 | 139 | 82,89 | ||||
| 2025-11-14 | 13F | Royal Bank Of Canada | 1.500 | -88,16 | 1 | -75,00 | ||||
| 2025-08-12 | 13F | Proequities, Inc. | 0 | 0 | ||||||
| 2025-08-13 | 13F | Continuum Advisory, LLC | 0 | -100,00 | 0 | |||||
| 2025-11-12 | 13F | LPL Financial LLC | 52.532 | -27,57 | 33 | 33,33 | ||||
| 2026-01-23 | 13F | Farther Finance Advisors, LLC | 66.900 | 0,00 | 62 | 48,78 | ||||
| 2025-11-14 | 13F | Warren Averett Asset Management, LLC | 26.150 | 0,00 | 16 | 100,00 | ||||
| 2025-08-13 | 13F | Cary Street Partners Financial Llc | 0 | -100,00 | 0 | -100,00 | ||||
| 2026-01-26 | 13F | Virginia Wealth Management Group, Inc. | 100.000 | 0,00 | 92 | 48,39 | ||||
| 2026-01-27 | 13F | Waterfront Wealth Inc. | 75.166 | 0,00 | 92 | 80,39 | ||||
| 2025-11-05 | 13F | Envestnet Asset Management Inc | 0 | -100,00 | 0 | |||||
| 2025-11-14 | 13F | Raymond James Financial Inc | 15.407 | 0,00 | 10 | 80,00 | ||||
| 2025-11-14 | 13F | Hrt Financial Lp | 37.000 | 0 | ||||||
| 2025-11-13 | 13F | Bnp Paribas Arbitrage, Sa | 482.536 | 6,15 | 301 | 98,03 | ||||
| 2025-11-07 | 13F | HighTower Advisors, LLC | 294.216 | -3,93 | 184 | 79,41 | ||||
| 2026-01-15 | 13F | PFG Private Wealth Management, LLC | 0 | -100,00 | 0 | |||||
| 2026-02-04 | 13F | Meridian Wealth Management, LLC | 55.377 | 10,75 | 51 | 61,29 | ||||
| 2025-11-14 | 13F | Morgan Stanley | 1.365.827 | -1,66 | 852 | 83,23 | ||||
| 2026-01-14 | 13F | ORG Partners LLC | 0 | -100,00 | 0 | |||||
| 2025-11-14 | 13F | Financial Sense Advisors, Inc. | 198.483 | -16,77 | 124 | 55,70 | ||||
| 2026-01-21 | 13F | Blue Zone Wealth Advisors, LLC | 15.972 | 0,00 | 15 | 55,56 | ||||
| 2025-11-10 | 13F | Hillsdale Investment Management Inc. | 744.581 | 471 | ||||||
| 2026-01-12 | 13F | Thompson Davis & Co., Inc. | 14.222 | 13 | ||||||
| 2025-11-14 | 13F/A | Leigh Baldwin & Co., Llc | 18.750 | 12 | ||||||
| 2026-01-23 | 13F | Asset Advisors Investment Management, LLC | 30.000 | 0,00 | 28 | 50,00 | ||||
| 2025-10-22 | 13F | Cerity Partners LLC | 117.371 | 0,00 | 73 | 87,18 | ||||
| 2025-11-14 | 13F | Citadel Advisors Llc | 442.851 | 50,36 | 276 | 181,63 | ||||
| 2026-01-08 | 13F | Wealth Enhancement Advisory Services, Llc | 25.450 | 0,00 | 22 | 46,67 | ||||
| 2026-01-29 | 13F | Kestra Private Wealth Services, Llc | 20.000 | 0,00 | 18 | 50,00 | ||||
| 2025-11-14 | 13F | Jane Street Group, Llc | 16.019 | -85,25 | 10 | -75,00 | ||||
| 2025-11-14 | 13F | XTX Topco Ltd | 12.244 | 8 | ||||||
| 2025-10-22 | 13F | Commonwealth Equity Services, Llc | 14.000 | 0,00 | 0 | |||||
| 2025-11-12 | 13F | Sprott Inc. | 70.975 | -51,20 | 44 | -8,33 | ||||
| 2026-01-14 | 13F | Aventus Investment Advisors, Inc. | 6.750 | 0,00 | 6 | 50,00 | ||||
| 2026-02-03 | 13F | SBI Securities Co., Ltd. | 1.168 | 231,82 | 1 | |||||
| 2026-01-21 | 13F | Rathbone Brothers plc | 14.000 | 0,00 | 13 | 50,00 | ||||
| 2025-11-14 | 13F | Two Sigma Securities, Llc | 0 | -100,00 | 0 | |||||
| 2025-11-17 | 13F | GWM Advisors LLC | 10.700 | -39,55 | 7 | 20,00 | ||||
| 2025-08-13 | 13F | StoneX Group Inc. | 0 | -100,00 | 0 | -100,00 | ||||
| 2025-11-14 | 13F | Cetera Investment Advisers | 18.373 | 12 | ||||||
| 2025-08-14 | 13F | Advisor OS, LLC | 0 | -100,00 | 0 | |||||
| 2026-01-21 | 13F | Guild Investment Management, Inc. | 66.900 | 0,00 | 62 | 48,78 | ||||
| 2025-11-26 | 13F/A | Jpmorgan Chase & Co | 1.500 | 50,00 | 1 | |||||
| 2025-11-10 | 13F | MAI Capital Management | 47.500 | 30 | ||||||
| 2025-11-14 | 13F | Scotia Capital Inc. | 17.049 | 0,00 | 11 | 100,00 | ||||
| 2026-02-02 | 13F | Integrity Wealth Solutions LLC | 289.975 | -0,35 | 267 | 47,51 | ||||
| 2025-11-13 | 13F | Connor, Clark & Lunn Investment Management Ltd. | 108.500 | 69 | ||||||
| 2025-12-02 | 13F | Allworth Financial LP | 200 | 0,00 | 0 | |||||
| 2025-11-14 | 13F | Kestra Advisory Services, LLC | 12.004 | 7 | ||||||
| 2026-01-26 | 13F | PFG Investments, LLC | 23.020 | -54,88 | 21 | -32,26 | ||||
| 2025-11-12 | 13F | Group One Trading, L.p. | 12.100 | -13,57 | 8 | 75,00 | ||||
| 2025-11-14 | 13F | Advisor Group Holdings, Inc. | 31.814 | -2,48 | 12 | 10,00 | ||||
| 2026-01-29 | 13F | UBS Group AG | 49.740 | 24,10 | 46 | 80,00 | ||||
| 2025-11-14 | 13F | Toronto Dominion Bank | 25.004 | -7,42 | 16 | 87,50 |