Basisstatistiken
| Institutionelle Eigentümer | 90 total, 86 long only, 0 short only, 4 long/short - change of -5,26% MRQ |
| Durchschnittliche Portfolioallokation | 0.0825 % - change of -2,92% MRQ |
| Institutionelle Aktien (Long) | 1.196.815 (ex 13D/G) - change of -0,06MM shares -4,44% MRQ |
| Institutioneller Wert (Long) | $ 130.303 USD ($1000) |
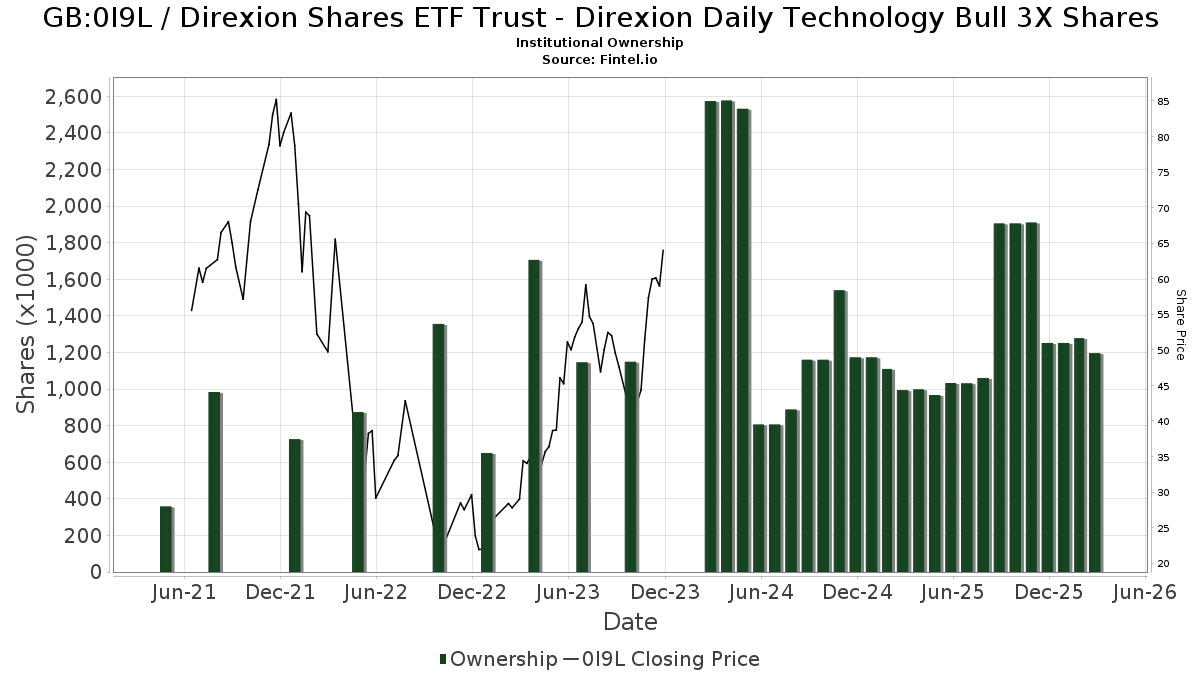
Institutioneller Eigentümerschaft und Aktionäre
Direxion Shares ETF Trust - Direxion Daily Technology Bull 3X ETF (GB:0I9L) hat 90 institutionelle Eigentümer und Aktionäre, die 13D/G oder 13F Formulare bei der Securities Exchange Commission (SEC) eingereicht haben. Diese Institutionen halten insgesamt 1,196,815 Aktien. Die größten Aktionäre sind Susquehanna International Group, Llp, Citadel Advisors Llc, Jane Street Group, Llc, Susquehanna International Group, Llp, Wolverine Trading, Llc, Citadel Advisors Llc, Jane Street Group, Llc, SBI Securities Co., Ltd., Gotham Asset Management, LLC, and Wolverine Trading, Llc .
Direxion Shares ETF Trust - Direxion Daily Technology Bull 3X ETF (LSE:0I9L) Die institutionelle Eigentümerstruktur zeigt die aktuellen Positionen von Institutionen und Fonds im Unternehmen sowie die jüngsten Veränderungen der Positionsgröße. Zu den Großaktionären können Einzelanleger, Investmentfonds, Hedgefonds oder Institutionen gehören. Der Schedule 13D zeigt an, dass der Investor mehr als 5% des Unternehmens hält (oder gehalten hat) und beabsichtigt (oder beabsichtigt hat), aktiv eine Änderung der Geschäftsstrategie zu verfolgen. Schedule 13G zeigt eine passive Investition von über 5% an.
Fondsstimmung-Score
Der Fondsstimmung-Score (auch bekannt als Eigentümer-Akkumulations-Score) ermittelt die Aktien, die am meisten von Fonds gekauft werden. Er ist das Ergebnis eines ausgeklügelten quantitativen Multifaktormodells, das die Unternehmen mit den höchsten institutionellen Käufen identifiziert. Das Scoring-Modell verwendet eine Kombination aus der Gesamtzunahme der offengelegten Eigentümer, den Änderungen der Portfolioallokationen in diesen Eigentümern und anderen Metriken. Die Zahl reicht von 0 bis 100, wobei höhere Zahlen ein höheres Maß an Kapitalakkumulation als bei anderen Unternehmen anzeigen und 50 den Durchschnitt darstellt.
Aktualisierungshäufigkeit: Täglich
Siehe Ownership Explorer, der eine Liste der am höchsten bewerteten Unternehmen enthält.
AI+ Ask Fintel’s AI assistant about Direxion Shares ETF Trust - Direxion Daily Technology Bull 3X ETF.
Select a question to share a public post with an AI-crafted answer.
Thinking of good questions…
13F und NPORT Einreichungen
Details zu 13F-Einreichungen sind kostenlos. Für Details zu NP-Einreichungen ist eine Premium-Mitgliedschaft erforderlich. Grüne Zeilen zeigen neue Positionen an. Rote Zeilen zeigen geschlossene Positionen an. Klicken Sie auf das Link Symbol, um den gesamten Transaktionsverlauf zu sehen.
Upgrade
um Prämiendaten freizuschalten und nach Excel zu exportieren ![]() .
.
| Datei Datum | Quelle | Anleger | Typ | Durchschnittlicher Preis (Est) |
Aktien | Δ Aktien (%) |
Gemeldeter Wert ($1000) |
Δ Wert (%) |
Port Alloc (%) |
|
|---|---|---|---|---|---|---|---|---|---|---|
| 2026-02-17 | 13F | Citadel Advisors Llc | Put | 211.400 | 12,51 | 24.837 | 6,28 | |||
| 2026-02-17 | 13F | Toronto Dominion Bank | 26 | 3 | ||||||
| 2026-01-12 | 13F | Traynor Capital Management, Inc. | 77.619 | -18,89 | 9.119 | -23,38 | ||||
| 2026-02-12 | 13F | Federation des caisses Desjardins du Quebec | 75 | -53,12 | 9 | -57,89 | ||||
| 2026-02-17 | 13F | Citadel Advisors Llc | Call | 596.200 | 1,09 | 70.048 | -4,51 | |||
| 2026-02-11 | 13F | Jpmorgan Chase & Co | 29 | -75,83 | 3 | -78,57 | ||||
| 2026-02-04 | 13F | Ground Swell Capital, LLC | 1.803 | 212 | ||||||
| 2026-02-11 | 13F | Janney Montgomery Scott LLC | 40.190 | 0,00 | 5 | 0,00 | ||||
| 2026-02-13 | 13F | Squarepoint Ops LLC | 49.171 | -9,86 | 5.777 | -14,84 | ||||
| 2026-02-17 | 13F | Quadrature Capital Ltd | 15.682 | 1.842 | ||||||
| 2025-11-14 | 13F | Main Street Financial Solutions, LLC | 0 | -100,00 | 0 | |||||
| 2026-01-26 | 13F | Grandview Asset Management LLC | 15.000 | 0,00 | 1.762 | -5,52 | ||||
| 2026-02-13 | 13F | Squarepoint Ops LLC | Call | 4.000 | 0,00 | 470 | -5,63 | |||
| 2026-02-20 | 13F | Kovitz Investment Group Partners, LLC | 6.006 | 154,92 | 706 | 140,61 | ||||
| 2026-02-06 | 13F | Covestor Ltd | 741 | -17,48 | 0 | |||||
| 2025-11-12 | 13F | Park Square Financial Group, LLC | 0 | -100,00 | 0 | |||||
| 2026-02-10 | 13F/A | Northwestern Mutual Wealth Management Co | 301 | 0,00 | 35 | -5,41 | ||||
| 2026-01-26 | 13F | Trinity Legacy Partners, LLC | 6.900 | 0,00 | 811 | -20,43 | ||||
| 2026-02-18 | 13F | Plotkin Financial Advisors, LLC | 0 | -100,00 | 0 | |||||
| 2026-02-12 | 13F | Bank Of Montreal /can/ | 111 | 7,77 | 13 | 0,00 | ||||
| 2026-02-12 | 13F | Steward Partners Investment Advisory, Llc | 12 | 1 | ||||||
| 2026-02-13 | 13F | Kestra Advisory Services, LLC | 750 | 88 | ||||||
| 2026-02-17 | 13F | Donalies Financial Planning, LLC | 6.240 | 733 | ||||||
| 2026-02-17 | 13F | Susquehanna International Group, Llp | Put | 425.800 | 68,83 | 50.027 | 59,49 | |||
| 2026-02-17 | 13F | Susquehanna International Group, Llp | Call | 797.200 | 27,98 | 93.663 | 20,90 | |||
| 2026-02-09 | 13F | Millington Financial Advisors, LLC | 4.656 | 2,71 | 500 | -13,04 | ||||
| 2025-11-12 | 13F | HAP Trading, LLC | Call | 7.500 | 325 | |||||
| 2026-01-28 | 13F | APS Management Group, Inc. | 2.229 | 8,63 | 262 | 2,35 | ||||
| 2026-02-12 | 13F | DRW Securities, LLC | 1.892 | -8,38 | 222 | -13,28 | ||||
| 2026-01-26 | 13F | Cwm, Llc | 2.435 | 6,66 | 0 | |||||
| 2026-02-13 | 13F | Morgan Stanley | 6.292 | 3.690,36 | 739 | 3.595,00 | ||||
| 2026-02-13 | 13F | Wells Fargo & Company/mn | 1 | 0,00 | 0 | |||||
| 2026-01-20 | 13F | Signaturefd, Llc | 160 | -20,00 | 19 | -25,00 | ||||
| 2026-02-10 | 13F | Crescent Grove Advisors, LLC | 7.843 | 0,00 | 921 | -5,54 | ||||
| 2026-02-18 | 13F | Onyx Bridge Wealth Group LLC | 2.500 | 7,07 | 294 | 1,03 | ||||
| 2026-02-11 | 13F | Manchester Capital Management LLC | 0 | -100,00 | 0 | -100,00 | ||||
| 2026-01-20 | 13F | Thurston, Springer, Miller, Herd & Titak, Inc. | 0 | -100,00 | 0 | |||||
| 2026-01-30 | 13F | Socha Financial Group, LLC | 2.960 | 4,48 | 348 | -1,42 | ||||
| 2026-02-12 | 13F | Renaissance Technologies Llc | 0 | -100,00 | 0 | |||||
| 2026-02-05 | 13F | Millennium Capital Advisors, LLC | 0 | -100,00 | 0 | |||||
| 2026-01-21 | 13F | Stonebridge Financial Group, LLC | 9.582 | 1.126 | ||||||
| 2026-02-17 | 13F | Susquehanna International Group, Llp | 22.826 | -65,04 | 2.682 | -66,99 | ||||
| 2026-02-12 | 13F | Summit Financial, LLC | 3.218 | -6,99 | 378 | -12,09 | ||||
| 2026-01-28 | 13F | WPG Advisers, LLC | 78 | -47,30 | 9 | -50,00 | ||||
| 2026-01-21 | 13F | Capital Investment Advisory Services, LLC | 0 | -100,00 | 0 | |||||
| 2025-11-14 | 13F | Wolverine Trading, Llc | Call | 272.000 | 20,19 | 33.208 | 61,38 | |||
| 2025-11-14 | 13F | Wolverine Trading, Llc | Put | 84.900 | -1,96 | 10.365 | 31,64 | |||
| 2026-02-12 | 13F | Gould Capital, LLC | 0 | -100,00 | 0 | |||||
| 2025-11-14 | 13F | Wolverine Trading, Llc | 27.193 | -1,49 | 3.320 | 32,23 | ||||
| 2026-02-06 | 13F | Pnc Financial Services Group, Inc. | 55.020 | -0,69 | 6.464 | -6,18 | ||||
| 2026-02-12 | 13F | Wealthspire Advisors, LLC | 0 | -100,00 | 0 | |||||
| 2026-01-29 | 13F | IMC-Chicago, LLC | 55.753 | 6.550 | ||||||
| 2026-02-11 | 13F | LPL Financial LLC | 9.355 | -14,19 | 1.099 | -18,89 | ||||
| 2026-02-17 | 13F | Tower Research Capital LLC (TRC) | 13.494 | -28,83 | 1.585 | -32,75 | ||||
| 2026-02-13 | 13F | Ogborne Capital Management, Llc | 25.000 | 2.937 | ||||||
| 2026-01-28 | 13F | West Michigan Advisors, Llc | 5.100 | 2,00 | 599 | -3,54 | ||||
| 2026-01-29 | 13F | UBS Group AG | 1.739 | -88,58 | 204 | -89,23 | ||||
| 2026-01-13 | 13F | Ferguson Wellman Capital Management, Inc | 3.280 | -46,86 | 385 | -49,80 | ||||
| 2026-02-26 | 13F | Anchor Investment Management, LLC | 635 | 0,00 | 75 | -5,13 | ||||
| 2026-01-15 | 13F | Sage Capital Management, LLC | 6.702 | 3,06 | 788 | -2,60 | ||||
| 2026-01-26 | 13F | AE Wealth Management LLC | 42 | 31,25 | 5 | 33,33 | ||||
| 2026-02-13 | 13F | 1248 Management, LLC | 300 | 0,00 | 35 | -5,41 | ||||
| 2026-02-03 | 13F | SBI Securities Co., Ltd. | 194.326 | -0,48 | 22.831 | -5,99 | ||||
| 2026-01-29 | 13F | IMC-Chicago, LLC | Call | 49.200 | -4,09 | 610 | -21,59 | |||
| 2026-02-18 | 13F | EP Wealth Advisors, Inc. | 42.105 | -7,00 | 4.947 | 16,76 | ||||
| 2025-12-02 | 13F | IFP Advisors, Inc | 0 | -100,00 | 0 | |||||
| 2026-02-12 | 13F | Moneta Group Investment Advisors Llc | 1.960 | 0,00 | 230 | -5,35 | ||||
| 2026-02-13 | 13F | National Bank Of Canada /fi/ | 0 | -100,00 | 0 | |||||
| 2026-02-10 | 13F | Envestnet Asset Management Inc | 0 | -100,00 | 0 | |||||
| 2026-01-28 | 13F | Retirement Planning Co of New England, Inc. | 3.593 | -10,62 | 422 | -15,43 | ||||
| 2026-02-17 | 13F | Wealth Watch Advisors, INC | 0 | -100,00 | 0 | |||||
| 2026-02-13 | 13F | Headlands Technologies LLC | 0 | -100,00 | 0 | |||||
| 2026-02-11 | 13F | Group One Trading, L.p. | Call | 19.400 | 30,20 | 186 | 3,35 | |||
| 2026-02-17 | 13F | Modern Wealth Management, LLC | 28.358 | 0,00 | 3.332 | -5,53 | ||||
| 2026-01-14 | 13F | CPR Investments Inc. | 9.487 | -12,88 | 1.115 | -17,73 | ||||
| 2026-01-26 | 13F | Main Street Group, LTD | 2.631 | 2,65 | 309 | -2,83 | ||||
| 2026-01-27 | 13F | BankPlus Trust Department | 400 | 47 | ||||||
| 2026-01-15 | 13F | Westmount Partners, LLC | 2.199 | 258 | ||||||
| 2026-02-10 | 13F | Lido Advisors, LLC | 5.904 | 0,00 | 734 | 0,00 | ||||
| 2025-11-14 | 13F | StoneX Group Inc. | 0 | -100,00 | 0 | -100,00 | ||||
| 2026-02-13 | 13F | Colony Group, LLC | 6.156 | 723 | ||||||
| 2026-02-04 | 13F | Ameritas Advisory Services, LLC | 0 | -100,00 | 0 | |||||
| 2026-02-13 | 13F | Barclays Plc | 0 | -100,00 | 0 | |||||
| 2026-02-02 | 13F | JDM Financial Group LLC | 152 | -29,95 | 18 | -34,62 | ||||
| 2026-01-08 | 13F | Wealth Enhancement Advisory Services, Llc | 1.935 | 0,00 | 240 | -4,02 | ||||
| 2026-01-13 | 13F | Kelly Financial Services LLC | 2.244 | 4,96 | 264 | -0,75 | ||||
| 2026-02-06 | 13F | Larson Financial Group LLC | 262 | 7,38 | 31 | 0,00 | ||||
| 2026-02-13 | 13F | Mariner, LLC | 45.805 | 5,27 | 5.382 | -0,55 | ||||
| 2026-02-12 | 13F | Jane Street Group, Llc | Put | 196.400 | 5,99 | 23.075 | 0,13 | |||
| 2026-01-23 | 13F | Burney Co/ | 3.429 | 6,19 | 403 | 0,25 | ||||
| 2026-01-23 | 13F | Blue Sky Capital Consultants Group, Inc. | 13.088 | 1,43 | 1.538 | -4,18 | ||||
| 2026-02-09 | 13F | Hantz Financial Services, Inc. | 45 | 0,00 | 0 | |||||
| 2026-02-17 | 13F | Citadel Advisors Llc | 0 | -100,00 | 0 | |||||
| 2026-02-17 | 13F | XTX Topco Ltd | 0 | -100,00 | 0 | |||||
| 2025-11-14 | 13F | Binnacle Investments Inc | 234 | 0,00 | 29 | 38,10 | ||||
| 2025-10-31 | 13F | PFG Investments, LLC | 0 | -100,00 | 0 | -100,00 | ||||
| 2026-01-27 | 13F | Belpointe Asset Management LLC | 0 | -100,00 | 0 | |||||
| 2026-02-13 | 13F | TRUE Private Wealth Advisors | 18.507 | 6,19 | 2.174 | 0,32 | ||||
| 2026-02-23 | 13F | Virtu Financial LLC | 28.660 | 1.035,95 | 3 | |||||
| 2025-10-27 | 13F | ZEGA Investments, LLC | 0 | -100,00 | 0 | |||||
| 2026-02-06 | 13F | HighTower Advisors, LLC | 3.396 | 399 | ||||||
| 2026-02-11 | 13F | Simplex Trading, Llc | 15.468 | 226,19 | 1.817 | |||||
| 2026-02-13 | 13F | Gts Securities Llc | 60.029 | -25,22 | 7.052 | -29,38 | ||||
| 2026-02-13 | 13F | Flow Traders U.s. Llc | 5.416 | -84,89 | 1 | -100,00 | ||||
| 2026-01-21 | 13F | Newbridge Financial Services Group, Inc. | 0 | -100,00 | 0 | |||||
| 2026-01-26 | 13F | Oxinas Partners Wealth Management LLC | 2.000 | 12,99 | 235 | 6,36 | ||||
| 2026-02-17 | 13F | Jump Financial, LLC | 0 | -100,00 | 0 | |||||
| 2026-02-17 | 13F | Qube Research & Technologies Ltd | 152 | 18 | ||||||
| 2025-11-14 | 13F | Two Sigma Securities, Llc | 0 | -100,00 | 0 | |||||
| 2026-02-17 | 13F | Mercer Global Advisors Inc /adv | 5.245 | 2,54 | 616 | -3,14 | ||||
| 2026-02-11 | 13F | X-Square Capital, LLC | 0 | -100,00 | 0 | |||||
| 2026-02-17 | 13F | Bank Of America Corp /de/ | 527 | 62 | ||||||
| 2025-11-14 | 13F | Raymond James Financial Inc | 0 | -100,00 | 0 | |||||
| 2026-02-13 | 13F | MAI Capital Management | 750 | 0,00 | 88 | -5,38 | ||||
| 2026-02-17 | 13F | Creative Planning | 17.760 | 1,02 | 2.087 | -4,57 | ||||
| 2026-02-11 | 13F | Group One Trading, L.p. | 8.102 | 952 | ||||||
| 2026-01-23 | 13F | Farther Finance Advisors, LLC | 4.392 | -53,74 | 516 | -56,36 | ||||
| 2026-01-06 | 13F | Tucker Asset Management Llc | 0 | -100,00 | 0 | |||||
| 2026-02-12 | 13F | Jane Street Group, Llc | 32.275 | 511,73 | 3.792 | 477,90 | ||||
| 2026-02-12 | 13F | Jane Street Group, Llc | Call | 486.600 | -12,04 | 57.171 | -16,91 | |||
| 2026-01-20 | 13F | Stratos Wealth Advisors, LLC | 23.348 | 11,02 | 2.743 | 4,89 | ||||
| 2026-02-09 | 13F | Financial Advisory Corp /ut/ /adv | 11.240 | 2,01 | 1 | 0,00 | ||||
| 2026-01-23 | 13F | James J. Burns & Company, LLC | 2.331 | 0,00 | 274 | -5,54 | ||||
| 2026-02-11 | 13F | J.w. Cole Advisors, Inc. | 4.407 | 10,84 | 518 | 4,66 | ||||
| 2026-02-17 | 13F | Gotham Asset Management, LLC | 90.324 | -23,25 | 10.612 | -27,49 | ||||
| 2026-01-20 | 13F | Toth Financial Advisory Corp | 107 | 0,00 | 13 | -7,69 | ||||
| 2026-02-12 | 13F | Hrt Financial Lp | 0 | -100,00 | 0 | |||||
| 2026-01-28 | 13F | Kingswood Wealth Advisors, Llc | 3.568 | 0,00 | 419 | -5,42 | ||||
| 2026-02-10 | 13F | 360 Financial, Inc. | 2.134 | 0,00 | 265 | 0,00 | ||||
| 2026-02-06 | 13F | Creative Financial Designs Inc /adv | 1.423 | 0,00 | 167 | -5,11 | ||||
| 2025-11-10 | 13F | EverSource Wealth Advisors, LLC | 0 | -100,00 | 0 | -100,00 |
Other Listings
| US:TECL | 86,42 $ |