Basisstatistiken
| Institutionelle Aktien (Long) | 76.087.024 - 112,90% (ex 13D/G) - change of -1,94MM shares -2,41% MRQ |
| Institutioneller Wert (Long) | $ 2.591.617 USD ($1000) |
Institutioneller Eigentümerschaft und Aktionäre
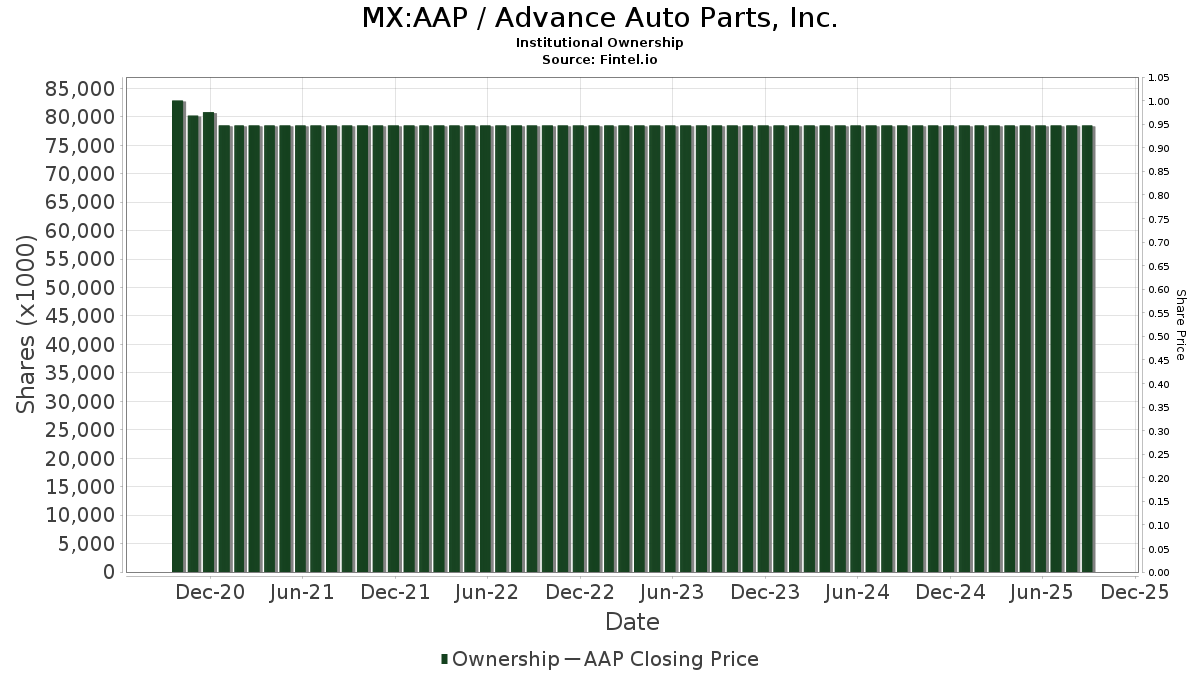
Advance Auto Parts, Inc. (MX:AAP) hat 370 institutionelle Eigentümer und Aktionäre, die 13D/G oder 13F Formulare bei der Securities Exchange Commission (SEC) eingereicht haben. Diese Institutionen halten insgesamt 76,087,024 Aktien. Die größten Aktionäre sind BlackRock, Inc., Price T Rowe Associates Inc /md/, Vanguard Group Inc, Pzena Investment Management Llc, Federated Hermes, Inc., Fuller & Thaler Asset Management, Inc., State Street Corp, American Century Companies Inc, Fmr Llc, and Cooper Creek Partners Management Llc .
Advance Auto Parts, Inc. (BMV:AAP) Die institutionelle Eigentümerstruktur zeigt die aktuellen Positionen von Institutionen und Fonds im Unternehmen sowie die jüngsten Veränderungen der Positionsgröße. Zu den Großaktionären können Einzelanleger, Investmentfonds, Hedgefonds oder Institutionen gehören. Der Schedule 13D zeigt an, dass der Investor mehr als 5% des Unternehmens hält (oder gehalten hat) und beabsichtigt (oder beabsichtigt hat), aktiv eine Änderung der Geschäftsstrategie zu verfolgen. Schedule 13G zeigt eine passive Investition von über 5% an.
Fondsstimmung-Score
Der Fondsstimmung-Score (auch bekannt als Eigentümer-Akkumulations-Score) ermittelt die Aktien, die am meisten von Fonds gekauft werden. Er ist das Ergebnis eines ausgeklügelten quantitativen Multifaktormodells, das die Unternehmen mit den höchsten institutionellen Käufen identifiziert. Das Scoring-Modell verwendet eine Kombination aus der Gesamtzunahme der offengelegten Eigentümer, den Änderungen der Portfolioallokationen in diesen Eigentümern und anderen Metriken. Die Zahl reicht von 0 bis 100, wobei höhere Zahlen ein höheres Maß an Kapitalakkumulation als bei anderen Unternehmen anzeigen und 50 den Durchschnitt darstellt.
Aktualisierungshäufigkeit: Täglich
Siehe Ownership Explorer, der eine Liste der am höchsten bewerteten Unternehmen enthält.
AI+ Ask Fintel’s AI assistant about Advance Auto Parts, Inc..
Select a question to share a public post with an AI-crafted answer.
Thinking of good questions…
13F und NPORT Einreichungen
Details zu 13F-Einreichungen sind kostenlos. Für Details zu NP-Einreichungen ist eine Premium-Mitgliedschaft erforderlich. Grüne Zeilen zeigen neue Positionen an. Rote Zeilen zeigen geschlossene Positionen an. Klicken Sie auf das Link Symbol, um den gesamten Transaktionsverlauf zu sehen.
Upgrade
um Prämiendaten freizuschalten und nach Excel zu exportieren ![]() .
.
| Datei Datum | Quelle | Anleger | Typ | Durchschnittlicher Preis (Est) |
Aktien | Δ Aktien (%) |
Gemeldeter Wert ($1000) |
Δ Wert (%) |
Port Alloc (%) |
|
|---|---|---|---|---|---|---|---|---|---|---|
| 2026-02-06 | 13F | Pnc Financial Services Group, Inc. | 2.024 | -29,28 | 80 | -54,86 | ||||
| 2026-02-17 | 13F | Advisory Services Network, LLC | 0 | -100,00 | 0 | |||||
| 2026-01-27 | 13F | TD Waterhouse Canada Inc. | 25 | 0,00 | 1 | -100,00 | ||||
| 2026-02-13 | 13F | Colony Group, LLC | 12.636 | -93,37 | 718 | -98,37 | ||||
| 2025-11-12 | 13F | Headlands Technologies LLC | 0 | -100,00 | 0 | |||||
| 2026-02-10 | 13F | Ilmarinen Mutual Pension Insurance Co | 5.603 | 0,00 | 0 | |||||
| 2026-05-01 | 13F | Phocas Financial Corp. | 54.432 | -21,90 | 2.871 | 4,86 | ||||
| 2026-02-12 | 13F | Steward Partners Investment Advisory, Llc | 1.445 | -28,32 | 57 | -54,47 | ||||
| 2026-04-24 | 13F | Profund Advisors Llc | 0 | -100,00 | 0 | |||||
| 2026-02-10 | 13F | Nomura Asset Management Co Ltd | 2.090 | 0,00 | 82 | -35,94 | ||||
| 2026-02-18 | 13F | Mackenzie Financial Corp | 0 | -100,00 | 0 | |||||
| 2026-01-21 | 13F | Palumbo Wealth Management LLC | 40.120 | 1.577 | ||||||
| 2026-02-12 | 13F | Ankerstar Wealth, LLC | 13 | 1 | ||||||
| 2026-02-13 | 13F | Aigen Investment Management, Lp | 5.831 | 229 | ||||||
| 2026-02-17 | 13F | Sciencast Management LP | 0 | -100,00 | 0 | |||||
| 2026-02-13 | 13F | Rhumbline Advisers | 172.720 | -5,30 | 6.788 | -39,39 | ||||
| 2026-02-13 | 13F | Morgan Stanley | 783.539 | -8,79 | 30.793 | -41,62 | ||||
| 2026-02-17 | 13F | Hbk Investments L P | Put | 0 | -100,00 | 0 | ||||
| 2026-03-12 | 13F/A | Peak6 Llc | Put | 200.000 | -2,91 | 7.860 | -37,86 | |||
| 2026-04-23 | 13F | Rexford Capital Inc | 3.700 | 0,00 | 195 | 34,48 | ||||
| 2026-03-12 | 13F/A | Peak6 Llc | Call | 8.800 | -38,46 | 346 | -60,71 | |||
| 2026-03-12 | 13F/A | Peak6 Llc | 45.493 | -34,89 | 1.788 | -58,34 | ||||
| 2026-02-17 | 13F | Scientech Research LLC | 5.289 | 208 | ||||||
| 2026-02-03 | 13F | Tweedy, Browne Co LLC | 15.179 | 16,59 | 597 | -25,41 | ||||
| 2026-02-13 | 13F | Public Sector Pension Investment Board | 207.908 | -11,14 | 8.171 | -43,13 | ||||
| 2026-01-28 | 13F | Salomon & Ludwin, LLC | 300 | -29,08 | 12 | -56,00 | ||||
| 2026-02-17 | 13F | Occudo Quantitative Strategies Lp | 0 | -100,00 | 0 | |||||
| 2025-11-21 | 13F/A | CIBC Bancorp USA Inc. | 6.401 | 393 | ||||||
| 2026-05-01 | 13F | Hantz Financial Services, Inc. | 914 | -0,54 | 0 | |||||
| 2026-02-13 | 13F | Umb Bank N A/mo | 311 | 1,63 | 12 | -33,33 | ||||
| 2025-11-14 | 13F | Balyasny Asset Management Llc | Call | 0 | -100,00 | 0 | -100,00 | |||
| 2026-04-27 | 13F | New York State Teachers Retirement System | 46.776 | -29,47 | 2 | 0,00 | ||||
| 2025-12-18 | 13F | Danske Bank A/s | 0 | -100,00 | 0 | |||||
| 2026-02-03 | 13F | Mitsubishi UFJ Kokusai Asset Management Co., Ltd. | 53 | 0,00 | 2 | -33,33 | ||||
| 2026-02-13 | 13F | Landscape Capital Management, L.l.c. | 15.248 | 599 | ||||||
| 2026-02-17 | 13F | Wellington Management Group Llp | 834.413 | 52,43 | 32.792 | -2,43 | ||||
| 2026-04-22 | 13F | Spire Wealth Management | 22 | -85,71 | 1 | -83,33 | ||||
| 2026-02-09 | 13F | Hartland & Co., LLC | 7 | 0 | ||||||
| 2026-02-13 | 13F | Caxton Associates Llp | 0 | -100,00 | 0 | |||||
| 2026-01-30 | 13F | Us Bancorp \de\ | 692 | -97,23 | 27 | -98,24 | ||||
| 2026-02-13 | 13F | Baird Financial Group, Inc. | 59.036 | 3,74 | 2.320 | -33,60 | ||||
| 2026-04-22 | 13F | CrossGen Wealth, LLC | 51 | 2,00 | 3 | 100,00 | ||||
| 2026-01-23 | 13F | Ogorek Anthony Joseph /ny/ /adv | 64 | -28,89 | 0 | |||||
| 2026-02-12 | 13F | Federated Hermes, Inc. | 2.811.675 | 4,37 | 110.499 | -33,20 | ||||
| 2026-02-17 | 13F | Summit Trail Advisors, Llc | 23.343 | -11,43 | 917 | -43,33 | ||||
| 2026-02-17 | 13F | Nomura Holdings Inc | Put | 70.000 | 0,00 | 2.751 | -35,99 | |||
| 2026-02-03 | 13F | Mma Asset Management Llc | 0 | -100,00 | 0 | |||||
| 2026-04-15 | 13F | Fortitude Family Office, LLC | 48 | 118,18 | 3 | |||||
| 2026-02-14 | 13F | Rockefeller Capital Management L.P. | 2.056 | -86,72 | 81 | -91,58 | ||||
| 2026-02-12 | 13F | New York State Common Retirement Fund | 28.622 | -0,24 | 1.125 | -36,17 | ||||
| 2026-02-17 | 13F | Nomura Holdings Inc | 6.309 | -49,04 | 248 | -67,50 | ||||
| 2026-02-17 | 13F | Fmr Llc | 1.944.423 | -0,99 | 76.416 | -36,63 | ||||
| 2026-02-17 | 13F | Safe Harbor Fiduciary, LLC | 0 | -100,00 | 0 | |||||
| 2026-02-13 | 13F | Walleye Capital LLC | Call | 78.000 | -32,06 | 3.065 | -56,51 | |||
| 2026-02-13 | 13F | Walleye Capital LLC | Put | 93.300 | -15,34 | 3.667 | -45,82 | |||
| 2026-02-13 | 13F | Walleye Capital LLC | 265.255 | 26.911,71 | 10.425 | 17.273,33 | ||||
| 2026-01-29 | 13F | Quent Capital, LLC | 0 | -100,00 | 0 | |||||
| 2026-02-17 | 13F | Aqr Capital Management Llc | 39.378 | 3,83 | 1.548 | -33,55 | ||||
| 2026-02-13 | 13F | Glen Eagle Advisors, LLC | 33 | 0,00 | 1 | -50,00 | ||||
| 2026-02-13 | 13F | Stifel Financial Corp | 56.443 | 234,38 | 2.218 | 114,09 | ||||
| 2026-04-13 | 13F | IFP Advisors, Inc | 845 | -2,20 | 45 | 33,33 | ||||
| 2026-02-09 | 13F | Studio Investment Management Llc | 0 | -100,00 | 0 | |||||
| 2026-04-08 | 13F | Roberts Wealth Advisors, LLC | 60.858 | 103,00 | 3.210 | 172,50 | ||||
| 2026-04-28 | 13F | Raleigh Capital Management Inc. | 0 | 0 | ||||||
| 2026-02-17 | 13F | Capital Fund Management S.a. | Put | 113.100 | -2,92 | 4.445 | -37,87 | |||
| 2026-01-29 | 13F | Vanguard Group Inc | 6.809.275 | -0,21 | 267.605 | -36,13 | ||||
| 2026-02-17 | 13F | Capital Fund Management S.a. | Call | 56.400 | -32,21 | 2.217 | -56,62 | |||
| 2026-02-17 | 13F | Russell Investments Group, Ltd. | 238.322 | 18,98 | 9.368 | -23,84 | ||||
| 2026-02-10 | 13F | Quantbot Technologies LP | 123.416 | 1.634,59 | 4.850 | 1.012,39 | ||||
| 2026-02-13 | 13F | Bridgefront Capital, LLC | 13.169 | 518 | ||||||
| 2026-04-08 | 13F | Beacon Financial Strategies CORP | 394 | 0,00 | 21 | 33,33 | ||||
| 2026-02-06 | 13F | HighTower Advisors, LLC | 0 | -100,00 | 0 | -100,00 | ||||
| 2026-01-29 | 13F | Teachers Retirement System Of The State Of Kentucky | 15.112 | -11,72 | 1 | -100,00 | ||||
| 2026-02-19 | 13F | CI Private Wealth, LLC | 6.966 | -64,24 | 275 | -77,09 | ||||
| 2026-02-11 | 13F | Ameritas Investment Partners, Inc. | 5.017 | 197 | ||||||
| 2026-02-13 | 13F | Verition Fund Management LLC | 29.104 | -88,76 | 1.144 | -92,81 | ||||
| 2026-02-02 | 13F | Oppenheimer & Co Inc | 0 | -100,00 | 0 | |||||
| 2026-04-21 | 13F | Pinnacle Associates Ltd | 3.828 | 202 | ||||||
| 2026-01-05 | 13F | Chesapeake Asset Management Llc | 0 | -100,00 | 0 | |||||
| 2026-02-17 | 13F | Capital Fund Management S.a. | 68.073 | 15,54 | 2.675 | -26,04 | ||||
| 2026-02-12 | 13F | Wealthspire Advisors, LLC | 0 | -100,00 | 0 | |||||
| 2026-04-27 | 13F | Sound Income Strategies, LLC | 64 | 1,59 | 3 | 50,00 | ||||
| 2026-02-11 | 13F | Fox Run Management, L.l.c. | 22.209 | 43,86 | 873 | -7,92 | ||||
| 2026-02-17 | 13F | Balyasny Asset Management Llc | 0 | -100,00 | 0 | -100,00 | ||||
| 2026-02-12 | 13F | Voya Investment Management Llc | 10.744 | -1,54 | 422 | -36,92 | ||||
| 2026-04-30 | 13F | LRI Investments, LLC | 360 | 3,75 | 19 | 38,46 | ||||
| 2026-04-06 | 13F | GAMMA Investing LLC | 3.816 | 4,95 | 201 | 41,55 | ||||
| 2026-01-29 | 13F | RMG Wealth Management LLC | 289 | 0,00 | 13 | -13,33 | ||||
| 2026-02-17 | 13F | Advisor Group Holdings, Inc. | 12.619 | -33,06 | 496 | -57,02 | ||||
| 2026-04-21 | 13F | Wesbanco Bank Inc | 21.900 | 0,00 | 1.155 | 34,30 | ||||
| 2026-04-29 | 13F | Great Hill Capital LLC | 178.596 | 41,73 | 9.421 | 90,23 | ||||
| 2026-04-07 | 13F | Farther Finance Advisors, LLC | 339 | 7,28 | 18 | 50,00 | ||||
| 2026-04-29 | 13F | Great Hill Capital LLC | Call | 204.800 | 0,00 | 14.336 | 7,90 | |||
| 2026-04-30 | 13F | Private Trust Co Na | 25 | 1 | ||||||
| 2026-02-17 | 13F | State Of Wisconsin Investment Board | 14.434 | -60,43 | 567 | -74,68 | ||||
| 2026-02-17 | 13F | Schonfeld Strategic Advisors LLC | 134.613 | 250,41 | 5.290 | 124,34 | ||||
| 2026-02-06 | 13F | Cullen/frost Bankers, Inc. | 266 | -43,40 | 10 | -64,29 | ||||
| 2025-11-13 | 13F | Eisler Capital Management Ltd. | 0 | -100,00 | 0 | |||||
| 2026-02-17 | 13F | Tudor Investment Corp Et Al | Put | 29.800 | 18,73 | 1.171 | -24,01 | |||
| 2026-02-17 | 13F | Tudor Investment Corp Et Al | Call | 94.700 | 112,33 | 3.722 | 35,90 | |||
| 2026-02-17 | 13F | Aquatic Capital Management LLC | 46.213 | 274,01 | 1.816 | 139,58 | ||||
| 2025-11-13 | 13F | Eisler Capital Management Ltd. | Call | 0 | -100,00 | 0 | ||||
| 2026-01-06 | 13F | Ransom Advisory, Ltd | 267 | 0,00 | 10 | -37,50 | ||||
| 2026-02-10 | 13F | Rothschild Investment Llc | 38 | -65,77 | 1 | -83,33 | ||||
| 2026-02-13 | 13F | Medina Singh Partners, LLC | 306.655 | 12.052 | ||||||
| 2026-02-13 | 13F | Dymon Asia Capital (singapore) Pte. Ltd. | Call | 22.500 | 884 | |||||
| 2026-01-27 | 13F | TriaGen Wealth Management LLC | 0 | -100,00 | 0 | |||||
| 2026-02-13 | 13F | Dymon Asia Capital (singapore) Pte. Ltd. | 6.478 | 255 | ||||||
| 2026-02-17 | 13F | Ilex Capital Partners (UK) LLP | 0 | -100,00 | 0 | |||||
| 2026-02-17 | 13F | Royal Bank Of Canada | 124.095 | -57,82 | 4.877 | -73,00 | ||||
| 2026-05-01 | 13F | Commonwealth Of Pennsylvania Public School Empls Retrmt Sys | 14.843 | -0,11 | 783 | 34,13 | ||||
| 2026-02-17 | 13F | Wealth Watch Advisors, INC | 5 | 0,00 | 0 | |||||
| 2025-11-06 | 13F | Versor Investments LP | 0 | -100,00 | 0 | -100,00 | ||||
| 2026-02-13 | 13F | Dymon Asia Capital (singapore) Pte. Ltd. | Put | 22.500 | 884 | |||||
| 2026-04-28 | 13F | Everence Capital Management Inc | 4.870 | 0 | ||||||
| 2026-04-30 | 13F | Cedar Mountain Advisors, LLC | 22 | 69,23 | 1 | |||||
| 2026-01-12 | 13F | Heartwood Wealth Advisors LLC | 0 | -100,00 | 0 | |||||
| 2026-04-15 | 13F | Fluent Financial, LLC | 40.633 | -74,36 | 2.290 | -63,22 | ||||
| 2026-02-04 | 13F | Bailard, Inc. | 0 | -100,00 | 0 | |||||
| 2026-02-09 | 13F | Investors Portfolio Services LLC | 10 | 0 | ||||||
| 2025-11-10 | 13F | Towle & Co | 0 | -100,00 | 0 | |||||
| 2026-04-16 | 13F | SG Americas Securities, LLC | 21.238 | -46,52 | 1 | 0,00 | ||||
| 2026-02-11 | 13F | Simplex Trading, Llc | Call | 175.200 | 72,78 | 6.885 | 114.650,00 | |||
| 2026-02-11 | 13F | Simplex Trading, Llc | Put | 151.700 | -12,31 | 5.962 | 59.510,00 | |||
| 2026-02-11 | 13F | Simplex Trading, Llc | 91.753 | 48,13 | 3.606 | 120.066,67 | ||||
| 2026-02-12 | 13F | Xponance, Inc. | 5.106 | 0,55 | 201 | -35,69 | ||||
| 2026-02-13 | 13F | Victory Capital Management Inc | 9.081 | -0,55 | 357 | -36,43 | ||||
| 2026-02-17 | 13F | Quantitative Investment Management, LLC | 19.499 | 372,82 | 1 | |||||
| 2026-04-30 | 13F | Cambridge Investment Research Advisors, Inc. | 4.774 | 0 | ||||||
| 2025-11-14 | 13F | Virtu Financial LLC | 0 | -100,00 | 0 | |||||
| 2026-02-13 | 13F | Bollard Group LLC | 1.676 | 0,48 | 0 | |||||
| 2026-02-17 | 13F | Susquehanna International Group, Llp | Put | 1.098.300 | 41,04 | 43.163 | -9,72 | |||
| 2026-02-17 | 13F | Susquehanna International Group, Llp | Call | 1.024.300 | 39,08 | 40.255 | -10,98 | |||
| 2026-04-23 | 13F | SJS Investment Consulting Inc. | 6 | 20,00 | 0 | |||||
| 2026-02-17 | 13F | Man Group plc | 56.346 | 2.214 | ||||||
| 2026-04-07 | 13F | Estate Planners Group, LLC | 1 | 0 | ||||||
| 2026-02-13 | 13F | Sei Investments Co | 38.443 | 108,40 | 1.511 | 33,39 | ||||
| 2026-02-12 | 13F | Federation des caisses Desjardins du Quebec | 1.445 | 2,12 | 57 | -34,88 | ||||
| 2026-02-05 | 13F | Gamco Investors, Inc. Et Al | 686.657 | 35,17 | 26.986 | -13,48 | ||||
| 2026-05-01 | 13F | Anchor Investment Management, LLC | 155 | 0,00 | 8 | 33,33 | ||||
| 2026-02-11 | 13F | CSM Advisors, LLC | 60.595 | -32,57 | 2 | -60,00 | ||||
| 2026-02-13 | 13F | Boston Partners | 37.914 | -4,42 | 1.490 | -38,81 | ||||
| 2026-02-13 | 13F | Great West Life Assurance Co /can/ | 53.936 | 0,99 | 2 | -33,33 | ||||
| 2025-11-10 | 13F | Jupiter Asset Management Ltd | 0 | -100,00 | 0 | |||||
| 2026-02-09 | 13F | Legal & General Group Plc | 174.516 | -2,55 | 6.858 | -37,63 | ||||
| 2026-02-12 | 13F | Bank Of Montreal /can/ | 9.859 | 8,17 | 387 | -30,77 | ||||
| 2026-01-14 | 13F | Net Worth Advisory Group | 5.311 | 0,19 | 209 | -36,00 | ||||
| 2026-02-13 | 13F | Rafferty Asset Management, LLC | 7.446 | 28,38 | 293 | -17,98 | ||||
| 2026-04-07 | 13F | Central Pacific Bank - Trust Division | 3.300 | 0,00 | 174 | 34,88 | ||||
| 2026-02-12 | 13F | DRW Securities, LLC | Put | 0 | -100,00 | 0 | ||||
| 2026-02-13 | 13F | Quarry LP | 194 | 8 | ||||||
| 2026-02-17 | 13F | Susquehanna International Group, Llp | 227.767 | 2,48 | 8.951 | -34,40 | ||||
| 2026-04-30 | 13F | Nisa Investment Advisors, Llc | 12.305 | 4,22 | 649 | 39,87 | ||||
| 2026-05-01 | 13F | Harwood Advisory Group, LLC | 3 | -50,00 | 0 | |||||
| 2026-04-21 | 13F | Curat Global, LLC | 85 | 0,00 | 4 | 33,33 | ||||
| 2026-02-12 | 13F | DRW Securities, LLC | 0 | -100,00 | 0 | |||||
| 2026-02-17 | 13F | Brevan Howard Capital Management LP | 5.395 | -78,51 | 212 | -86,24 | ||||
| 2026-02-12 | 13F | Ci Investments Inc. | 0 | -100,00 | 0 | |||||
| 2026-02-11 | 13F | Deutsche Bank Ag\ | 47.086 | 4,00 | 1.850 | -33,43 | ||||
| 2026-02-12 | 13F | Rossby Financial, LCC | 11 | 22,22 | 0 | |||||
| 2026-04-27 | 13F | Truist Financial Corp | 4.308 | 227 | ||||||
| 2025-11-04 | 13F | Mutual Advisors, LLC | 0 | -100,00 | 0 | -100,00 | ||||
| 2025-11-13 | 13F | Tairen Capital Ltd | 0 | -100,00 | 0 | -100,00 | ||||
| 2026-04-06 | 13F | CX Institutional | 42 | 2,44 | 0 | |||||
| 2026-02-09 | 13F | Harbour Investments, Inc. | 14 | -88,43 | 1 | -100,00 | ||||
| 2026-02-17 | 13F | Scarborough Advisors, LLC | 4 | 0,00 | 0 | |||||
| 2026-04-28 | 13F | Stratos Wealth Partners, LTD. | 0 | -100,00 | 0 | |||||
| 2026-02-17 | 13F/A | Kovack Advisors, Inc. | 62.080 | 2.440 | ||||||
| 2026-02-13 | 13F/A | Ontario Teachers Pension Plan Board | 0 | -100,00 | 0 | |||||
| 2026-04-28 | 13F | Handelsbanken Fonder AB | 14.200 | -4,05 | 1 | |||||
| 2026-02-13 | 13F | Walleye Trading LLC | 10.872 | 1.399,59 | 427 | 870,45 | ||||
| 2026-02-09 | 13F | Huntington National Bank | 1 | -85,71 | 0 | |||||
| 2025-11-14 | 13F | Skopos Labs, Inc. | 0 | -100,00 | 0 | |||||
| 2026-01-27 | 13F | Financial Management Professionals, Inc. | 0 | -100,00 | 0 | |||||
| 2026-02-13 | 13F | Walleye Trading LLC | Put | 108.400 | -45,17 | 4.260 | -64,90 | |||
| 2026-02-13 | 13F | Walleye Trading LLC | Call | 136.600 | -1,09 | 5.368 | -36,69 | |||
| 2026-02-02 | 13F | Saranac Partners Ltd | Put | 0 | -100,00 | 0 | -100,00 | |||
| 2026-04-20 | 13F | Jfs Wealth Advisors, Llc | 28 | -41,67 | 1 | 0,00 | ||||
| 2026-04-22 | 13F | Sterling Capital Management LLC | 1.999 | -42,38 | 105 | -22,79 | ||||
| 2026-01-28 | 13F | Universal- Beteiligungs- und Servicegesellschaft mbH | 29.960 | 0,00 | 1.177 | -36,00 | ||||
| 2026-02-11 | 13F | CenterBook Partners LP | 36.636 | 1.440 | ||||||
| 2026-04-08 | 13F | Wealth Enhancement Advisory Services, Llc | 8.548 | -7,49 | 443 | 15,97 | ||||
| 2026-02-10 | 13F | Bnp Paribas Arbitrage, Sa | 153.267 | -35,63 | 6.023 | -58,80 | ||||
| 2026-04-22 | 13F | Fearless Solutions, LLC dba Best Invest | 6.500 | 4,17 | 343 | 39,59 | ||||
| 2025-11-14 | 13F | Graham Capital Management, L.P. | 0 | -100,00 | 0 | -100,00 | ||||
| 2026-04-20 | 13F | State of Alaska, Department of Revenue | 29.604 | -3,11 | 2 | 0,00 | ||||
| 2026-02-09 | 13F | Geode Capital Management, Llc | 1.426.873 | 0,25 | 56.085 | -35,83 | ||||
| 2025-11-14 | 13F | ExodusPoint Capital Management, LP | 0 | -100,00 | 0 | |||||
| 2026-02-17 | 13F | Parallax Volatility Advisers, L.P. | Call | 25.000 | 0,00 | 982 | -36,03 | |||
| 2026-01-28 | 13F | Geneos Wealth Management Inc. | 160 | 0,00 | 6 | -33,33 | ||||
| 2026-04-24 | 13F | Vision Financial Markets Llc | 226 | -61,30 | 12 | -50,00 | ||||
| 2026-01-29 | 13F | Comerica Bank | 47.835 | 13,63 | 1.880 | -27,28 | ||||
| 2026-04-22 | 13F | Janney Montgomery Scott LLC | 69.923 | -1,67 | 4 | 50,00 | ||||
| 2025-11-14 | 13F | VestGen Advisors, LLC | 0 | -100,00 | 0 | -100,00 | ||||
| 2026-04-27 | 13F | Leonteq Securities AG | 538 | -61,90 | 28 | -49,09 | ||||
| 2026-01-28 | 13F | Teacher Retirement System Of Texas | 0 | -100,00 | 0 | |||||
| 2025-11-13 | 13F | Arrowstreet Capital, Limited Partnership | 0 | -100,00 | 0 | -100,00 | ||||
| 2026-02-13 | 13F | Pathstone Holdings, LLC | 0 | -100,00 | 0 | |||||
| 2026-02-17 | 13F | Gotham Asset Management, LLC | 174.416 | 23,38 | 6.855 | -21,04 | ||||
| 2026-04-28 | 13F | Altfest L J & Co Inc | 6.548 | -2,41 | 345 | 31,18 | ||||
| 2026-02-13 | 13F | Segall Bryant & Hamill, Llc | 665.249 | -1,66 | 26.144 | -37,06 | ||||
| 2025-11-14 | 13F | Texas Permanent School Fund | 0 | -100,00 | 0 | |||||
| 2026-02-11 | 13F | Los Angeles Capital Management Llc | 17.016 | 0,00 | 863 | -17,43 | ||||
| 2026-02-12 | 13F | Castleark Management Llc | 0 | -100,00 | 0 | |||||
| 2026-02-06 | 13F | Global Retirement Partners, LLC | 11 | 175,00 | 0 | |||||
| 2026-02-12 | 13F | State Board Of Administration Of Florida Retirement System | 10.710 | 0,00 | 421 | -36,07 | ||||
| 2026-02-12 | 13F | BlackRock, Inc. | 8.922.312 | 2,87 | 350.647 | -34,16 | ||||
| 2026-04-27 | 13F | Baer Investment Advisory LLC | 7.463 | 394 | ||||||
| 2026-02-12 | 13F | Campbell & CO Investment Adviser LLC | 29.400 | 1.155 | ||||||
| 2025-11-14 | 13F | Credit Agricole S A | 0 | -100,00 | 0 | |||||
| 2026-04-24 | 13F | Key FInancial Inc | 5 | 0,00 | 0 | |||||
| 2025-11-13 | 13F | Wells Fargo & Company/mn | Put | 0 | -100,00 | 0 | -100,00 | |||
| 2026-02-13 | 13F | Barclays Plc | 147.092 | 55,51 | 5.781 | -0,46 | ||||
| 2026-02-06 | 13F | EverSource Wealth Advisors, LLC | 240 | -10,11 | 9 | -43,75 | ||||
| 2025-11-13 | 13F | Cove Street Capital, LLC | 36.993 | -1,60 | 2.271 | 29,99 | ||||
| 2026-02-17 | 13F | Legion Partners Asset Management, LLC | 800.750 | 0,00 | 31.469 | -35,99 | ||||
| 2026-02-10 | 13F | Connor, Clark & Lunn Investment Management Ltd. | 214.890 | -23,66 | 8.445 | -51,13 | ||||
| 2026-01-29 | 13F | UBS Group AG | Put | 159.500 | 98,14 | 6.268 | 26,83 | |||
| 2026-01-29 | 13F | UBS Group AG | Call | 150.600 | 0,40 | 5.919 | -35,74 | |||
| 2026-04-15 | 13F | Exchange Traded Concepts, Llc | 24.171 | 59,24 | 1.275 | 113,93 | ||||
| 2026-01-29 | 13F | UBS Group AG | 1.382.610 | 12,42 | 54.337 | -28,05 | ||||
| 2026-02-17 | 13F | Ameriprise Financial Inc | 1.140.027 | 67,67 | 44.803 | 7,32 | ||||
| 2026-01-28 | 13F | City State Bank | 0 | -100,00 | 0 | |||||
| 2026-02-13 | 13F | MAI Capital Management | 326 | 0,00 | 13 | -40,00 | ||||
| 2026-04-24 | 13F | Root Financial Partners, LLC | 162 | 33,88 | 9 | 100,00 | ||||
| 2026-02-13 | 13F | SRS Capital Advisors, Inc. | 17 | 1 | ||||||
| 2026-02-17 | 13F | FIL Ltd | 345.483 | -0,93 | 13.577 | -36,59 | ||||
| 2026-04-22 | 13F | Romano Brothers And Company | 5.035 | -11,90 | 266 | 18,30 | ||||
| 2026-02-12 | 13F | Renaissance Technologies Llc | 142.650 | 1.018,82 | 5.606 | 616,88 | ||||
| 2026-02-17 | 13F | Zacks Investment Management | 36.323 | -84,87 | 1.427 | -90,32 | ||||
| 2026-02-13 | 13F | Johnson Investment Counsel Inc | 0 | -100,00 | 0 | |||||
| 2025-11-12 | 13F/A | Norges Bank | 716.078 | 47,41 | 27.920 | -9,25 | ||||
| 2026-02-02 | 13F | Principal Financial Group Inc | 286.067 | -1,23 | 11.242 | -36,79 | ||||
| 2026-02-10 | 13F/A | Northwestern Mutual Wealth Management Co | 89 | -81,42 | 3 | -89,66 | ||||
| 2026-02-17 | 13F | Quadrature Capital Ltd | 0 | -100,00 | 0 | |||||
| 2026-02-13 | 13F | Edgestream Partners, L.P. | 0 | -100,00 | 0 | |||||
| 2026-02-13 | 13F | Pine Valley Investments Ltd Liability Co | 0 | -100,00 | 0 | |||||
| 2026-02-12 | 13F | Cibc World Markets Corp | 0 | -100,00 | 0 | |||||
| 2026-02-17 | 13F | Raymond James Financial Inc | 184.113 | -10,67 | 7.236 | -42,83 | ||||
| 2026-04-30 | 13F | Kestra Advisory Services, LLC | 4.054 | 49,37 | 214 | 100,94 | ||||
| 2026-04-16 | 13F | Capital Advisors, Ltd. LLC | 212 | 0,00 | 0 | |||||
| 2026-01-29 | 13F | Mattern Capital Management, Llc | 0 | -100,00 | 0 | |||||
| 2026-02-13 | 13F | Natixis | 7.730 | 304 | ||||||
| 2026-02-13 | 13F | Citigroup Inc | 297.002 | -5,57 | 11.672 | -39,56 | ||||
| 2026-02-05 | 13F | GABELLI & Co INVESTMENT ADVISERS, INC. | 6.300 | 0,00 | 248 | -36,01 | ||||
| 2026-04-06 | 13F | Versant Capital Management, Inc | 26 | 0,00 | 1 | 0,00 | ||||
| 2025-11-10 | 13F | Axq Capital, Lp | 0 | -100,00 | 0 | -100,00 | ||||
| 2026-01-28 | 13F | DekaBank Deutsche Girozentrale | 81 | 0,00 | 0 | |||||
| 2026-04-29 | 13F/A | Salem Investment Counselors Inc | 14.625 | 0,00 | 771 | 34,32 | ||||
| 2026-04-24 | 13F | ProShare Advisors LLC | 9.339 | -19,99 | 493 | 7,42 | ||||
| 2026-01-23 | 13F | Assetmark, Inc | 5 | 0,00 | 0 | |||||
| 2026-02-17 | 13F | SageView Advisory Group, LLC | 665 | 26 | ||||||
| 2026-02-19 | 13F/A | T. Rowe Price Investment Management, Inc. | 723.677 | 10,62 | 28 | -30,00 | ||||
| 2026-01-21 | 13F | Westfuller Advisors, LLC | 0 | -100,00 | 0 | |||||
| 2026-01-30 | 13F | AMG National Trust Bank | 34.930 | -38,46 | 1.373 | -60,63 | ||||
| 2026-02-11 | 13F | Private Management Group Inc | 512.024 | 20.123 | ||||||
| 2026-05-01 | 13F | Sachetta, LLC | 16 | 0,00 | 1 | |||||
| 2026-01-26 | 13F | Cwm, Llc | 1.582 | -4,41 | 0 | |||||
| 2025-11-13 | 13F | Bnp Paribas Arbitrage, Sa | Put | 0 | -100,00 | 0 | -100,00 | |||
| 2026-04-20 | 13F | Louisiana State Employees Retirement System | 26.600 | -3,27 | 1.403 | 29,91 | ||||
| 2026-02-12 | 13F | CIBC Private Wealth Group, LLC | 189 | -16,00 | 7 | -46,15 | ||||
| 2025-11-14 | 13F | Aristeia Capital Llc | 0 | -100,00 | 0 | -100,00 | ||||
| 2026-02-13 | 13F | Zuckerman Investment Group, LLC | 0 | -100,00 | 0 | |||||
| 2026-02-13 | 13F | Neuberger Berman Group LLC | 0 | -100,00 | 0 | |||||
| 2026-04-13 | 13F | True Wealth Design, LLC | 9 | 0,00 | 0 | |||||
| 2026-02-13 | 13F | Smartleaf Asset Management LLC | 1.253 | 0,16 | 50 | -37,18 | ||||
| 2026-04-22 | 13F | Pictet Asset Management Holding SA | 9.283 | 0,00 | 490 | 34,34 | ||||
| 2026-02-09 | 13F | Quest Partners LLC | 16.227 | 189,97 | 638 | 85,71 | ||||
| 2026-02-03 | 13F | Crossmark Global Holdings, Inc. | 8.046 | 23,96 | 316 | -20,60 | ||||
| 2026-02-17 | 13F | H Partners Management, Llc | 900.000 | 71,43 | 35.370 | 9,73 | ||||
| 2026-02-17 | 13F | Maryland State Retirement & Pension System | 8.760 | 1,58 | 344 | -34,97 | ||||
| 2026-02-06 | 13F | Bare Financial Services, Inc | 118 | 1,72 | 5 | -42,86 | ||||
| 2026-04-30 | 13F | Nuveen, LLC | 174.563 | -7,97 | 9.208 | 23,53 | ||||
| 2026-04-21 | 13F | Founders Capital Management | 0 | -100,00 | 0 | |||||
| 2026-02-12 | 13F | Quadrant Capital Group Llc | 95 | -22,76 | 4 | -57,14 | ||||
| 2026-02-17 | 13F | Captrust Financial Advisors | 5.602 | -0,78 | 220 | -36,42 | ||||
| 2026-02-17 | 13F | Steadfast Capital Management Lp | 0 | -100,00 | 0 | |||||
| 2026-04-24 | 13F | Strs Ohio | 3.600 | -83,02 | 190 | -77,31 | ||||
| 2026-01-28 | 13F | M&t Bank Corp | 0 | -100,00 | 0 | |||||
| 2026-02-17 | 13F | Qube Research & Technologies Ltd | Call | 153.400 | -28,12 | 6.029 | -53,99 | |||
| 2026-02-17 | 13F | Solas Capital Management, LLC | 192.663 | 31,41 | 7.572 | -15,90 | ||||
| 2026-02-11 | 13F | Winnow Wealth Llc | 0 | -100,00 | 0 | |||||
| 2026-02-17 | 13F | Qube Research & Technologies Ltd | Put | 63.300 | -7,05 | 2.488 | -40,52 | |||
| 2026-02-17 | 13F | Sig Brokerage, Lp | 0 | -100,00 | 0 | |||||
| 2026-02-03 | 13F | Bokf, Na | 0 | -100,00 | 0 | |||||
| 2026-02-17 | 13F | Atom Investors LP | 150.108 | 98,74 | 5.899 | 27,22 | ||||
| 2026-04-17 | 13F | Vermillion Wealth Management, Inc. | 2 | 0 | ||||||
| 2026-02-09 | 13F | Keating Financial Advisory Services, Inc. | 20 | 1 | ||||||
| 2026-02-10 | 13F | Goldman Sachs Group Inc | 692.035 | -24,99 | 27.197 | -51,99 | ||||
| 2025-11-13 | 13F | FORA Capital, LLC | 0 | -100,00 | 0 | -100,00 | ||||
| 2026-02-17 | 13F | Toronto Dominion Bank | Call | 0 | -100,00 | 0 | ||||
| 2026-02-11 | 13F | Financiere des Professionnels - Fonds d,investissement inc. | 4.932 | 0,00 | 194 | -36,09 | ||||
| 2026-02-17 | 13F | Toronto Dominion Bank | 0 | -100,00 | 0 | |||||
| 2026-02-13 | 13F | Capital Square, LLC | 7.078 | -11,14 | 278 | -43,15 | ||||
| 2026-04-29 | 13F | Police & Firemen's Retirement System of New Jersey | 16.632 | 0,00 | 877 | 34,30 | ||||
| 2026-02-17 | 13F | Millennium Management Llc | Put | 90.400 | -15,36 | 3.553 | -45,83 | |||
| 2026-02-17 | 13F | Millennium Management Llc | 57.469 | -92,43 | 2.259 | -95,16 | ||||
| 2026-02-17 | 13F | Millennium Management Llc | Call | 109.900 | -30,27 | 4.319 | -55,36 | |||
| 2026-04-13 | 13F | Wedge Capital Management L L P/nc | 33.417 | 22,32 | 1.763 | 64,21 | ||||
| 2026-02-09 | 13F | New Age Alpha Advisors, LLC | 0 | -100,00 | 0 | |||||
| 2025-11-14 | 13F | LMR Partners LLP | Put | 0 | -100,00 | 0 | -100,00 | |||
| 2026-02-13 | 13F | Charles Schwab Investment Management Inc | 851.008 | -4,31 | 33.445 | -38,75 | ||||
| 2026-01-29 | 13F | Dunhill Financial, LLC | 5 | 150,00 | 0 | |||||
| 2026-04-20 | 13F | Provenance Wealth Advisors, LLC | 200 | 0,00 | 11 | 42,86 | ||||
| 2026-01-27 | 13F | Zurcher Kantonalbank (Zurich Cantonalbank) | 22.092 | 11,75 | 868 | -28,44 | ||||
| 2026-02-17 | 13F | Prelude Capital Management, Llc | 50.897 | 2.000 | ||||||
| 2026-02-17 | 13F | MIRAE ASSET GLOBAL ETFS HOLDINGS Ltd. | 27.886 | -0,04 | 1.096 | -36,04 | ||||
| 2026-02-13 | 13F | Mml Investors Services, Llc | 0 | -100,00 | 0 | |||||
| 2026-02-17 | 13F | Guggenheim Capital Llc | 10.049 | 53,56 | 395 | -1,75 | ||||
| 2025-11-14 | 13F | Eqis Capital Management, Inc. | 0 | -100,00 | 0 | |||||
| 2026-02-11 | 13F | Brandywine Global Investment Management, LLC | 89.651 | 3.523 | ||||||
| 2026-04-30 | 13F | Mv Capital Management, Inc. | 17 | 0,00 | 1 | |||||
| 2026-04-07 | 13F | Signaturefd, Llc | 134 | 5,51 | 7 | 75,00 | ||||
| 2026-02-12 | 13F | Marex Group plc | Call | 0 | -100,00 | 0 | ||||
| 2026-02-17 | 13F | Parkwood LLC | 492.357 | 26,94 | 19 | -17,39 | ||||
| 2025-12-09 | 13F | Swiss Life Asset Management Ltd | 0 | -100,00 | 0 | -100,00 | ||||
| 2025-11-14 | 13F | Bayesian Capital Management, LP | 0 | -100,00 | 0 | -100,00 | ||||
| 2026-02-12 | 13F | Jane Street Group, Llc | 0 | -100,00 | 0 | -100,00 | ||||
| 2026-02-17 | 13F | Tower Research Capital LLC (TRC) | 2.913 | 101,31 | 114 | 29,55 | ||||
| 2026-02-11 | 13F | Parallel Advisors, LLC | 839 | -10,65 | 33 | -43,86 | ||||
| 2026-02-13 | 13F | Pinnacle Wealth Planning Services, Inc. | 473 | 19 | ||||||
| 2026-02-13 | 13F | Ingalls & Snyder Llc | 9.478 | -0,02 | 0 | |||||
| 2026-04-23 | 13F | North Star Investment Management Corp. | 183 | -1,08 | 10 | 28,57 | ||||
| 2026-02-12 | 13F | Hrt Financial Lp | 68.900 | 190,72 | 3 | 100,00 | ||||
| 2026-04-30 | 13F | Millstone Evans Group, LLC | 11 | 0,00 | 1 | |||||
| 2026-02-10 | 13F | CIBC Asset Management Inc | 5.811 | 2,47 | 228 | -34,48 | ||||
| 2026-02-12 | 13F | MetLife Investment Management, LLC | 33.895 | -2,97 | 1.332 | -37,87 | ||||
| 2026-01-29 | 13F | IMC-Chicago, LLC | Call | 510.400 | 84,33 | 20.059 | 17,98 | |||
| 2026-02-13 | 13F | Ubs Asset Management Americas Inc | 155.185 | -2,59 | 6.099 | -37,65 | ||||
| 2026-02-17 | 13F | Creative Planning | 12.602 | -33,68 | 495 | -57,55 | ||||
| 2025-11-14 | 13F | Two Sigma Advisers, Lp | 0 | -100,00 | 0 | -100,00 | ||||
| 2026-02-12 | 13F | Ensign Peak Advisors, Inc | 4.518 | -66,82 | 178 | -78,83 | ||||
| 2026-02-02 | 13F | Hussman Strategic Advisors, Inc. | 21.000 | 825 | ||||||
| 2025-11-14 | 13F | Cubist Systematic Strategies, LLC | Call | 66.700 | 330,32 | 4.095 | 468,75 | |||
| 2025-11-14 | 13F | Cubist Systematic Strategies, LLC | Put | 60.600 | 217,28 | 3.721 | 319,39 | |||
| 2026-02-17 | 13F | Tcw Group Inc | 0 | -100,00 | 0 | |||||
| 2026-01-26 | 13F | Merit Financial Group, LLC | 0 | -100,00 | 0 | |||||
| 2026-02-17 | 13F | Siemens Fonds Invest GmbH | 1.508 | 0,00 | 60 | -35,87 | ||||
| 2026-01-23 | 13F | Rsm Us Wealth Management Llc | 0 | -100,00 | 0 | |||||
| 2025-11-14 | 13F | Hotchkis & Wiley Capital Management Llc | 0 | -100,00 | 0 | -100,00 | ||||
| 2026-01-29 | 13F | IMC-Chicago, LLC | 29.889 | -32,14 | 1.175 | -56,58 | ||||
| 2026-04-20 | 13F | Hilton Head Capital Partners, LLC | 591 | -2,15 | 31 | 34,78 | ||||
| 2026-01-29 | 13F | IMC-Chicago, LLC | Put | 163.600 | -23,80 | 6.429 | -51,23 | |||
| 2026-01-26 | 13F | KBC Group NV | 2.076 | 0,00 | 0 | |||||
| 2026-02-17 | 13F | Caption Management, LLC | Call | 113.600 | 4.464 | |||||
| 2026-02-17 | 13F | Dark Forest Capital Management Lp | 0 | -100,00 | 0 | -100,00 | ||||
| 2026-05-01 | 13F | Savoir Faire Capital Management, L.P. | 104.953 | -49,57 | 5.536 | -32,31 | ||||
| 2026-02-13 | 13F | Toroso Investments, LLC | 21.130 | -5,11 | 830 | -39,28 | ||||
| 2026-02-17 | 13F | Caption Management, LLC | 25.000 | 982 | ||||||
| 2026-02-11 | 13F | Havemeyer Place LP | 18.499 | 727 | ||||||
| 2026-02-11 | 13F | Deseret Mutual Benefit Administrators | 621 | 0,00 | 24 | -36,84 | ||||
| 2026-02-17 | 13F | Amundi | 7.944 | -26,30 | 312 | -50,32 | ||||
| 2026-04-24 | 13F | Pzena Investment Management Llc | 4.301.089 | 8,24 | 226.882 | 45,29 | ||||
| 2026-01-30 | 13F | Turning Point Benefit Group, Inc. | 16 | 1 | ||||||
| 2026-02-03 | 13F | Connable Office Inc | 0 | -100,00 | 0 | |||||
| 2026-02-17 | 13F | MAC Alpha Capital Management, LP | 41.926 | 1.648 | ||||||
| 2026-02-11 | 13F | Group One Trading, L.p. | Put | 68.900 | -3,50 | 2.708 | -38,24 | |||
| 2026-04-23 | 13F | Farmers & Merchants Investments Inc | 35 | 0,00 | 2 | 0,00 | ||||
| 2026-04-30 | 13F | Hsbc Holdings Plc | 7.524 | -15,80 | 397 | 12,82 | ||||
| 2026-02-11 | 13F | Group One Trading, L.p. | Call | 77.300 | 96,19 | 3.038 | 25,55 | |||
| 2026-02-12 | 13F | California Public Employees Retirement System | 86.110 | -18,14 | 3.384 | -47,61 | ||||
| 2026-02-11 | 13F | Group One Trading, L.p. | 43.649 | -26,71 | 1.715 | -53,09 | ||||
| 2026-02-18 | 13F | State of Tennessee, Treasury Department | 13.351 | -40,46 | 641 | -53,49 | ||||
| 2026-02-13 | 13F | Bragg Financial Advisors, Inc | 370.812 | 0,64 | 14.573 | -35,58 | ||||
| 2026-04-20 | 13F | Ronald Blue Trust, Inc. | 3.729 | 29,79 | 197 | 75,00 | ||||
| 2026-02-12 | 13F | Commonwealth Equity Services, Llc | 385.586 | 2,29 | 15.154 | 65.782,61 | ||||
| 2026-04-30 | 13F | Arista Wealth Management, LLC | 0 | -100,00 | 0 | |||||
| 2026-02-06 | 13F | Covestor Ltd | 6.747 | 37,83 | 0 | |||||
| 2026-02-13 | 13F | Public Employees Retirement Association Of Colorado | 6.329 | 0,00 | 0 | |||||
| 2026-02-12 | 13F | BRYN MAWR TRUST Co | 0 | -100,00 | 0 | -100,00 | ||||
| 2026-02-11 | 13F | MCF Advisors LLC | 110 | 0,00 | 4 | -33,33 | ||||
| 2026-02-10 | 13F | Bank of New York Mellon Corp | 478.477 | 29,91 | 18.804 | -16,85 | ||||
| 2026-02-12 | 13F | Jane Street Group, Llc | Call | 253.600 | -7,75 | 9.966 | -40,95 | |||
| 2026-05-01 | 13F | Fifth Third Bancorp | 51.827 | 3.521,73 | 2.734 | 4.780,36 | ||||
| 2026-02-12 | 13F | Jane Street Group, Llc | Put | 243.200 | -12,58 | 9.558 | -44,05 | |||
| 2026-04-13 | 13F | Creative Financial Designs Inc /adv | 0 | -100,00 | 0 | |||||
| 2026-02-17 | 13F | Trexquant Investment LP | 0 | -100,00 | 0 | |||||
| 2026-02-11 | 13F | Barrow Hanley Mewhinney & Strauss Llc | 62 | 2 | ||||||
| 2026-02-17 | 13F | Canada Pension Plan Investment Board | 82.427 | 5,50 | 3.239 | -32,46 | ||||
| 2026-02-11 | 13F | Franklin Resources Inc | 48.430 | 18,05 | 1.903 | -24,42 | ||||
| 2026-02-09 | 13F | Royce & Associates Lp | 1.478.633 | 30,46 | 58.110 | -16,50 | ||||
| 2026-02-10 | 13F | Elgethun Capital Management | 170.279 | 1,13 | 6.692 | -34,68 | ||||
| 2026-02-17 | 13F | SummitTX Capital, L.P. | 41.717 | 445,39 | 1.639 | 249,47 | ||||
| 2026-02-17 | 13F | D. E. Shaw & Co., Inc. | Call | 10.700 | 0,00 | 421 | -35,98 | |||
| 2026-02-06 | 13F | GPS Wealth Strategies Group, LLC | 21 | 0,00 | 1 | -100,00 | ||||
| 2026-04-07 | 13F | CoreCap Advisors, LLC | 628 | 8.871,43 | 33 | |||||
| 2026-02-17 | 13F | D. E. Shaw & Co., Inc. | 94.385 | 466,43 | 3.709 | 262,56 | ||||
| 2026-01-30 | 13F | State of New Jersey Common Pension Fund D | 43.345 | 13,30 | 1.703 | -27,47 | ||||
| 2026-02-17 | 13F | California State Teachers Retirement System | 57.115 | -0,09 | 2.245 | -36,07 | ||||
| 2026-02-17 | 13F | Prana Capital Management, LP | 12.966 | 510 | ||||||
| 2026-02-17 | 13F | Bank Of America Corp /de/ | Put | 0 | -100,00 | 0 | ||||
| 2026-04-24 | 13F | Medallion Wealth Advisors, LLC | 0 | -100,00 | 0 | |||||
| 2026-02-17 | 13F | Janus Henderson Group Plc | 27.924 | 0,00 | 1.097 | -36,03 | ||||
| 2026-02-13 | 13F | Manufacturers Life Insurance Company, The | 0 | -100,00 | 0 | |||||
| 2026-02-13 | 13F | BNP Paribas Asset Management Holding S.A. | 863 | 38,30 | 0 | |||||
| 2026-04-28 | 13F | Parrish Capital LLC | 20.879 | 8,85 | 1.101 | 46,22 | ||||
| 2026-01-27 | 13F | Bayforest Capital Ltd | 0 | -100,00 | 0 | |||||
| 2026-02-13 | 13F | Prudential Financial Inc | 56.284 | -8,97 | 2.920 | -23,08 | ||||
| 2025-11-13 | 13F | Quinn Opportunity Partners LLC | 0 | -100,00 | 0 | |||||
| 2026-04-28 | 13F | Bfsg, Llc | 4.569 | 53,32 | 241 | 105,98 | ||||
| 2026-02-13 | 13F | American Century Companies Inc | 1.958.394 | 28,88 | 76.965 | -17,51 | ||||
| 2026-02-05 | 13F | Amalgamated Bank | 17.431 | 0,93 | 1 | -100,00 | ||||
| 2026-02-11 | 13F | LPL Financial LLC | 19.410 | 2,00 | 763 | -34,76 | ||||
| 2026-02-17 | 13F | D. E. Shaw & Co., Inc. | Put | 50.100 | 0,00 | 1.969 | -36,02 | |||
| 2026-04-09 | 13F | Moody National Bank Trust Division | 15.831 | -39,07 | 835 | -18,22 | ||||
| 2026-02-17 | 13F | Jones Financial Companies Lllp | 3.133 | -47,48 | 123 | -66,12 | ||||
| 2026-04-28 | 13F | LGT Financial Advisors LLC | 2.000 | 0,00 | 106 | 34,62 | ||||
| 2026-02-13 | 13F | National Bank Of Canada /fi/ | 4 | -99,98 | 0 | -100,00 | ||||
| 2026-03-03 | 13F/A | Caitong International Asset Management Co., Ltd | 370 | -26,15 | 15 | -53,33 | ||||
| 2026-02-10 | 13F | Intech Investment Management Llc | 23.209 | -27,58 | 912 | -53,63 | ||||
| 2026-02-17 | 13F | Numerai GP LLC | 6.374 | -12,43 | 250 | -43,95 | ||||
| 2026-04-10 | 13F | Abound Wealth Management | 2 | -50,00 | 0 | |||||
| 2026-01-22 | 13F | Financial Consulate, Inc | 0 | -100,00 | 0 | |||||
| 2026-02-13 | 13F | Cramer Rosenthal Mcglynn Llc | 151.878 | 136,08 | 5.969 | 51,13 | ||||
| 2026-02-13 | 13F | Marshall Wace, Llp | 157.927 | 6.207 | ||||||
| 2026-02-13 | 13F | Ubs Oconnor Llc | Put | 0 | -100,00 | 0 | ||||
| 2026-02-17 | 13F | Bridgeway Capital Management Inc | 284.052 | -27,18 | 11.163 | -53,39 | ||||
| 2026-04-20 | 13F | William B. Walkup & Associates, Inc. | 358 | 0,00 | 14 | 0,00 | ||||
| 2025-11-12 | 13F | Creekmur Asset Management LLC | 95 | 0,00 | 6 | 25,00 | ||||
| 2026-02-03 | 13F | Anfield Capital Management, LLC | 7 | 0,00 | 0 | |||||
| 2026-02-04 | 13F | Dogwood Wealth Management LLC | 5 | 0,00 | 0 | |||||
| 2026-02-17 | 13F | Adage Capital Partners Gp, L.l.c. | 0 | -100,00 | 0 | |||||
| 2026-04-08 | 13F | DiNuzzo Private Wealth, Inc. | 11 | 0,00 | 1 | |||||
| 2026-02-13 | 13F | Barclays Plc | Put | 0 | -100,00 | 0 | -100,00 | |||
| 2026-02-13 | 13F | Barclays Plc | Call | 0 | -100,00 | 0 | -100,00 | |||
| 2026-04-29 | 13F | Klp Kapitalforvaltning As | 13.300 | 3,91 | 702 | 39,36 | ||||
| 2026-02-17 | 13F | Limestone Investment Advisors LP | 0 | -100,00 | 0 | -100,00 | ||||
| 2026-02-05 | 13F | AlphaCore Capital LLC | 883 | 53,57 | 35 | -2,86 | ||||
| 2026-02-17 | 13F | Northern Trust Corp | 581.082 | -9,69 | 22.837 | -42,20 | ||||
| 2026-02-19 | 13F | Invesco Ltd. | 373.884 | -1,73 | 14.694 | -37,10 | ||||
| 2026-02-17 | 13F | Bank Of America Corp /de/ | 1.010.585 | 12,04 | 39.716 | -28,29 | ||||
| 2026-04-28 | 13F | SBI Securities Co., Ltd. | 420 | 115,38 | 11 | 57,14 | ||||
| 2026-01-29 | 13F | Sanctuary Advisors, LLC | 0 | -100,00 | 0 | -100,00 | ||||
| 2026-02-12 | 13F | Cloud Capital Management, LLC | 0 | -100,00 | 0 | |||||
| 2026-02-11 | 13F | Jpmorgan Chase & Co | Put | 0 | -100,00 | 0 | -100,00 | |||
| 2026-02-13 | 13F | State Street Corp | 2.499.981 | 3,86 | 98.249 | -33,52 | ||||
| 2026-02-11 | 13F | Empowered Funds, LLC | 198.706 | -19,17 | 7.809 | -48,26 | ||||
| 2026-02-02 | 13F | Wolverine Asset Management Llc | 36.317 | 32,75 | 1.427 | -15,01 | ||||
| 2026-02-17 | 13F | Point72 Asset Management, L.P. | Put | 96.600 | 3.796 | |||||
| 2026-01-30 | 13F | Mitsubishi UFJ Trust & Banking Corp | 17.513 | -39,24 | 688 | -61,11 | ||||
| 2026-02-17 | 13F | Estuary Capital Management LP | 940.592 | 81,90 | 36.965 | 16,43 | ||||
| 2026-02-17 | 13F | Point72 Asset Management, L.P. | Call | 135.000 | 5.306 | |||||
| 2026-01-08 | 13F | Goodman Financial Corp | 118.988 | -47,82 | 4.676 | -66,60 | ||||
| 2025-11-10 | 13F | Optiver Holding B.V. | 0 | -100,00 | 0 | |||||
| 2026-04-21 | 13F | Gilpin Wealth Management, Llc | 10 | 1 | ||||||
| 2026-02-17 | 13F | Susquehanna Portfolio Strategies, LLC | 172.286 | 0,00 | 6.771 | -36,00 | ||||
| 2026-02-13 | 13F | Bridgewater Associates, LP | 29.980 | 1.178 | ||||||
| 2026-02-13 | 13F | Wells Fargo & Company/mn | 133.627 | 9,09 | 5.252 | -30,18 | ||||
| 2026-02-04 | 13F | Virginia Retirement Systems Et Al | 6.250 | 246 | ||||||
| 2026-02-17 | 13F | Anomaly Capital Management, LP | 0 | -100,00 | 0 | |||||
| 2026-02-13 | 13F | Squarepoint Ops LLC | Call | 124.300 | -49,51 | 4.885 | -67,69 | |||
| 2026-02-13 | 13F | Squarepoint Ops LLC | Put | 169.500 | 16,41 | 6.661 | -25,48 | |||
| 2026-02-13 | 13F | Squarepoint Ops LLC | 10.609 | 417 | ||||||
| 2026-02-10 | 13F | Mutual Of America Capital Management Llc | 6.860 | 2,10 | 270 | -34,71 | ||||
| 2026-02-17 | 13F | Cetera Investment Advisers | 15.033 | -17,53 | 591 | -47,27 | ||||
| 2026-02-10 | 13F | Envestnet Asset Management Inc | 9.890 | -81,77 | 389 | -88,35 | ||||
| 2026-02-17 | 13F | Cetera Investment Advisers | Put | 200 | 0 | |||||
| 2025-11-07 | 13F | Shell Asset Management Co | 1.119 | -61,13 | 0 | |||||
| 2026-04-29 | 13F | Oregon Public Employees Retirement Fund | 13.721 | -0,05 | 724 | 34,14 | ||||
| 2026-04-27 | 13F | Counterpoint Mutual Funds LLC | 0 | -100,00 | 0 | |||||
| 2026-02-17 | 13F | Boothbay Fund Management, Llc | 20.000 | 786 | ||||||
| 2026-04-14 | 13F | Bay Harbor Wealth Management, LLC | 10 | 0,00 | 1 | |||||
| 2026-02-09 | 13F | Atlantic Trust, LLC | 0 | -100,00 | 0 | |||||
| 2026-02-17 | 13F | DV Trading LLC | 600 | 24 | ||||||
| 2026-02-11 | 13F | SOUTH STATE Corp | 15 | 0,00 | 1 | |||||
| 2026-02-17 | 13F | Citadel Advisors Llc | 102.380 | 16,64 | 4.024 | -25,35 | ||||
| 2025-11-14 | 13F | Invenomic Capital Management LP | 0 | -100,00 | 0 | -100,00 | ||||
| 2026-02-17 | 13F | Citadel Advisors Llc | Call | 430.300 | -4,40 | 16.911 | -38,81 | |||
| 2026-02-05 | 13F | Gabelli Funds Llc | 86.325 | 31,34 | 3.393 | -15,94 | ||||
| 2026-01-26 | 13F | Icapital Wealth Llc | 0 | -100,00 | 0 | |||||
| 2026-02-13 | 13F | Arkadios Wealth Advisors | 27.967 | 20,74 | 1.099 | -22,71 | ||||
| 2026-02-12 | 13F | Swiss National Bank | 118.300 | 1,89 | 4.649 | -34,78 | ||||
| 2026-04-24 | 13F | Yousif Capital Management, Llc | 18.868 | -2,04 | 995 | 25,16 | ||||
| 2026-02-17 | 13F | Alliancebernstein L.p. | 79.177 | 5,00 | 3.112 | -32,79 | ||||
| 2026-02-17 | 13F | Citadel Advisors Llc | Put | 443.800 | 8,91 | 17.441 | -30,29 | |||
| 2026-02-17 | 13F | Farringdon Capital, Ltd. | 6.061 | 238 | ||||||
| 2026-01-12 | 13F | Rialto Wealth Management, LLC | 5 | 66,67 | 0 | |||||
| 2026-05-01 | 13F | Arizona State Retirement System | 16.487 | -2,39 | 870 | 31,07 | ||||
| 2026-02-13 | 13F | Gen-Wealth Partners Inc | 10 | 0,00 | 0 | |||||
| 2026-05-01 | 13F | HFM Investment Advisors, LLC | 5 | 66,67 | 0 | |||||
| 2026-02-11 | 13F | Cerity Partners LLC | 0 | -100,00 | 0 | |||||
| 2026-02-17 | 13F | Strive Financial Group ,LLC | 529 | 21 | ||||||
| 2025-11-13 | 13F | Limestone Investment Advisors LP | Call | 0 | -100,00 | 0 | -100,00 | |||
| 2025-11-13 | 13F | Limestone Investment Advisors LP | Put | 0 | -100,00 | 0 | -100,00 | |||
| 2026-02-11 | 13F | Gordian Capital Singapore Pte Ltd | 0 | -100,00 | 0 | |||||
| 2026-02-17 | 13F | XTX Topco Ltd | 12.240 | 481 | ||||||
| 2026-02-11 | 13F | Allianz Asset Management GmbH | 689.217 | 17,29 | 27.086 | -24,93 | ||||
| 2025-11-14 | 13F | Clearline Capital LP | 0 | -100,00 | 0 | |||||
| 2026-04-15 | 13F | FNY Investment Advisers, LLC | 420 | -10,64 | 0 | |||||
| 2026-02-04 | 13F | Atlantic Union Bankshares Corp | 850 | 0,00 | 33 | -36,54 | ||||
| 2026-05-01 | 13F | Thrivent Financial For Lutherans | 974.935 | 23,74 | 51 | 70,00 | ||||
| 2026-02-13 | 13F | Transamerica Financial Advisors, Inc. | 21 | -87,43 | 1 | -100,00 | ||||
| 2026-02-17 | 13F | Crawford Fund Management, LLC | Put | 28.500 | 96,55 | 1.120 | 25,84 | |||
| 2026-04-03 | 13F | Investors Research Corp | 5.425 | -3,56 | 286 | 29,41 | ||||
| 2026-02-17 | 13F | Jump Financial, LLC | 130.036 | 394,53 | 5.110 | 216,60 | ||||
| 2026-02-17 | 13F | Dorsal Capital Management, LLC | 700.000 | 0,00 | 27.510 | -35,99 | ||||
| 2026-02-05 | 13F | Bessemer Group Inc | 682 | 61,61 | 0 | |||||
| 2026-01-29 | 13F | Camelot Portfolios, LLC | 0 | 0 | ||||||
| 2026-02-10 | 13F | Basepoint Wealth LLC | 356 | 14 | ||||||
| 2026-02-12 | 13F | Principal Securities, Inc. | 0 | -100,00 | 0 | |||||
| 2026-04-22 | 13F | Motco | 30 | 0,00 | 2 | 0,00 | ||||
| 2025-11-14 | 13F | Mount Yale Investment Advisors, LLC | 0 | -100,00 | 0 | -100,00 | ||||
| 2025-11-17 | 13F | Kestra Investment Management, LLC | 0 | -100,00 | 0 | -100,00 | ||||
| 2026-02-11 | 13F | Jpmorgan Chase & Co | 77.671 | -70,14 | 3.052 | -80,89 | ||||
| 2026-02-11 | 13F | Jpmorgan Chase & Co | Call | 6.800 | -12,82 | 267 | -44,14 | |||
| 2026-02-18 | 13F/A | Fuller & Thaler Asset Management, Inc. | 2.788.748 | -7,14 | 109.598 | -40,56 | ||||
| 2026-02-05 | 13F | Allworth Financial LP | 791 | -35,90 | 31 | -58,67 | ||||
| 2026-02-06 | 13F | Larson Financial Group LLC | 0 | -100,00 | 0 | |||||
| 2026-02-11 | 13F | Illinois Municipal Retirement Fund | 34.401 | 6,55 | 1.352 | -31,84 | ||||
| 2026-02-17 | 13F | Cooper Creek Partners Management Llc | 1.927.406 | 10,63 | 76 | -29,25 | ||||
| 2026-02-17 | 13F | Beaconlight Capital, Llc | 10.920 | -91,93 | 429 | -94,84 | ||||
| 2026-02-13 | 13F | Parkside Financial Bank & Trust | 38 | -47,95 | 1 | -75,00 | ||||
| 2026-02-17 | 13F | Cooper Creek Partners Management Llc | Call | 954.500 | 536,33 | 38 | 311,11 | |||
| 2026-02-17 | 13F | Maple Rock Capital Partners Inc. | 1.352.240 | 42,07 | 53.143 | -9,06 | ||||
| 2026-02-17 | 13F | LMR Partners LLP | Call | 15.500 | 609 | |||||
| 2025-11-14 | 13F | Wolverine Trading, Llc | Put | 108.300 | -29,49 | 6.817 | -4,55 | |||
| 2026-05-01 | 13F | Rakuten Securities, Inc. | 40 | -63,64 | 2 | -50,00 | ||||
| 2026-02-10 | 13F | REAP Financial Group, LLC | 9 | -98,46 | 0 | -100,00 | ||||
| 2026-02-13 | 13F | Alerus Financial Na | 0 | -100,00 | 0 | |||||
| 2026-04-28 | 13F | Stephens Inc /ar/ | 38.188 | -0,10 | 2.014 | 34,09 | ||||
| 2026-02-17 | 13F | Pine Valley Investments Ltd Liability Co | Call | 1.781 | 32,05 | |||||
| 2025-11-13 | 13F | Glenmede Investment Management, LP | 4.798 | 295 | ||||||
| 2026-02-17 | 13F | J. Goldman & Co LP | 10.500 | -86,69 | 413 | -91,49 | ||||
| 2026-02-17 | 13F | J. Goldman & Co LP | Call | 45.500 | -32,59 | 1.788 | -56,85 | |||
| 2026-02-17 | 13F | Price T Rowe Associates Inc /md/ | 7.474.546 | 18,94 | 294 | -23,90 | ||||
| 2026-02-12 | 13F | Dimensional Fund Advisors Lp | 1.845.357 | -8,91 | 72.524 | -41,70 | ||||
| 2026-04-29 | 13F | CVA Family Office, LLC | 39 | 254,55 | 2 | |||||
| 2025-11-14 | 13F | Wolverine Trading, Llc | 10.899 | 686 | ||||||
| 2026-02-17 | 13F | Quantinno Capital Management LP | 30.155 | 46,19 | 1.185 | -6,40 | ||||
| 2025-11-14 | 13F | Wolverine Trading, Llc | Call | 190.400 | -6,21 | 11.986 | 26,97 | |||
| 2026-04-14 | 13F | American State Bank (Iowa) | 0 | -100,00 | 0 | |||||
| 2026-04-28 | 13F | Bogart Wealth, LLC | 21 | 0,00 | 1 | |||||
| 2026-02-09 | 13F | Annis Gardner Whiting Capital Advisors, LLC | 51 | -10,53 | 2 | -33,33 | ||||
| 2026-02-17 | 13F | Shay Capital LLC | Call | 0 | -100,00 | 0 | ||||
| 2026-02-17 | 13F | Veradace Capital Management LLC | Call | 200.000 | 7.860 | |||||
| 2026-02-17 | 13F | Two Sigma Investments, Lp | 118.068 | 0,00 | 4.640 | -35,99 | ||||
| 2026-04-27 | 13F | Victory Financial Group, Llc | 7.463 | 394 | ||||||
| 2026-01-16 | 13F | Sims Investment Management, Llc | 0 | -100,00 | 0 |