Basisstatistiken
| Institutionelle Eigentümer | 191 total, 190 long only, 0 short only, 1 long/short - change of -3,54% MRQ |
| Durchschnittliche Portfolioallokation | 0.1272 % - change of -15,74% MRQ |
| Institutionelle Aktien (Long) | 6.476.154 (ex 13D/G) - change of -0,50MM shares -7,18% MRQ |
| Institutioneller Wert (Long) | $ 370.169 USD ($1000) |
Institutioneller Eigentümerschaft und Aktionäre
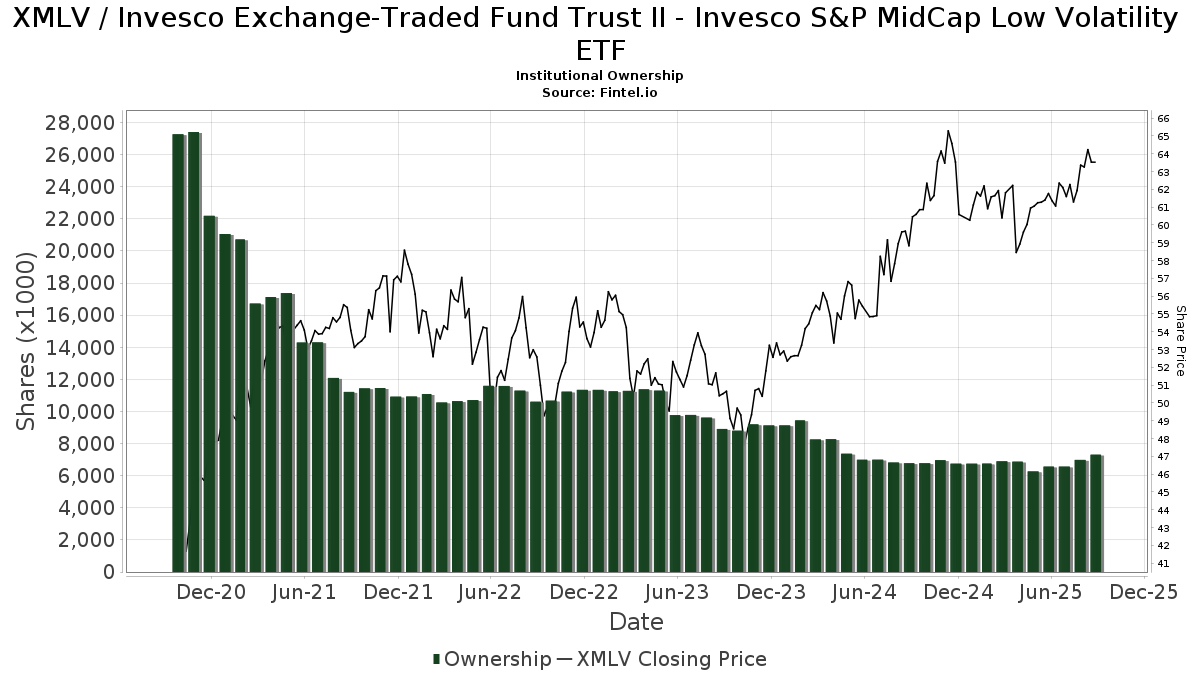
Invesco Exchange-Traded Fund Trust II - Invesco S&P MidCap Low Volatility ETF (US:XMLV) hat 191 institutionelle Eigentümer und Aktionäre, die 13D/G oder 13F Formulare bei der Securities Exchange Commission (SEC) eingereicht haben. Diese Institutionen halten insgesamt 6,476,154 Aktien. Die größten Aktionäre sind LPL Financial LLC, Morgan Stanley, Boothbay Fund Management, Llc, Cambridge Investment Research Advisors, Inc., Brookstone Capital Management, UBS Group AG, DORVAL Corp, Envestnet Asset Management Inc, Pnc Financial Services Group, Inc., and Ameriprise Financial Inc .
Invesco Exchange-Traded Fund Trust II - Invesco S&P MidCap Low Volatility ETF (ARCA:XMLV) Die institutionelle Eigentümerstruktur zeigt die aktuellen Positionen von Institutionen und Fonds im Unternehmen sowie die jüngsten Veränderungen der Positionsgröße. Zu den Großaktionären können Einzelanleger, Investmentfonds, Hedgefonds oder Institutionen gehören. Der Schedule 13D zeigt an, dass der Investor mehr als 5% des Unternehmens hält (oder gehalten hat) und beabsichtigt (oder beabsichtigt hat), aktiv eine Änderung der Geschäftsstrategie zu verfolgen. Schedule 13G zeigt eine passive Investition von über 5% an.
The share price as of April 24, 2026 is 65,49 / share. Previously, on April 28, 2025, the share price was 59,96 / share. This represents an increase of 9,22% over that period.
Fondsstimmung-Score
Der Fondsstimmung-Score (auch bekannt als Eigentümer-Akkumulations-Score) ermittelt die Aktien, die am meisten von Fonds gekauft werden. Er ist das Ergebnis eines ausgeklügelten quantitativen Multifaktormodells, das die Unternehmen mit den höchsten institutionellen Käufen identifiziert. Das Scoring-Modell verwendet eine Kombination aus der Gesamtzunahme der offengelegten Eigentümer, den Änderungen der Portfolioallokationen in diesen Eigentümern und anderen Metriken. Die Zahl reicht von 0 bis 100, wobei höhere Zahlen ein höheres Maß an Kapitalakkumulation als bei anderen Unternehmen anzeigen und 50 den Durchschnitt darstellt.
Aktualisierungshäufigkeit: Täglich
Siehe Ownership Explorer, der eine Liste der am höchsten bewerteten Unternehmen enthält.
AI+ Ask Fintel’s AI assistant about Invesco Exchange-Traded Fund Trust II - Invesco S&P MidCap Low Volatility ETF.
Select a question to share a public post with an AI-crafted answer.
Thinking of good questions…
Institutionelles Put/Call-Verhältnis
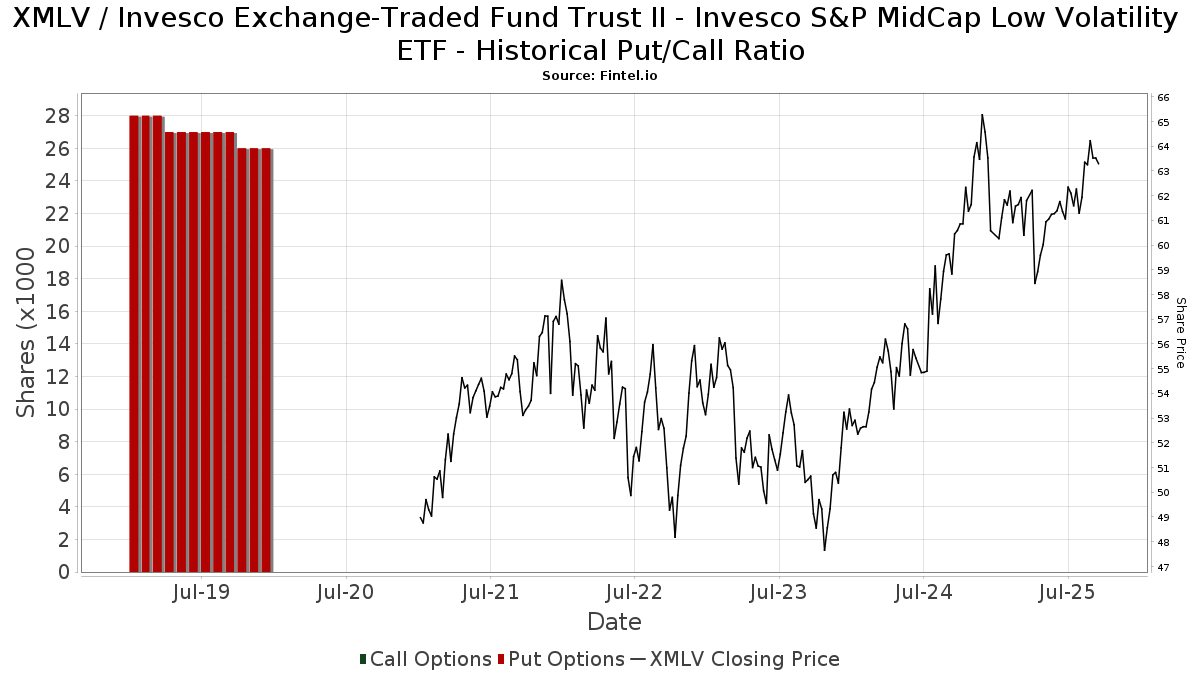
Zusätzlich zur Meldung der Standardemissionen von Aktien und Schuldtiteln müssen Institute mit einem verwalteten Vermögen von mehr als 100 Mio. EUR auch ihre Bestände an Verkaufs- und Kaufoptionen offenlegen. Da Put-Optionen im Allgemeinen eine negative Stimmung und Call-Optionen eine positive Stimmung anzeigen, können wir uns ein Bild von der allgemeinen institutionellen Stimmung machen, indem wir das Verhältnis von Puts zu Calls aufzeichnen. Das Diagramm auf der rechten Seite zeigt das historische Put/Call-Verhältnis für dieses Instrument.
Die Verwendung des Put/Call-Verhältnisses als Indikator für die Anlegerstimmung überwindet einen der Hauptmängel der Verwendung des gesamten institutionellen Besitzes, der darin besteht, dass ein erheblicher Teil des verwalteten Vermögens passiv investiert wird, um Indizes abzubilden. Passiv verwaltete Fonds kaufen in der Regel keine Optionen, so dass der Indikator Put/Call-Verhältnis die Stimmung der aktiv verwalteten Fonds besser widerspiegelt.
13F und NPORT Einreichungen
Details zu 13F-Einreichungen sind kostenlos. Für Details zu NP-Einreichungen ist eine Premium-Mitgliedschaft erforderlich. Grüne Zeilen zeigen neue Positionen an. Rote Zeilen zeigen geschlossene Positionen an. Klicken Sie auf das Link Symbol, um den gesamten Transaktionsverlauf zu sehen.
Upgrade
um Prämiendaten freizuschalten und nach Excel zu exportieren ![]() .
.
| Datei Datum | Quelle | Anleger | Typ | Durchschnittlicher Preis (Est) |
Aktien | Δ Aktien (%) |
Gemeldeter Wert ($1000) |
Δ Wert (%) |
Port Alloc (%) |
|
|---|---|---|---|---|---|---|---|---|---|---|
| 2026-02-06 | 13F | Portland Financial Advisors Inc | 11.089 | 0,00 | 692 | -1,85 | ||||
| 2025-11-12 | 13F | Transce3nd, LLC | 0 | -100,00 | 0 | -100,00 | ||||
| 2026-02-17 | 13F | IHT Wealth Management, LLC | 0 | -100,00 | 0 | -100,00 | ||||
| 2026-02-17 | 13F | Mercer Global Advisors Inc /adv | 116.981 | -3,64 | 7.296 | -5,46 | ||||
| 2026-02-02 | 13F | Fifth Third Bancorp | 4.492 | 0,00 | 280 | -1,75 | ||||
| 2026-02-18 | 13F | EP Wealth Advisors, Inc. | 3.232 | 2,28 | 202 | 3,61 | ||||
| 2026-02-10 | 13F | Avestar Capital, LLC | 15.087 | 0,86 | 941 | -1,05 | ||||
| 2026-02-13 | 13F | Arkadios Wealth Advisors | 16.550 | -9,00 | 1.032 | -10,65 | ||||
| 2026-01-26 | 13F | Cwm, Llc | 8.765 | 4,76 | 1 | |||||
| 2026-02-13 | 13F | Gen-Wealth Partners Inc | 1.833 | 0,00 | 114 | -1,72 | ||||
| 2025-11-14 | 13F | Jane Street Group, Llc | 0 | -100,00 | 0 | |||||
| 2026-02-17 | 13F | Qube Research & Technologies Ltd | 102 | 0,00 | 6 | 0,00 | ||||
| 2025-11-25 | 13F | Briaud Financial Planning, Inc | 0 | -100,00 | 0 | |||||
| 2026-02-17 | 13F | Boothbay Fund Management, Llc | Put | 152.800 | -8,39 | 12.880 | -1,27 | |||
| 2026-02-17 | 13F | Boothbay Fund Management, Llc | Call | 546.800 | -11,20 | 46.090 | -4,30 | |||
| 2026-04-20 | 13F | Kestra Private Wealth Services, Llc | 4.642 | 15,04 | 292 | 16,33 | ||||
| 2026-02-10 | 13F | Evolution Wealth Management Inc. | 940 | 0,00 | 59 | -1,69 | ||||
| 2026-04-13 | 13F | Creative Financial Designs Inc /adv | 178 | 0,00 | 11 | 0,00 | ||||
| 2026-02-12 | 13F | Great Valley Advisor Group, Inc. | 6.287 | -0,47 | 392 | -2,24 | ||||
| 2026-02-13 | 13F | MAI Capital Management | 4.176 | 2,96 | 260 | 1,17 | ||||
| 2026-01-23 | 13F | Assetmark, Inc | 47 | -9,62 | 3 | -33,33 | ||||
| 2026-04-22 | 13F | Spire Wealth Management | 145 | 0,00 | 9 | 0,00 | ||||
| 2026-04-20 | 13F | Jfs Wealth Advisors, Llc | 21.121 | -1,40 | 1.330 | -0,45 | ||||
| 2026-02-13 | 13F | Golden State Wealth Management, LLC | 20.564 | 0,46 | 1.283 | -1,46 | ||||
| 2026-04-16 | 13F | Brookstone Capital Management | 306.429 | 3,37 | 19.296 | 4,37 | ||||
| 2026-04-21 | 13F | Sensible Money, LLC | 4.275 | 0,00 | 269 | 1,13 | ||||
| 2026-04-14 | 13F | Well Done, LLC | 10.685 | -0,64 | 673 | 0,30 | ||||
| 2026-02-05 | 13F | Allworth Financial LP | 0 | -100,00 | 0 | |||||
| 2026-02-11 | 13F | Capital Analysts, Inc. | 21.609 | -5,18 | 1 | 0,00 | ||||
| 2026-02-17 | 13F | Jones Financial Companies Lllp | 141.842 | 8,12 | 8.846 | 6,48 | ||||
| 2025-11-13 | 13F | Obsidian Personal Planning Solutions LLC | 128.079 | 2,59 | 7.919 | 2,86 | ||||
| 2026-04-20 | 13F | City State Bank | 427 | 0,00 | 27 | 0,00 | ||||
| 2026-02-10 | 13F | CFS Investment Advisory Services, LLC | 4.165 | -0,64 | 260 | -1,89 | ||||
| 2026-02-13 | 13F | Jacobi Capital Management LLC | 6.494 | 405 | ||||||
| 2025-11-14 | 13F | Tower Research Capital LLC (TRC) | 0 | -100,00 | 0 | |||||
| 2026-02-13 | 13F | Citigroup Inc | 10.885 | -8,45 | 679 | -10,20 | ||||
| 2026-02-17 | 13F | Ameriprise Financial Inc | 183.440 | -13,17 | 11.450 | -14,74 | ||||
| 2026-02-17 | 13F | Advisory Services Network, LLC | 0 | -100,00 | 0 | |||||
| 2026-01-14 | 13F | CPR Investments Inc. | 0 | -100,00 | 0 | |||||
| 2026-02-09 | 13F | Harbour Investments, Inc. | 40.156 | 26,31 | 2.504 | 23,96 | ||||
| 2026-02-13 | 13F | Resources Investment Advisors, LLC. | 4.490 | -56,90 | 280 | -57,70 | ||||
| 2026-02-06 | 13F | GPS Wealth Strategies Group, LLC | 0 | -100,00 | 0 | |||||
| 2026-03-04 | 13F | SHP Wealth Management | 280 | 17 | ||||||
| 2026-04-23 | 13F | Summit Wealth Group Llc / Co | 5.606 | 353 | ||||||
| 2026-02-13 | 13F | Avid Wealth Partners LLC | 0 | -100,00 | 0 | -100,00 | ||||
| 2026-02-12 | 13F | CIBC Private Wealth Group, LLC | 2.558 | -2,37 | 160 | -4,22 | ||||
| 2025-11-06 | 13F | Financial Advocates Investment Management | 0 | -100,00 | 0 | -100,00 | ||||
| 2026-04-07 | 13F | Farther Finance Advisors, LLC | 2.695 | 0,07 | 170 | 1,20 | ||||
| 2026-02-10 | 13F | Thoroughbred Financial Services, Llc | 3.285 | 0,00 | 0 | |||||
| 2026-02-10 | 13F | Syntegra Private Wealth Group, LLC | 7.977 | -0,32 | 498 | -2,17 | ||||
| 2026-02-17 | 13F | Wealth Watch Advisors, INC | 0 | -100,00 | 0 | |||||
| 2026-02-10 | 13F | DT Investment Partners, LLC | 74 | 5 | ||||||
| 2026-04-14 | 13F | Nova Wealth Management, Inc. | 1.889 | -28,96 | 119 | -28,48 | ||||
| 2026-02-17 | 13F | Aqr Capital Management Llc | 8.853 | 0,00 | 552 | -1,78 | ||||
| 2026-04-09 | 13F | PFS Partners, LLC | 130.833 | 2,30 | 8.239 | 3,28 | ||||
| 2026-02-12 | 13F | Leigh Baldwin & Co., Llc | 0 | -100,00 | 0 | -100,00 | ||||
| 2025-10-31 | 13F | Sovran Advisors, LLC | 0 | -100,00 | 0 | |||||
| 2026-04-21 | 13F | Meridian Financial, LLC | 4.411 | 0,00 | 278 | 0,73 | ||||
| 2026-02-10 | 13F | Marshall & Sterling Wealth Advisors Inc. | 586 | 0,51 | 37 | 0,00 | ||||
| 2026-01-26 | 13F | Whittier Trust Co Of Nevada Inc | 85 | 0,00 | 5 | 0,00 | ||||
| 2026-02-05 | 13F | Moneywise, Inc. | 13.232 | -2,70 | 825 | -4,51 | ||||
| 2026-02-10 | 13F | Spectrum Wealth Advisory Group, LLC | 8.356 | 0,07 | 521 | -1,70 | ||||
| 2026-02-13 | 13F | Avant Capital LLC | 8.025 | -2,06 | 501 | -3,85 | ||||
| 2026-01-23 | 13F | Creative Capital Management Investments LLC | 0 | -100,00 | 0 | |||||
| 2026-02-17 | 13F | Bank Of America Corp /de/ | 121.657 | -3,24 | 7.587 | -5,06 | ||||
| 2026-02-11 | 13F | O'shaughnessy Asset Management, Llc | 60 | 0,00 | 4 | 0,00 | ||||
| 2026-02-12 | 13F | FineMark National Bank & Trust | 21.131 | 2,15 | 1.318 | 0,23 | ||||
| 2026-02-17 | 13F | Two Sigma Investments, Lp | 36.500 | 15,87 | 2.276 | 13,69 | ||||
| 2026-02-03 | 13F | International Assets Investment Management, Llc | 4.229 | -3,49 | 264 | -3,31 | ||||
| 2026-02-13 | 13F | MorganRosel Wealth Management, LLC | 16.983 | -82,05 | 1.059 | -82,39 | ||||
| 2026-02-17 | 13F | United Capital Financial Advisers, Llc | 14.296 | -0,69 | 892 | -2,62 | ||||
| 2026-02-10 | 13F/A | Northwestern Mutual Wealth Management Co | 81.088 | 6,66 | 5.057 | 4,66 | ||||
| 2026-02-06 | 13F | HighTower Advisors, LLC | 41.389 | -3,32 | 2.581 | -5,15 | ||||
| 2026-04-06 | 13F | CX Institutional | 408 | 0,74 | 0 | |||||
| 2026-02-06 | 13F | Commonwealth Financial Services, LLC | 5.669 | -3,83 | 354 | -5,61 | ||||
| 2026-02-17 | 13F | Raymond James Financial Inc | 179.622 | -15,30 | 11.203 | -16,89 | ||||
| 2026-02-19 | 13F | Invesco Ltd. | 0 | -100,00 | 0 | |||||
| 2026-02-10 | 13F | Rothschild Investment Llc | 2.000 | 0,00 | 125 | -2,36 | ||||
| 2026-02-13 | 13F | Kestra Advisory Services, LLC | 0 | -100,00 | 0 | |||||
| 2026-01-26 | 13F | AE Wealth Management LLC | 619 | 0,16 | 39 | -2,56 | ||||
| 2026-04-08 | 13F | Dynamic Advisor Solutions LLC | 6.698 | 0,03 | 422 | 0,96 | ||||
| 2026-02-12 | 13F | Insigneo Advisory Services, Llc | 6.502 | 0,68 | 405 | -1,22 | ||||
| 2025-11-12 | 13F | Redwood Financial Network Corp | 0 | -100,00 | 0 | |||||
| 2026-02-12 | 13F | Hrt Financial Lp | 3.419 | 7,55 | 0 | |||||
| 2026-02-13 | 13F | Pacific Center for Financial Services | 4.397 | 0,00 | 279 | 0,00 | ||||
| 2026-04-17 | 13F | Monticello Wealth Management, Llc | 15.225 | -2,37 | 959 | -1,44 | ||||
| 2026-04-24 | 13F | Wagner Wealth Management, Llc | 25 | 0,00 | 2 | 0,00 | ||||
| 2026-02-10 | 13F | Basepoint Wealth LLC | 458 | 29 | ||||||
| 2026-04-20 | 13F | SILVER OAK SECURITIES, Inc | 2.294 | -29,80 | 144 | -29,76 | ||||
| 2026-02-04 | 13F | Tsfg, Llc | 150 | 0,00 | 0 | |||||
| 2026-02-11 | 13F | Milestone Investment Advisors LLC | 224 | -12,50 | 14 | -18,75 | ||||
| 2026-04-22 | 13F | Janney Montgomery Scott LLC | 15.234 | -2,06 | 1 | |||||
| 2026-01-21 | 13F | Flagship Harbor Advisors, Llc | 525 | 33 | ||||||
| 2026-02-17 | 13F | Creative Planning | 6.873 | 6,53 | 429 | 4,39 | ||||
| 2026-02-06 | 13F | Larson Financial Group LLC | 620 | -0,32 | 39 | -2,56 | ||||
| 2026-04-14 | 13F | Wealthcare Advisory Partners LLC | 8.037 | 0,00 | 506 | 1,00 | ||||
| 2026-02-10 | 13F | Daiwa Securities Group Inc. | 7.200 | 0,00 | 0 | |||||
| 2026-04-22 | 13F | DORVAL Corp | 261.731 | 3,03 | 16.481 | 4,02 | ||||
| 2026-02-17 | 13F | Blair William & Co/il | 220 | -84,12 | 14 | -85,23 | ||||
| 2026-04-17 | 13F | Roxbury Financial LLC | 306 | 0,33 | 19 | 5,56 | ||||
| 2026-02-11 | 13F | LPL Financial LLC | 675.286 | 11,44 | 42.116 | 9,36 | ||||
| 2026-02-17 | 13F | Private Advisor Group, LLC | 13.799 | -4,89 | 861 | -6,72 | ||||
| 2026-04-21 | 13F | Strategic Equity Management | 5.792 | -52,76 | 365 | -52,36 | ||||
| 2026-02-20 | 13F | Sunbelt Securities, Inc. | 1 | 0,00 | 0 | |||||
| 2025-11-13 | 13F | Total Investment Management Inc | 0 | -100,00 | 0 | |||||
| 2026-04-09 | 13F | DHJJ Financial Advisors, Ltd. | 527 | 0,76 | 33 | 3,13 | ||||
| 2026-02-04 | 13F | Biltmore Family Office, LLC | 100 | 0,00 | 6 | 0,00 | ||||
| 2026-02-13 | 13F | Visionary Wealth Advisors | 14.120 | -0,08 | 881 | -2,00 | ||||
| 2026-01-21 | 13F | Rocky Mountain Advisers, Llc | 4.075 | 0,00 | 254 | -1,93 | ||||
| 2026-02-13 | 13F | Mml Investors Services, Llc | 52.504 | -2,01 | 3.275 | -3,85 | ||||
| 2026-02-05 | 13F | Petix & Botte Co | 7.728 | 0,03 | 482 | -2,04 | ||||
| 2026-01-29 | 13F | Comerica Bank | 1.173 | -10,11 | 73 | -10,98 | ||||
| 2026-02-10 | 13F/A | LVZ Advisors, Inc. | 3.421 | 0,00 | 213 | -1,84 | ||||
| 2026-01-09 | 13F | Marshall Financial Group LLC | 0 | -100,00 | 0 | |||||
| 2026-02-17 | 13F | Cetera Investment Advisers | 88.281 | 21,94 | 5.506 | 19,65 | ||||
| 2026-02-17 | 13F | Russell Investments Group, Ltd. | 5 | -86,49 | 0 | -100,00 | ||||
| 2026-01-29 | 13F | ProVise Management Group, LLC | 71.508 | 10,44 | 4.460 | 8,36 | ||||
| 2026-02-13 | 13F | Change Path, LLC | 18.207 | 4,31 | 1.136 | 2,34 | ||||
| 2026-04-20 | 13F | Hilton Head Capital Partners, LLC | 132 | 0,76 | 8 | 0,00 | ||||
| 2026-01-29 | 13F | D.a. Davidson & Co. | 4.826 | -1,57 | 301 | -3,22 | ||||
| 2026-02-17 | 13F | Advisor Group Holdings, Inc. | 65.055 | -13,97 | 4.059 | -15,91 | ||||
| 2025-11-04 | 13F | Win Advisors, Inc | 0 | -100,00 | 0 | |||||
| 2026-02-12 | 13F | TopTier Wealth Management, LLC | 4.575 | 285 | ||||||
| 2026-02-12 | 13F | Front Row Advisors LLC | 935 | 0,00 | 58 | -1,69 | ||||
| 2026-02-12 | 13F | Commonwealth Equity Services, Llc | 174.148 | -4,67 | 10.861 | 98.636,36 | ||||
| 2026-02-12 | 13F | Grey Fox Wealth Advisors, LLC | 0 | -100,00 | 0 | |||||
| 2026-02-13 | 13F | Morgan Stanley | 619.290 | 3,05 | 38.624 | 1,12 | ||||
| 2026-01-21 | 13F | Petra Financial Advisors Inc | 6.219 | 0,21 | 388 | -1,78 | ||||
| 2026-02-05 | 13F | Pacific Sun Financial Corp | 20.475 | -3,17 | 1.277 | -4,99 | ||||
| 2026-02-12 | 13F | Steward Partners Investment Advisory, Llc | 8.249 | -0,36 | 514 | -2,28 | ||||
| 2026-04-20 | 13F | Ronald Blue Trust, Inc. | 31 | 0,00 | 2 | 0,00 | ||||
| 2026-04-08 | 13F | Wealth Enhancement Advisory Services, Llc | 7.576 | -32,53 | 483 | -32,02 | ||||
| 2026-02-04 | 13F | Ameritas Advisory Services, LLC | 5.038 | -51,21 | 314 | -52,13 | ||||
| 2026-02-13 | 13F | Stifel Financial Corp | 31.469 | -1,13 | 1.963 | -3,02 | ||||
| 2025-10-30 | 13F | Ridgewood Investments LLC | 0 | -100,00 | 0 | |||||
| 2026-01-23 | 13F | Ogorek Anthony Joseph /ny/ /adv | 100 | 0,00 | 0 | |||||
| 2026-04-15 | 13F | Johnson & White Wealth Management, LLC | 34.057 | 0,14 | 2.145 | 1,08 | ||||
| 2026-04-17 | 13F | Ambassador Advisors, LLC | 3.905 | -5,97 | 246 | -5,41 | ||||
| 2026-02-25 | 13F | Tempo Wealth, LLC | 19.297 | 1.204 | ||||||
| 2026-04-24 | 13F | ERn Financial, LLC | 8.274 | 0,00 | 521 | 0,97 | ||||
| 2026-02-10 | 13F | Goldman Sachs Group Inc | 8.249 | -12,36 | 514 | -14,05 | ||||
| 2026-01-23 | 13F | Rsm Us Wealth Management Llc | 9.559 | -0,61 | 601 | -1,64 | ||||
| 2026-02-17 | 13F | Warren Averett Asset Management, LLC | 10.369 | -7,20 | 647 | -9,01 | ||||
| 2026-04-22 | 13F | Pinnacle Bancorp, Inc. | 4.200 | 0,00 | 264 | 1,15 | ||||
| 2026-01-29 | 13F | Atlas Legacy Advisors, LLC | 5.580 | -1,74 | 348 | -3,33 | ||||
| 2026-02-11 | 13F | Jpmorgan Chase & Co | 5.871 | -96,00 | 366 | -96,07 | ||||
| 2026-01-16 | 13F | Trust Co Of Vermont | 250 | 16 | ||||||
| 2026-02-02 | 13F | Truist Financial Corp | 0 | -100,00 | 0 | |||||
| 2026-02-06 | 13F | Pnc Financial Services Group, Inc. | 214.049 | 2,72 | 13.350 | 0,79 | ||||
| 2026-02-17 | 13F | Snowden Capital Advisors LLC | 12.585 | 0,54 | 785 | -1,38 | ||||
| 2026-01-30 | 13F | Laurel Wealth Advisors LLC | 638 | 40 | ||||||
| 2026-02-12 | 13F | Richmond Investment Services, LLC | 5.874 | 0,26 | 366 | -1,61 | ||||
| 2026-04-16 | 13F | Capital Advisors, Ltd. LLC | 525 | 0,00 | 0 | |||||
| 2026-04-08 | 13F | Accel Wealth Management | 6.210 | 2,05 | 391 | 3,17 | ||||
| 2026-02-17 | 13F | Royal Bank Of Canada | 94.582 | 27,03 | 5.899 | 24,66 | ||||
| 2026-02-10 | 13F | Bank of New York Mellon Corp | 3.974 | 4,14 | 248 | 2,07 | ||||
| 2026-02-13 | 13F | SRS Capital Advisors, Inc. | 2.444 | -96,92 | 152 | -98,39 | ||||
| 2026-02-13 | 13F | Wells Fargo & Company/mn | 89.364 | -11,70 | 5.573 | -13,36 | ||||
| 2026-02-12 | 13F | Summit Financial, LLC | 3.994 | 0,03 | 249 | -1,58 | ||||
| 2026-02-13 | 13F | Wbi Investments, Inc. | 22.894 | -5,12 | 1.428 | -6,91 | ||||
| 2026-04-07 | 13F | Park Avenue Securities Llc | 5.461 | 5,02 | 0 | |||||
| 2026-02-06 | 13F | EverSource Wealth Advisors, LLC | 0 | -100,00 | 0 | |||||
| 2026-02-17 | 13F | Fmr Llc | 8.516 | 12,45 | 531 | 10,40 | ||||
| 2026-02-17 | 13F | SageView Advisory Group, LLC | 135 | 8 | ||||||
| 2026-02-13 | 13F | Baird Financial Group, Inc. | 164.862 | 7,08 | 10.282 | 5,08 | ||||
| 2026-04-07 | 13F | Investment Partners Asset Management, Inc. | 24.053 | 42,84 | 1.515 | 44,19 | ||||
| 2026-02-03 | 13F | Lmcg Investments, Llc | 42.786 | 5,57 | 2.668 | 3,61 | ||||
| 2026-01-28 | 13F | Geneos Wealth Management Inc. | 531 | 0,00 | 33 | 0,00 | ||||
| 2026-02-13 | 13F | Inspire Advisors, LLC | 6.578 | 1,84 | 410 | 0,00 | ||||
| 2026-01-22 | 13F | Harwood Advisory Group, LLC | 0 | -100,00 | 0 | |||||
| 2026-02-12 | 13F | Brinker Capital Investments, LLC | 12.041 | -0,16 | 751 | -2,09 | ||||
| 2026-04-07 | 13F | Comprehensive Financial Planning, Inc./PA | 470 | 0,86 | 30 | 0,00 | ||||
| 2026-01-29 | 13F | UBS Group AG | 296.164 | -0,49 | 18.471 | -2,36 | ||||
| 2025-11-04 | 13F | Money Concepts Capital Corp | 0 | -100,00 | 0 | |||||
| 2026-04-24 | 13F | Essex Financial Services, Inc. | 10.673 | 0,44 | 672 | 1,51 | ||||
| 2026-02-10 | 13F | Calton & Associates, Inc. | 27.040 | -11,69 | 1.686 | -13,36 | ||||
| 2026-04-17 | 13F | Provident Wealth Management, LLC | 2 | 0,00 | 0 | |||||
| 2026-01-21 | 13F | Capital Investment Advisory Services, LLC | 228 | 0,00 | 14 | 0,00 | ||||
| 2026-02-23 | 13F | Virtu Financial LLC | 8.305 | 21,13 | 1 | |||||
| 2026-02-17 | 13F | Susquehanna International Group, Llp | 23.139 | 149,07 | 1.443 | 144,58 | ||||
| 2026-02-10 | 13F | Hazlett, Burt & Watson, Inc. | 1.973 | 0,71 | 0 | |||||
| 2026-01-26 | 13F | Asset Dedication, LLC | 4.275 | 0,00 | 267 | -1,85 | ||||
| 2026-01-21 | 13F | Prime Capital Investment Advisors, LLC | 38.723 | 1,08 | 2.415 | -0,78 | ||||
| 2026-04-15 | 13F | Merit Financial Group, LLC | 144.515 | 6,09 | 9.100 | 7,12 | ||||
| 2026-02-19 | 13F/A | Axxcess Wealth Management, Llc | 5.580 | 348 | ||||||
| 2026-02-10 | 13F | Envestnet Asset Management Inc | 232.584 | -16,93 | 14.506 | -18,49 | ||||
| 2026-01-29 | 13F | Ashton Thomas Private Wealth, LLC | 6.560 | 0,00 | 409 | -1,68 | ||||
| 2025-11-12 | 13F | Kingsview Wealth Management, LLC | 0 | -100,00 | 0 | |||||
| 2026-04-16 | 13F | Evolve Private Wealth, Llc | 4.342 | 0,00 | 273 | 1,11 | ||||
| 2025-10-31 | 13F | Global Assets Advisory, LLC | 0 | -100,00 | 0 | |||||
| 2026-04-13 | 13F | Massmutual Trust Co Fsb/adv | 24.216 | 23,05 | 1.525 | 24,21 | ||||
| 2026-04-17 | 13F | Brown, Lisle/cummings, Inc. | 2.931 | 0,27 | 185 | 1,10 | ||||
| 2026-02-17 | 13F | Harvest Investment Services, LLC | 6.232 | 15,97 | 389 | 13,78 | ||||
| 2026-02-17 | 13F | Prosperity Consulting Group, LLC | 10.228 | 101,22 | 638 | 97,21 | ||||
| 2026-04-17 | 13F | High Net Worth Advisory Group LLC | 4.450 | 0,00 | 280 | 1,08 | ||||
| 2026-02-06 | 13F | Global Retirement Partners, LLC | 0 | -100,00 | 0 | |||||
| 2026-02-18 | 13F | GWM Advisors LLC | 1.822 | -98,16 | 114 | -98,21 | ||||
| 2026-02-05 | 13F | Dana Investment Advisors, Inc. | 6.107 | 0,00 | 381 | -2,06 | ||||
| 2026-04-14 | 13F | ACT Advisors, LLC. | 3.950 | -0,55 | 249 | 0,40 | ||||
| 2026-04-21 | 13F | Trilogy Capital Inc. | 4.066 | 0,00 | 256 | 1,19 | ||||
| 2026-01-21 | 13F | Sound Income Strategies, LLC | 128 | 0,00 | 8 | 0,00 | ||||
| 2026-02-12 | 13F | Principal Securities, Inc. | 0 | -100,00 | 0 | |||||
| 2026-02-06 | 13F | Synergy Investment Management, LLC | 8.321 | -6,09 | 519 | -7,99 | ||||
| 2026-01-23 | 13F | Destiny Capital Corp/CO | 11.207 | -1,04 | 699 | -2,92 | ||||
| 2026-02-13 | 13F | Mariner, LLC | 33.512 | -3,38 | 2.090 | -5,17 | ||||
| 2026-04-15 | 13F | Signature Estate & Investment Advisors Llc | 29.605 | 5,34 | 1.864 | 6,39 | ||||
| 2026-04-14 | 13F | Legacy Trust | 4.414 | 0,00 | 278 | 0,73 | ||||
| 2026-04-07 | 13F | U.S. Capital Wealth Advisors, LLC | 38.411 | 27,15 | 2.419 | 28,34 | ||||
| 2026-04-23 | 13F | J.w. Cole Advisors, Inc. | 9.372 | -0,07 | 590 | 151,06 | ||||
| 2026-02-06 | 13F | Kingdom Financial Group LLC. | 67 | 4 | ||||||
| 2026-02-05 | 13F | Cambridge Investment Research Advisors, Inc. | 474.544 | -12,48 | 30 | -14,71 | ||||
| 2026-04-09 | 13F | Sculati Wealth Management, LLC | 10.278 | -10,56 | 647 | -9,64 | ||||
| 2026-02-17 | 13F | Citadel Advisors Llc | 0 | -100,00 | 0 | |||||
| 2026-02-17 | 13F | Wiley Bros.-aintree Capital, Llc | 5.389 | -3,42 | 336 | -5,08 | ||||
| 2026-04-07 | 13F | CoreCap Advisors, LLC | 76 | 0,00 | 5 | 0,00 | ||||
| 2026-04-09 | 13F | Whitaker-Myers Wealth Managers, LTD. | 6.019 | -10,94 | 379 | -10,21 | ||||
| 2025-11-06 | 13F | REAP Financial Group, LLC | 0 | -100,00 | 0 | -100,00 | ||||
| 2026-04-13 | 13F | IFP Advisors, Inc | 470 | 0,00 | 30 | 0,00 | ||||
| 2026-02-17 | 13F | Equitable Holdings, Inc. | 37.670 | -19,10 | 2.349 | -20,62 | ||||
| 2026-02-19 | 13F | ATX Financial Planning, LLC | 4.382 | 273 | ||||||
| 2026-04-16 | 13F | Sheets Smith Wealth Management | 8.987 | -13,85 | 566 | -13,08 | ||||
| 2026-02-13 | 13F | Flow Traders U.s. Llc | 0 | -100,00 | 0 | |||||
| 2026-01-30 | 13F | Us Bancorp \de\ | 1.385 | 0,00 | 86 | -2,27 | ||||
| 2026-02-13 | 13F | Liberty One Investment Management, Llc | 0 | -100,00 | 0 | |||||
| 2026-02-11 | 13F | Cerity Partners LLC | 4.226 | -5,06 | 264 | -6,74 | ||||
| 2026-02-14 | 13F | Rockefeller Capital Management L.P. | 4.909 | 0,16 | 306 | -1,61 | ||||
| 2026-04-22 | 13F | Clear Creek Financial Management, LLC | 14.114 | -2,12 | 889 | -1,22 | ||||
| 2026-02-17 | 13F | North Capital, Inc. | 0 | -100,00 | 0 |