Basisstatistiken
| Institutionelle Aktien (Long) | 46.849.197 - 12,08% (ex 13D/G) - change of -5,04MM shares -9,71% MRQ |
| Institutioneller Wert (Long) | $ 36.926 USD ($1000) |
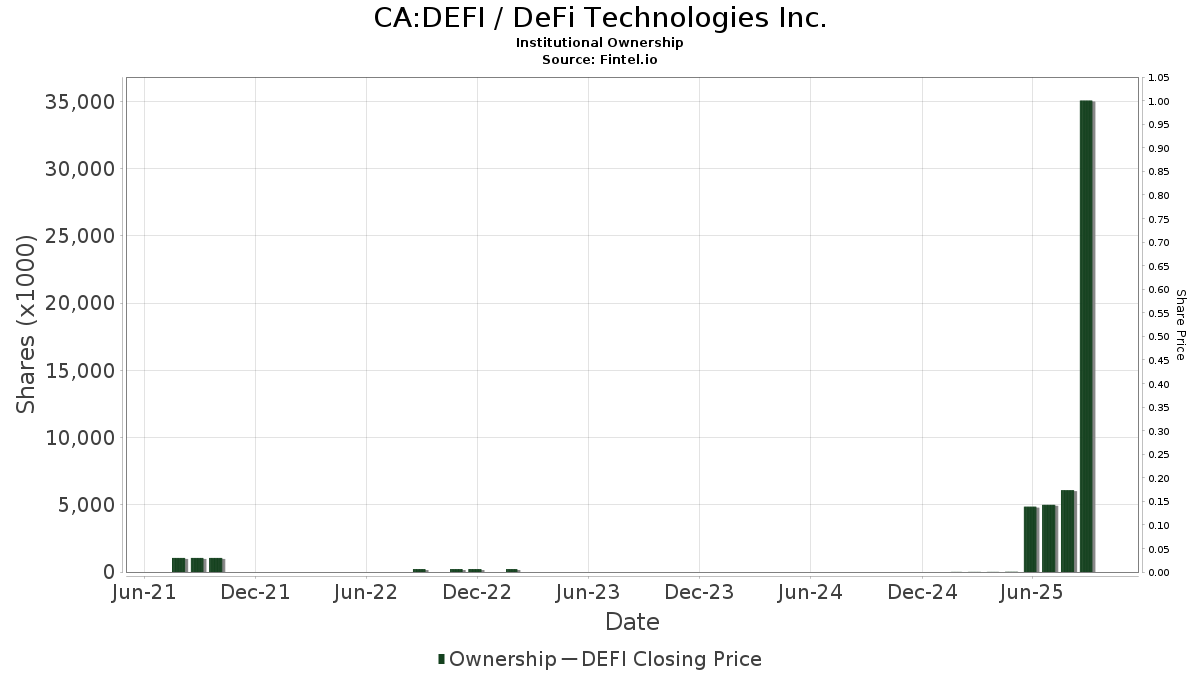
Institutioneller Eigentümerschaft und Aktionäre
DeFi Technologies Inc. (CA:DEFI) hat 114 institutionelle Eigentümer und Aktionäre, die 13D/G oder 13F Formulare bei der Securities Exchange Commission (SEC) eingereicht haben. Diese Institutionen halten insgesamt 46,849,197 Aktien. Die größten Aktionäre sind Weiss Asset Management LP, Charles Schwab Investment Management Inc, Millennium Management Llc, Galaxy Group Investments LLC, Susquehanna International Group, Llp, Bank Of Montreal /can/, Invesco Ltd., Jane Street Group, Llc, Citadel Advisors Llc, and Jane Street Group, Llc .
DeFi Technologies Inc. (NEOE:DEFI) Die institutionelle Eigentümerstruktur zeigt die aktuellen Positionen von Institutionen und Fonds im Unternehmen sowie die jüngsten Veränderungen der Positionsgröße. Zu den Großaktionären können Einzelanleger, Investmentfonds, Hedgefonds oder Institutionen gehören. Der Schedule 13D zeigt an, dass der Investor mehr als 5% des Unternehmens hält (oder gehalten hat) und beabsichtigt (oder beabsichtigt hat), aktiv eine Änderung der Geschäftsstrategie zu verfolgen. Schedule 13G zeigt eine passive Investition von über 5% an.
Fondsstimmung-Score
Der Fondsstimmung-Score (auch bekannt als Eigentümer-Akkumulations-Score) ermittelt die Aktien, die am meisten von Fonds gekauft werden. Er ist das Ergebnis eines ausgeklügelten quantitativen Multifaktormodells, das die Unternehmen mit den höchsten institutionellen Käufen identifiziert. Das Scoring-Modell verwendet eine Kombination aus der Gesamtzunahme der offengelegten Eigentümer, den Änderungen der Portfolioallokationen in diesen Eigentümern und anderen Metriken. Die Zahl reicht von 0 bis 100, wobei höhere Zahlen ein höheres Maß an Kapitalakkumulation als bei anderen Unternehmen anzeigen und 50 den Durchschnitt darstellt.
Aktualisierungshäufigkeit: Täglich
Siehe Ownership Explorer, der eine Liste der am höchsten bewerteten Unternehmen enthält.
AI+ Ask Fintel’s AI assistant about DeFi Technologies Inc..
Select a question to share a public post with an AI-crafted answer.
Thinking of good questions…
13F und NPORT Einreichungen
Details zu 13F-Einreichungen sind kostenlos. Für Details zu NP-Einreichungen ist eine Premium-Mitgliedschaft erforderlich. Grüne Zeilen zeigen neue Positionen an. Rote Zeilen zeigen geschlossene Positionen an. Klicken Sie auf das Link Symbol, um den gesamten Transaktionsverlauf zu sehen.
Upgrade
um Prämiendaten freizuschalten und nach Excel zu exportieren ![]() .
.
| Datei Datum | Quelle | Anleger | Typ | Durchschnittlicher Preis (Est) |
Aktien | Δ Aktien (%) |
Gemeldeter Wert ($1000) |
Δ Wert (%) |
Port Alloc (%) |
|
|---|---|---|---|---|---|---|---|---|---|---|
| 2026-01-29 | 13F | RMG Wealth Management LLC | 1.500 | 50,00 | 1 | -50,00 | ||||
| 2026-02-11 | 13F | Paragon Private Wealth Management, LLC | 34.100 | 0,00 | 26 | -64,79 | ||||
| 2026-01-13 | 13F | Stephens Consulting, LLC | 3.000 | 0,00 | 2 | -66,67 | ||||
| 2026-02-11 | 13F | Cedar Mountain Advisors, LLC | 1.500 | 0,00 | 1 | -66,67 | ||||
| 2026-04-09 | 13F | Everhart Financial Group, Inc. | 11.300 | 6 | ||||||
| 2026-04-17 | 13F | Ignite Planners, LLC | 14.815 | 0,00 | 8 | -20,00 | ||||
| 2026-02-13 | 13F | NewGen Asset Management Ltd | 0 | -100,00 | 0 | -100,00 | ||||
| 2026-02-13 | 13F | Arete Wealth Advisors, LLC | 26.012 | -23,52 | 0 | |||||
| 2026-02-17 | 13F | Caption Management, LLC | Call | 256.500 | 194 | |||||
| 2026-02-19 | 13F | Invesco Ltd. | 2.140.354 | 141,39 | 1.615 | -13,64 | ||||
| 2026-02-09 | 13F | Hartland & Co., LLC | 815 | 1 | ||||||
| 2026-02-12 | 13F | Steward Partners Investment Advisory, Llc | 13.175 | 0,00 | 10 | -66,67 | ||||
| 2026-02-23 | 13F | Walser Wealth Management Company, A Ltd Liability Co | 20.000 | 15 | ||||||
| 2026-02-13 | 13F | Charles Schwab Investment Management Inc | 7.329.284 | 416,13 | 5.531 | 84,58 | ||||
| 2026-02-02 | 13F | Oppenheimer & Co Inc | 0 | -100,00 | 0 | -100,00 | ||||
| 2026-02-13 | 13F | Wiregrass Investment Management Llc | 60.000 | 45 | ||||||
| 2026-02-12 | 13F | Nuveen, LLC | 243.727 | 0,00 | 184 | -64,20 | ||||
| 2026-02-17 | 13F | Cetera Investment Advisers | 15.775 | 12 | ||||||
| 2026-02-10 | 13F | Thompson Siegel & Walmsley Llc | 0 | -100,00 | 0 | -100,00 | ||||
| 2026-02-12 | 13F | Bank Of Montreal /can/ | 2.217.193 | -8,03 | 1.696 | -65,63 | ||||
| 2026-04-17 | 13F | Halbert Hargrove Global Advisors, Llc | 3.802 | 0,00 | 2 | 0,00 | ||||
| 2026-02-13 | 13F | Hudson Bay Capital Management LP | 0 | -100,00 | 0 | -100,00 | ||||
| 2026-02-12 | 13F | Intrinsic Edge Capital Management LLC | 0 | -100,00 | 0 | -100,00 | ||||
| 2025-11-14 | 13F | WNY Asset Management, LLC | 10.000 | 0,00 | 21 | -27,59 | ||||
| 2026-01-29 | 13F | Vanguard Group Inc | 297.366 | 9,50 | 227 | -59,17 | ||||
| 2026-02-05 | 13F | HighMark Wealth Management LLC | 12.000 | 0,00 | 9 | -64,00 | ||||
| 2026-02-13 | 13F | American Century Companies Inc | 401.336 | 923,48 | 307 | 283,75 | ||||
| 2026-02-09 | 13F | Cary Street Partners Financial Llc | 17.415 | 0,00 | 13 | -63,89 | ||||
| 2026-02-17 | 13F | Angeles Wealth Management, Llc | 20.000 | 15 | ||||||
| 2026-04-07 | 13F | Farther Finance Advisors, LLC | 23.059 | 506,82 | 16 | 650,00 | ||||
| 2026-01-21 | 13F | Flagship Harbor Advisors, Llc | 1.127 | 1 | ||||||
| 2026-04-15 | 13F | Apex Wealth Management, LLC | 23.896 | 132,77 | 13 | 18,18 | ||||
| 2026-02-17 | 13F | Toronto Dominion Bank | 66.459 | 196,81 | 51 | 11,11 | ||||
| 2026-02-17 | 13F | Bank Of America Corp /de/ | 2.000 | -95,16 | 2 | -98,85 | ||||
| 2026-02-17 | 13F | Balyasny Asset Management Llc | 0 | -100,00 | 0 | -100,00 | ||||
| 2026-01-20 | 13F | Ethos Financial Group, LLC | 264.420 | 0,00 | 200 | -64,27 | ||||
| 2026-02-10 | 13F | Ritter Daniher Financial Advisory LLC / DE | 350 | 0,00 | 0 | |||||
| 2026-04-10 | 13F | Novem Group | 14.560 | -0,68 | 8 | -27,27 | ||||
| 2026-02-17 | 13F | Public Employees Retirement System Of Ohio | 86.826 | 27,98 | 67 | -52,17 | ||||
| 2026-02-04 | 13F | Rollins Financial Advisors, LLC | 34.428 | 0,00 | 26 | -65,28 | ||||
| 2026-04-08 | 13F | First Heartland Consultants, Inc. | 18.181 | 0,00 | 10 | -23,08 | ||||
| 2026-02-12 | 13F | Swiss National Bank | 726.000 | 21,45 | 557 | -54,58 | ||||
| 2026-02-10 | 13F | Goldman Sachs Group Inc | 210.130 | 170,87 | 159 | -3,07 | ||||
| 2026-02-17 | 13F | Spears Abacus Advisors LLC | 65.000 | 0,00 | 49 | -64,23 | ||||
| 2026-02-26 | 13F/A | Aristides Capital LLC | 189.800 | 143 | ||||||
| 2026-01-29 | 13F | Pictet Asset Management Holding SA | 65.769 | 10,25 | 50 | -59,02 | ||||
| 2026-02-17 | 13F | Two Sigma Investments, Lp | 0 | -100,00 | 0 | -100,00 | ||||
| 2025-11-07 | 13F | Shell Asset Management Co | 4.664 | -71,63 | 0 | |||||
| 2026-01-21 | 13F | Finer Wealth Management, Inc. | 0 | -100,00 | 0 | -100,00 | ||||
| 2025-11-14 | 13F | Ubs Asset Management Americas Inc | 0 | -100,00 | 0 | -100,00 | ||||
| 2026-01-22 | 13F | Fiduciary Alliance LLC | 0 | -100,00 | 0 | -100,00 | ||||
| 2026-02-10 | 13F | State of Wyoming | 2.915 | -97,42 | 2 | -99,16 | ||||
| 2026-02-13 | 13F | Squarepoint Ops LLC | 25.606 | -46,05 | 19 | -81,00 | ||||
| 2025-10-31 | 13F | Y-Intercept (Hong Kong) Ltd | 0 | -100,00 | 0 | -100,00 | ||||
| 2025-11-13 | 13F | NewGen Equity Long/Short Fund | 1.369.864 | 2.616 | ||||||
| 2026-03-16 | 13F/A | Rockefeller Capital Management L.P. | 1.650 | 16,20 | 1 | -50,00 | ||||
| 2026-02-17 | 13F | Cable Car Capital LLC | 1.315.670 | -75,22 | 993 | -90,87 | ||||
| 2025-11-14 | 13F | Shay Capital LLC | 0 | -100,00 | 0 | -100,00 | ||||
| 2026-02-05 | 13F | Western Wealth Management, LLC | 163.190 | 23,45 | 123 | -55,76 | ||||
| 2026-02-12 | 13F | Scotia Capital Inc. | 0 | -100,00 | 0 | -100,00 | ||||
| 2026-02-17 | 13F | Brevan Howard Capital Management LP | 650.000 | -74,00 | 490 | -90,71 | ||||
| 2026-04-15 | 13F | Activest Wealth Management | 41.500 | 107,50 | 24 | 53,33 | ||||
| 2026-02-17 | 13F | State Of Wisconsin Investment Board | 10.836 | 8 | ||||||
| 2026-02-12 | 13F | Jane Street Group, Llc | Call | 1.388.000 | 141,22 | 1.047 | -13,76 | |||
| 2026-02-12 | 13F | Jane Street Group, Llc | 1.955.264 | 181,46 | 1.475 | 0,68 | ||||
| 2026-02-13 | 13F | Diametric Capital, LP | 0 | -100,00 | 0 | -100,00 | ||||
| 2026-04-10 | 13F | DKM Wealth Management, Inc. | 27.665 | 0,00 | 15 | -25,00 | ||||
| 2026-02-10 | 13F | CIBC Asset Management Inc | 47.624 | 36 | ||||||
| 2026-02-05 | 13F | BlueChip Wealth Advisors LLC | 40.000 | 30 | ||||||
| 2026-02-12 | 13F | Jane Street Group, Llc | Put | 32.700 | -44,10 | 25 | -80,49 | |||
| 2026-02-17 | 13F | National Asset Management, Inc. | 10.000 | 8 | ||||||
| 2026-02-10 | 13F | CIBC World Markets Inc. | 0 | -100,00 | 0 | -100,00 | ||||
| 2026-02-10 | 13F | Quantbot Technologies LP | 0 | -100,00 | 0 | -100,00 | ||||
| 2026-02-17 | 13F | Advisory Services Network, LLC | 0 | -100,00 | 0 | -100,00 | ||||
| 2026-02-17 | 13F | Millennium Management Llc | 5.836.397 | 103,56 | 4.404 | -26,35 | ||||
| 2025-11-10 | 13F | Pekin Hardy Strauss, Inc. | 0 | -100,00 | 0 | -100,00 | ||||
| 2026-02-10 | 13F | Close Asset Management Ltd | 0 | -100,00 | 0 | |||||
| 2026-02-12 | 13F | Marex Group plc | 336.200 | 572,40 | 254 | 140,95 | ||||
| 2026-02-05 | 13F | Baader Bank INC | 12.734 | -72,53 | 4 | -90,48 | ||||
| 2026-02-10 | 13F | 1492 Capital Management LLC | 0 | -100,00 | 0 | -100,00 | ||||
| 2026-02-13 | 13F | Walleye Capital LLC | 0 | -100,00 | 0 | -100,00 | ||||
| 2026-02-17 | 13F | Citadel Advisors Llc | Put | 105.800 | -61,93 | 80 | -86,52 | |||
| 2025-11-13 | 13F | Van Eck Associates Corp | 0 | -100,00 | 0 | -100,00 | ||||
| 2026-02-17 | 13F | Citadel Advisors Llc | 1.690.797 | -65,86 | 1.276 | -87,80 | ||||
| 2026-03-23 | 13F/A | Galaxy Group Investments LLC | 4.971.695 | -44,76 | 3.752 | -80,25 | ||||
| 2026-02-13 | 13F | Toroso Investments, LLC | 123.130 | 93 | ||||||
| 2026-02-17 | 13F | Citadel Advisors Llc | Call | 1.080.800 | 125,64 | 816 | -19,31 | |||
| 2026-02-13 | 13F | Marshall Wace, Llp | 0 | -100,00 | 0 | -100,00 | ||||
| 2025-11-14 | 13F | Lazard Asset Management Llc | 0 | -100,00 | 0 | |||||
| 2026-03-09 | 13F/A | CI Private Wealth, LLC | 0 | -100,00 | 0 | -100,00 | ||||
| 2026-02-12 | 13F | Commonwealth Equity Services, Llc | 37.270 | 79,65 | 28 | |||||
| 2025-11-14 | 13F | OMERS ADMINISTRATION Corp | 0 | -100,00 | 0 | -100,00 | ||||
| 2026-02-13 | 13F | Visionary Wealth Advisors | 112.600 | -7,64 | 85 | -67,32 | ||||
| 2025-11-14 | 13F | Concentric Capital Strategies, LP | 0 | -100,00 | 0 | -100,00 | ||||
| 2026-02-06 | 13F | Griffin Asset Management, Inc. | 48.500 | 37 | ||||||
| 2025-10-22 | 13F | Abundance Wealth Counselors | 0 | -100,00 | 0 | |||||
| 2025-11-14 | 13F | Wellington Management Group Llp | 0 | -100,00 | 0 | -100,00 | ||||
| 2026-02-09 | 13F | Legal & General Group Plc | 316.384 | 0,00 | 242 | -62,65 | ||||
| 2026-02-17 | 13F | Engineers Gate Manager LP | 141.647 | 107 | ||||||
| 2026-02-12 | 13F | Moneta Group Investment Advisors Llc | 62.595 | -49,96 | 47 | -82,13 | ||||
| 2026-02-13 | 13F | Golden State Wealth Management, LLC | 0 | -100,00 | 0 | -100,00 | ||||
| 2026-02-10 | 13F | Verus Capital Partners, Llc | 20.165 | 15 | ||||||
| 2026-02-13 | 13F | Cornerstone Financial Management LLC | 1.408 | 1 | ||||||
| 2026-02-12 | 13F | BlackRock, Inc. | 158.519 | 120 | ||||||
| 2026-01-26 | 13F | McGuire Investment Group, LLC | 0 | -100,00 | 0 | -100,00 | ||||
| 2026-02-13 | 13F | Wells Fargo & Company/mn | 2.519 | -88,56 | 2 | -97,83 | ||||
| 2026-02-04 | 13F | Swiss Life Asset Management Ltd | 16.100 | 36,44 | 12 | -50,00 | ||||
| 2026-02-17 | 13F | Weiss Asset Management LP | 7.991.969 | -12,49 | 6.031 | -68,71 | ||||
| 2026-02-17 | 13F | Susquehanna International Group, Llp | Put | 160.100 | -69,41 | 120 | -89,13 | |||
| 2026-02-17 | 13F | Susquehanna International Group, Llp | Call | 105.600 | -43,92 | 79 | -80,10 | |||
| 2026-02-17 | 13F | Royal Bank Of Canada | 42.900 | 54,50 | 33 | -44,07 | ||||
| 2026-01-06 | 13F | Penbrook Management LLC | 0 | -100,00 | 0 | -100,00 | ||||
| 2026-02-17 | 13F | Susquehanna International Group, Llp | 2.583.551 | 107,54 | 1.950 | -25,78 | ||||
| 2026-02-17 | 13F | Creative Planning | 17.539 | 13 | ||||||
| 2026-04-08 | 13F | Wealth Enhancement Advisory Services, Llc | 18.600 | -36,63 | 15 | -46,15 | ||||
| 2026-04-08 | 13F | Wealth Enhancement Advisory Services, Llc | Call | 14.000 | 0 | |||||
| 2026-02-13 | 13F | Integrated Wealth Concepts LLC | 22.259 | 17 | ||||||
| 2026-02-11 | 13F | LPL Financial LLC | 184.641 | -27,36 | 139 | -74,07 | ||||
| 2026-02-05 | 13F | Allworth Financial LP | 25.000 | 66,67 | 19 | -41,94 | ||||
| 2025-11-04 | 13F | Independent Advisor Alliance | 0 | -100,00 | 0 | -100,00 | ||||
| 2026-04-16 | 13F | SG Americas Securities, LLC | 45.818 | 0 | ||||||
| 2026-02-11 | 13F | Jpmorgan Chase & Co | 0 | -100,00 | 0 | -100,00 | ||||
| 2026-02-17 | 13F | Parallax Volatility Advisers, L.P. | Call | 256.500 | 194 | |||||
| 2026-02-17 | 13F | DZ BANK AG Deutsche Zentral Genossenschafts Bank, Frankfurt am Main | 355.480 | 2,19 | 268 | -62,36 | ||||
| 2026-02-17 | 13F | Prelude Capital Management, Llc | 0 | -100,00 | 0 | -100,00 | ||||
| 2026-02-17 | 13F | Mercer Global Advisors Inc /adv | 14.449 | 11 | ||||||
| 2026-02-18 | 13F | GWM Advisors LLC | 2.719 | -51,11 | 2 | -81,82 | ||||
| 2026-01-12 | 13F | VisionPoint Advisory Group, LLC | 14.000 | 11 | ||||||
| 2026-02-17 | 13F | Wiley Bros.-aintree Capital, Llc | 11.350 | 0,00 | 9 | -65,22 | ||||
| 2026-02-17 | 13F | Integrated Advisors Network LLC | 0 | -100,00 | 0 | -100,00 | ||||
| 2026-02-06 | 13F/A | Rathbone Brothers plc | 0 | -100,00 | 0 | -100,00 | ||||
| 2026-02-13 | 13F | JustInvest LLC | 18.720 | 14 | ||||||
| 2026-01-26 | 13F | Cwm, Llc | 240 | 0 | ||||||
| 2026-02-09 | 13F | Harbour Investments, Inc. | 3.850 | 8,45 | 3 | -71,43 | ||||
| 2026-04-13 | 13F | Salem Investment Counselors Inc | 500 | 0 | ||||||
| 2026-01-29 | 13F | UBS Group AG | 175.947 | 93,94 | 133 | -30,89 | ||||
| 2026-02-12 | 13F | StoneX Group Inc. | 115.925 | -17,15 | 87 | -70,51 | ||||
| 2026-02-17 | 13F | Perennial Investment Advisors, LLC | 10.000 | 0,00 | 8 | -66,67 | ||||
| 2026-02-17 | 13F | Jones Financial Companies Lllp | 1.010 | -93,27 | 1 | -100,00 | ||||
| 2026-04-17 | 13F | Vermillion Wealth Management, Inc. | 1.430 | 0,00 | 1 | -100,00 | ||||
| 2026-01-16 | 13F | FNY Investment Advisers, LLC | 0 | -100,00 | 0 | |||||
| 2026-02-26 | 13F | TD Capital Management LLC | 151 | 0,00 | 0 | |||||
| 2026-02-13 | 13F | Caitong International Asset Management Co., Ltd | 0 | -100,00 | 0 | -100,00 | ||||
| 2026-01-27 | 13F | Zurcher Kantonalbank (Zurich Cantonalbank) | 112.352 | 0,00 | 86 | -62,61 | ||||
| 2026-01-30 | 13F | Delta Investment Management, LLC | 29.414 | 22 | ||||||
| 2026-02-17 | 13F | Polar Asset Management Partners Inc. | 0 | -100,00 | 0 | -100,00 | ||||
| 2026-02-13 | 13F | National Bank Of Canada /fi/ | 0 | -100,00 | 0 | -100,00 | ||||
| 2026-02-19 | 13F | Connective Capital Management, LLC | 182.816 | 138 | ||||||
| 2025-11-14 | 13F | Wolverine Trading, Llc | Put | 61.600 | 130 | |||||
| 2026-02-12 | 13F | Federation des caisses Desjardins du Quebec | 5.053 | 383,08 | 4 | 50,00 | ||||
| 2026-04-20 | 13F | City State Bank | 23.000 | 0,00 | 13 | -29,41 | ||||
| 2026-04-20 | 13F | Kestra Private Wealth Services, Llc | 14.000 | 0,00 | 8 | -30,00 | ||||
| 2026-02-13 | 13F | MAI Capital Management | 200 | 0 | ||||||
| 2025-11-14 | 13F | Wolverine Trading, Llc | 58.909 | 124 | ||||||
| 2025-11-14 | 13F | Wolverine Trading, Llc | Call | 56.600 | 119 | |||||
| 2025-11-13 | 13F | Quadrature Capital Ltd | 0 | -100,00 | 0 | -100,00 | ||||
| 2026-01-21 | 13F | Guild Investment Management, Inc. | 0 | -100,00 | 0 | -100,00 | ||||
| 2026-02-13 | 13F | Morgan Stanley | 73.578 | 10,43 | 56 | -60,71 | ||||
| 2025-11-14 | 13F | potrero capital research llc | 0 | -100,00 | 0 | -100,00 | ||||
| 2026-02-11 | 13F | Invst, LLC | 11.100 | 8 | ||||||
| 2026-02-13 | 13F | Rafferty Asset Management, LLC | 15.876 | 39,10 | 12 | -54,17 | ||||
| 2026-02-09 | 13F | Geode Capital Management, Llc | 286.781 | -24,29 | 217 | -72,55 | ||||
| 2026-02-11 | 13F | Tradition Wealth Management, LLC | 0 | -100,00 | 0 | -100,00 | ||||
| 2026-02-13 | 13F | Citigroup Inc | 12.016 | -48,68 | 9 | -80,85 | ||||
| 2026-02-10 | 13F | Foundations Investment Advisors, LLC | 24.419 | 18 | ||||||
| 2026-02-13 | 13F | Barclays Plc | 0 | -100,00 | 0 | -100,00 | ||||
| 2026-01-12 | 13F | Roble, Belko & Company, Inc | 0 | -100,00 | 0 | |||||
| 2026-02-06 | 13F | Harvest Portfolios Group Inc. | 66.303 | -13,07 | 51 | -67,95 | ||||
| 2026-02-09 | 13F | Wellington Shields Capital Management, LLC | 0 | -100,00 | 0 | -100,00 | ||||
| 2026-02-17 | 13F | Advisor Group Holdings, Inc. | 2.200 | 340,00 | 2 | 0,00 | ||||
| 2026-02-17 | 13F | Captrust Financial Advisors | 31.550 | -24,40 | 24 | -73,86 | ||||
| 2025-11-14 | 13F | Graham Capital Management, L.P. | 0 | -100,00 | 0 | -100,00 |