Basisstatistiken
| Institutionelle Aktien (Long) | 252.028.419 - 72,18% (ex 13D/G) - change of -34,69MM shares -12,10% MRQ |
| Institutioneller Wert (Long) | $ 10.321.380 USD ($1000) |
Institutioneller Eigentümerschaft und Aktionäre
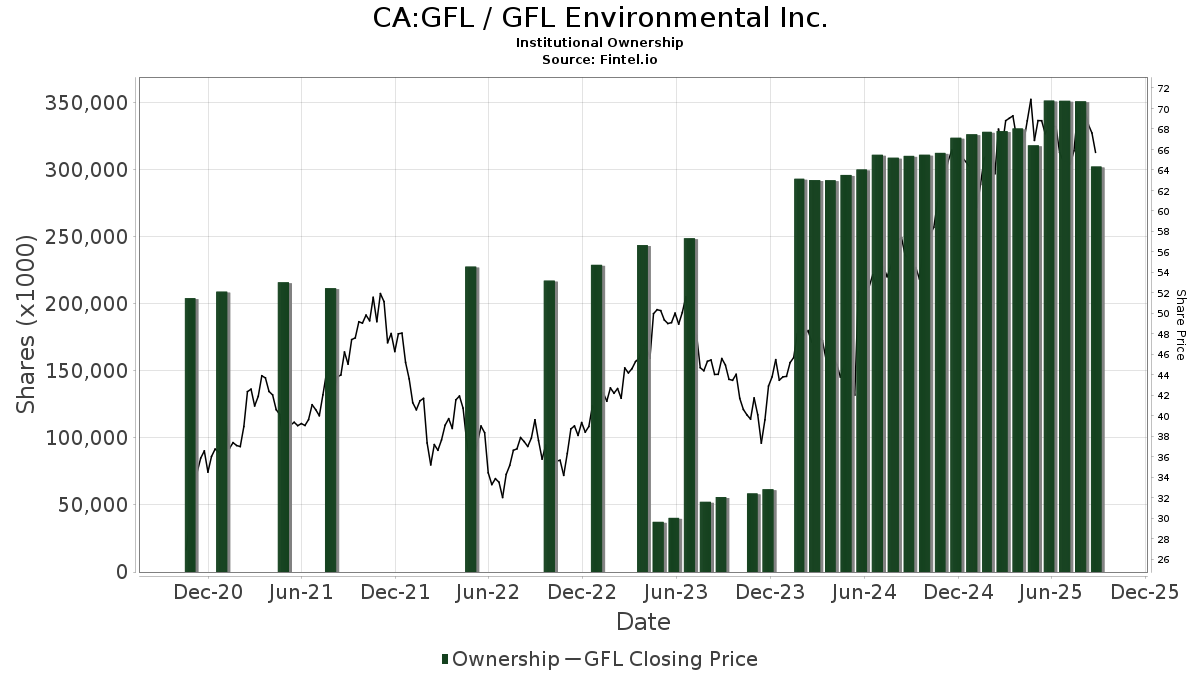
GFL Environmental Inc. (CA:GFL) hat 324 institutionelle Eigentümer und Aktionäre, die 13D/G oder 13F Formulare bei der Securities Exchange Commission (SEC) eingereicht haben. Diese Institutionen halten insgesamt 252,028,419 Aktien. Die größten Aktionäre sind BC Partners PE LP, Fmr Llc, Ontario Teachers Pension Plan Board, Capital Research Global Investors, Massachusetts Financial Services Co /ma/, Vanguard Group Inc, Royal Bank Of Canada, Pictet Asset Management Holding SA, Beutel, Goodman & Co Ltd., and Nordea Investment Management Ab .
GFL Environmental Inc. (TSX:GFL) Die institutionelle Eigentümerstruktur zeigt die aktuellen Positionen von Institutionen und Fonds im Unternehmen sowie die jüngsten Veränderungen der Positionsgröße. Zu den Großaktionären können Einzelanleger, Investmentfonds, Hedgefonds oder Institutionen gehören. Der Schedule 13D zeigt an, dass der Investor mehr als 5% des Unternehmens hält (oder gehalten hat) und beabsichtigt (oder beabsichtigt hat), aktiv eine Änderung der Geschäftsstrategie zu verfolgen. Schedule 13G zeigt eine passive Investition von über 5% an.
The share price as of April 17, 2026 is 53,28 / share. Previously, on April 21, 2025, the share price was 65,08 / share. This represents a decline of 18,13% over that period.
Fondsstimmung-Score
Der Fondsstimmung-Score (auch bekannt als Eigentümer-Akkumulations-Score) ermittelt die Aktien, die am meisten von Fonds gekauft werden. Er ist das Ergebnis eines ausgeklügelten quantitativen Multifaktormodells, das die Unternehmen mit den höchsten institutionellen Käufen identifiziert. Das Scoring-Modell verwendet eine Kombination aus der Gesamtzunahme der offengelegten Eigentümer, den Änderungen der Portfolioallokationen in diesen Eigentümern und anderen Metriken. Die Zahl reicht von 0 bis 100, wobei höhere Zahlen ein höheres Maß an Kapitalakkumulation als bei anderen Unternehmen anzeigen und 50 den Durchschnitt darstellt.
Aktualisierungshäufigkeit: Täglich
Siehe Ownership Explorer, der eine Liste der am höchsten bewerteten Unternehmen enthält.
AI+ Ask Fintel’s AI assistant about GFL Environmental Inc..
Select a question to share a public post with an AI-crafted answer.
Thinking of good questions…
13F und NPORT Einreichungen
Details zu 13F-Einreichungen sind kostenlos. Für Details zu NP-Einreichungen ist eine Premium-Mitgliedschaft erforderlich. Grüne Zeilen zeigen neue Positionen an. Rote Zeilen zeigen geschlossene Positionen an. Klicken Sie auf das Link Symbol, um den gesamten Transaktionsverlauf zu sehen.
Upgrade
um Prämiendaten freizuschalten und nach Excel zu exportieren ![]() .
.
| Datei Datum | Quelle | Anleger | Typ | Durchschnittlicher Preis (Est) |
Aktien | Δ Aktien (%) |
Gemeldeter Wert ($1000) |
Δ Wert (%) |
Port Alloc (%) |
|
|---|---|---|---|---|---|---|---|---|---|---|
| 2026-02-17 | 13F | Amundi | 299.988 | 26,63 | 12.884 | 18,08 | ||||
| 2026-02-13 | 13F | Soros Fund Management Llc | 732.620 | -16,27 | 31.466 | -24,10 | ||||
| 2025-11-05 | 13F | Hantz Financial Services, Inc. | 0 | -100,00 | 0 | |||||
| 2026-02-17 | 13F | Jones Financial Companies Lllp | 1.254 | -21,92 | 54 | -28,38 | ||||
| 2026-02-13 | 13F | Level Four Advisory Services, Llc | 12.796 | -13,81 | 550 | -21,91 | ||||
| 2026-02-02 | 13F | Kornitzer Capital Management Inc /ks | 350.000 | 0,00 | 15.032 | -9,35 | ||||
| 2025-10-29 | 13F | Triasima Portfolio Management inc. | 0 | -100,00 | 0 | -100,00 | ||||
| 2026-02-12 | 13F | Northwest & Ethical Investments L.P. | 25.332 | 48,73 | 1.088 | 34,82 | ||||
| 2025-11-12 | 13F | Transce3nd, LLC | 0 | -100,00 | 0 | -100,00 | ||||
| 2026-02-17 | 13F | Tcw Group Inc | 8.565 | 368 | ||||||
| 2026-02-13 | 13F | Brasada Capital Management, Lp | 66.749 | -14,94 | 2.862 | -22,00 | ||||
| 2026-02-13 | 13F | Morgan Stanley | 2.731.961 | -30,53 | 117.338 | -37,03 | ||||
| 2026-01-26 | 13F | Asset Dedication, LLC | 126 | 0,00 | 5 | 0,00 | ||||
| 2026-02-17 | 13F | DZ BANK AG Deutsche Zentral Genossenschafts Bank, Frankfurt am Main | 1.269.504 | 14,18 | 54.525 | 3,48 | ||||
| 2026-02-13 | 13F | Barclays Plc | 209.906 | -57,57 | 9.015 | -61,54 | ||||
| 2026-02-10 | 13F | Norges Bank | 3.479.778 | 149.466 | ||||||
| 2026-02-17 | 13F | Magnetar Financial LLC | 18.276 | -77,01 | 785 | -79,18 | ||||
| 2026-02-17 | 13F | Advisory Services Network, LLC | 0 | -100,00 | 0 | |||||
| 2026-02-17 | 13F | D. E. Shaw & Co., Inc. | 223.246 | 120,92 | 9.589 | 100,31 | ||||
| 2026-02-12 | 13F | BlackRock, Inc. | 2.238.728 | 4,23 | 96.153 | -5,52 | ||||
| 2026-02-13 | 13F | Barclays Plc | Call | 0 | -100,00 | 0 | -100,00 | |||
| 2026-01-30 | 13F | Bogart Wealth, LLC | 19 | 0,00 | 1 | |||||
| 2026-02-13 | 13F | Citigroup Inc | 51.679 | -55,00 | 2.223 | -59,18 | ||||
| 2026-02-09 | 13F | CBIZ Investment Advisory Services, LLC | 135 | 0,00 | 6 | -16,67 | ||||
| 2026-02-12 | 13F | Aviva Plc | 145.427 | 5,69 | 6.252 | -4,05 | ||||
| 2025-11-13 | 13F | Hudson Bay Capital Management LP | 0 | -100,00 | 0 | |||||
| 2026-02-12 | 13F | Skandinaviska Enskilda Banken AB (publ) | 32.582 | -4,44 | 1.399 | -13,37 | ||||
| 2026-02-13 | 13F | Aviso Financial Inc. | 0 | -100,00 | 0 | |||||
| 2025-11-14 | 13F | Walleye Trading LLC | Put | 0 | -100,00 | 0 | -100,00 | |||
| 2026-02-17 | 13F | Progeny 3, Inc. | 2.042.010 | 4,52 | 87.704 | -5,25 | ||||
| 2026-02-10 | 13F | FDx Advisors, Inc. | 0 | -100,00 | 0 | |||||
| 2025-11-14 | 13F | Credit Agricole S A | 0 | -100,00 | 0 | -100,00 | ||||
| 2026-02-11 | 13F | Simplex Trading, Llc | Put | 1.100 | -98,07 | 47 | 2.250,00 | |||
| 2026-02-11 | 13F | Simplex Trading, Llc | 309 | 13 | ||||||
| 2025-10-24 | 13F | Tema Etfs Llc | 0 | -100,00 | 0 | |||||
| 2026-02-11 | 13F | Simplex Trading, Llc | Call | 1.500 | -91,02 | 64 | ||||
| 2026-02-13 | 13F | Ossiam | 15.637 | -45,10 | 673 | -50,22 | ||||
| 2026-02-11 | 13F | Winton Capital Group Ltd | 236.167 | 483,13 | 10.143 | 428,83 | ||||
| 2026-02-17 | 13F | SIG North Trading, ULC | Call | 14.500 | -20,77 | 623 | -28,26 | |||
| 2026-01-14 | 13F | Generate Investment Management Ltd | 0 | -100,00 | 0 | |||||
| 2026-02-17 | 13F | SIG North Trading, ULC | 21.767 | 12,92 | 935 | 2,30 | ||||
| 2026-02-17 | 13F | SIG North Trading, ULC | Put | 11.700 | -40,00 | 503 | -45,61 | |||
| 2026-02-17 | 13F | State Of Wisconsin Investment Board | 143.146 | 6.157 | ||||||
| 2026-02-17 | 13F/A | BluePath Capital Management, LLC | 0 | -100,00 | 0 | |||||
| 2026-02-19 | 13F | Invesco Ltd. | 88.341 | -20,40 | 3.794 | -27,84 | ||||
| 2026-02-17 | 13F | DV Trading LLC | 600 | 26 | ||||||
| 2026-02-17 | 13F | Toronto Dominion Bank | 228.596 | -19,36 | 9.821 | -26,80 | ||||
| 2026-01-26 | 13F | Duff & Phelps Investment Management Co | 323.747 | 25,86 | 13.905 | 14,09 | ||||
| 2026-02-11 | 13F | Janney Montgomery Scott LLC | 14.272 | -16,93 | 1 | |||||
| 2026-02-13 | 13F | JustInvest LLC | 12.248 | 12,54 | 526 | 2,14 | ||||
| 2026-02-13 | 13F | Centaurus Financial, Inc. | 182.655 | 0,40 | 8 | -12,50 | ||||
| 2026-02-13 | 13F | Centerpoint Advisors, LLC | 434 | 0,00 | 0 | |||||
| 2026-02-09 | 13F | Geode Capital Management, Llc | 2.224.997 | 6,64 | 95.178 | -3,14 | ||||
| 2026-02-17 | 13F | Tower Research Capital LLC (TRC) | 281 | -78,22 | 12 | -80,33 | ||||
| 2026-02-12 | 13F | Loomis Sayles & Co L P | 200.410 | 4,81 | 8.608 | -4,99 | ||||
| 2026-01-29 | 13F | Copeland Capital Management, LLC | 602.493 | -5,40 | 25.877 | -14,25 | ||||
| 2026-02-11 | 13F | Group One Trading, L.p. | Put | 0 | -100,00 | 0 | -100,00 | |||
| 2026-02-13 | 13F | Quarry LP | 286 | -33,18 | 12 | -40,00 | ||||
| 2026-01-29 | 13F | Vanguard Group Inc | 11.156.675 | 0,88 | 479.255 | -8,57 | ||||
| 2026-02-12 | 13F | Great Valley Advisor Group, Inc. | 8.839 | 28,77 | 380 | 16,92 | ||||
| 2026-01-26 | 13F | Private Trust Co Na | 407 | 20,06 | 17 | 6,25 | ||||
| 2026-02-17 | 13F | Engineers Gate Manager LP | 62.547 | 109,20 | 2.686 | 89,69 | ||||
| 2026-02-13 | 13F | Great West Life Assurance Co /can/ | 101.736 | -3,40 | 4 | 0,00 | ||||
| 2026-02-06 | 13F | Global Retirement Partners, LLC | 13.205 | 26.310,00 | 567 | 28.250,00 | ||||
| 2026-02-13 | 13F | Parkside Financial Bank & Trust | 29 | 0,00 | 1 | 0,00 | ||||
| 2026-02-13 | 13F | American Century Companies Inc | 998.064 | -83,43 | 42.867 | -84,98 | ||||
| 2026-02-17 | 13F | Raymond James Financial Inc | 196.607 | -11,82 | 8.444 | -20,06 | ||||
| 2026-02-06 | 13F | Leonteq Securities AG | 6.971 | -3,97 | 396 | -13,94 | ||||
| 2026-02-13 | 13F | FORA Capital, LLC | 25.972 | 1.101 | ||||||
| 2026-02-10 | 13F | CIBC World Markets Inc. | 297.493 | 3,56 | 12.780 | -6,11 | ||||
| 2026-02-10 | 13F | CIBC Asset Management Inc | 5.101.264 | 25,83 | 219.360 | 14,25 | ||||
| 2026-02-17 | 13F | Twinbeech Capital Lp | 25.121 | 183,63 | 1.079 | 157,28 | ||||
| 2026-04-06 | 13F | Versant Capital Management, Inc | 725 | 84,01 | 30 | 87,50 | ||||
| 2026-02-12 | 13F | Rossby Financial, LCC | 0 | -100,00 | 0 | |||||
| 2025-10-24 | 13F | ORG Partners LLC | 0 | -100,00 | 0 | |||||
| 2026-02-13 | 13F | Blueshift Asset Management, LLC | 5.032 | 216 | ||||||
| 2026-02-12 | 13F | Commonwealth Equity Services, Llc | 5.150 | 221 | ||||||
| 2026-02-17 | 13F | Aristeia Capital Llc | 13.880 | 82,51 | 596 | 65,56 | ||||
| 2026-02-13 | 13F | Resources Investment Advisors, LLC. | 16.769 | -0,53 | 720 | -9,77 | ||||
| 2026-02-17 | 13F | Two Sigma Securities, Llc | 4.932 | 212 | ||||||
| 2026-02-13 | 13F | Entropy Technologies, LP | 39.204 | 289,31 | 1.684 | 252,83 | ||||
| 2026-02-10 | 13F | Bank of New York Mellon Corp | 211.174 | -1,94 | 9.070 | -11,11 | ||||
| 2026-02-13 | 13F | Marshall Wace, Llp | 1.170.208 | 50.260 | ||||||
| 2026-02-13 | 13F | USS Investment Management Ltd | 53.603 | 0,00 | 2.324 | -8,36 | ||||
| 2026-02-09 | 13F | MQS Management LLC | 7.181 | 308 | ||||||
| 2026-02-13 | 13F | Bank Of Nova Scotia | 350.783 | -1,96 | 15.068 | -11,10 | ||||
| 2026-04-15 | 13F | Merit Financial Group, LLC | 35.305 | 0,10 | 1.473 | -2,77 | ||||
| 2026-02-09 | 13F | MTM Investment Management, LLC | 30 | 0,00 | 1 | 0,00 | ||||
| 2026-02-04 | 13F | Swiss Life Asset Management Ltd | 16.943 | -0,43 | 728 | -9,91 | ||||
| 2026-01-22 | 13F | Addenda Capital Inc. | 0 | -100,00 | 0 | |||||
| 2026-02-17 | 13F | Prana Capital Management, LP | 34.995 | -32,03 | 1.503 | -38,38 | ||||
| 2026-01-20 | 13F | Cromwell Holdings LLC | 1.452 | 0,00 | 62 | -8,82 | ||||
| 2026-04-07 | 13F | Farther Finance Advisors, LLC | 943 | 253,18 | 41 | 272,73 | ||||
| 2026-02-05 | 13F | S&co Inc | 175.599 | -0,00 | 8 | -12,50 | ||||
| 2026-02-11 | 13F | Capital Research Global Investors | 21.863.632 | 17,57 | 939.043 | 6,58 | ||||
| 2025-11-03 | 13F | Agp Franklin, Llc | 0 | -100,00 | 0 | -100,00 | ||||
| 2026-01-27 | 13F | First Horizon Corp | 1.546 | -36,79 | 66 | -42,61 | ||||
| 2026-02-17 | 13F | Jump Financial, LLC | 240.901 | 151,23 | 10.347 | 127,73 | ||||
| 2026-01-30 | 13F | Jennison Associates Llc | 243.220 | -65,77 | 10.446 | -68,97 | ||||
| 2026-02-13 | 13F | Clarkston Capital Partners, LLC | 2.805.035 | -1,92 | 120.476 | -11,09 | ||||
| 2026-02-04 | 13F | C WorldWide Group Holding A/S | 29.615 | 0,00 | 1 | 0,00 | ||||
| 2026-02-17 | 13F | Cetera Investment Advisers | 18.806 | -6,34 | 808 | -15,14 | ||||
| 2026-02-13 | 13F | State Street Corp | 6.400 | 0,00 | 275 | -9,57 | ||||
| 2026-02-10 | 13F | Gulf International Bank (UK) Ltd | 12.374 | 0,00 | 1 | |||||
| 2026-02-02 | 13F | Oppenheimer Asset Management Inc. | 29.513 | -0,76 | 1.268 | -10,01 | ||||
| 2026-04-17 | 13F | Brown, Lisle/cummings, Inc. | 25 | 1 | ||||||
| 2026-01-20 | 13F | Cigna Investments Inc /new | 0 | -100,00 | 0 | |||||
| 2026-02-04 | 13F | Schwartz Investment Counsel Inc | 196.093 | 4,67 | 8.422 | -5,11 | ||||
| 2026-02-17 | 13F | Advent International Corp/ma | 379.092 | 3,86 | 16.282 | -5,85 | ||||
| 2026-02-17 | 13F | Concentric Capital Strategies, LP | 248.976 | 101,89 | 10.694 | 83,04 | ||||
| 2026-04-16 | 13F | Monarch Capital Management Inc/ | 5.895 | 246 | ||||||
| 2026-02-13 | 13F | Mariner, LLC | 6.988 | -10,40 | 300 | -18,70 | ||||
| 2026-02-13 | 13F | Aigen Investment Management, Lp | 21.248 | 972 | ||||||
| 2026-01-23 | 13F | Assetmark, Inc | 67 | 0,00 | 3 | -33,33 | ||||
| 2026-02-12 | 13F | Brown Brothers Harriman & Co | 1.804.927 | -3,54 | 77.522 | -12,56 | ||||
| 2026-02-13 | 13F | Squarepoint Ops LLC | 24.517 | 5,59 | 1.053 | -4,27 | ||||
| 2025-11-14 | 13F | Nbc Securities, Inc. | 0 | -100,00 | 0 | |||||
| 2026-04-17 | 13F | Bell Investment Advisors, Inc | 34 | -38,18 | 1 | -50,00 | ||||
| 2026-02-17 | 13F | Capstone Investment Advisors, Llc | 0 | -100,00 | 0 | -100,00 | ||||
| 2026-02-17 | 13F | Bank Of America Corp /de/ | 1.284.165 | 31,72 | 55.155 | 19,40 | ||||
| 2026-02-12 | 13F | Jane Street Group, Llc | Put | 0 | -100,00 | 0 | -100,00 | |||
| 2026-02-10 | 13F | Quantbot Technologies LP | 76.558 | 3.288 | ||||||
| 2026-02-05 | 13F/A | Fulcrum Asset Management LLP | 15.070 | 0,00 | 659 | -7,84 | ||||
| 2026-02-17 | 13F | LMR Partners LLP | 0 | -100,00 | 0 | |||||
| 2025-11-13 | 13F | Bridgewater Associates, LP | 0 | -100,00 | 0 | -100,00 | ||||
| 2026-02-12 | 13F | UniSuper Management Pty Ltd | 117.967 | 0,00 | 6.955 | -10,62 | ||||
| 2026-02-02 | 13F | Fifth Third Bancorp | 464 | -38,46 | 20 | -45,71 | ||||
| 2026-02-17 | 13F | Royal Bank Of Canada | Put | 230.000 | 9.879 | |||||
| 2026-02-13 | 13F | Beutel, Goodman & Co Ltd. | 7.172.103 | 31,45 | 308 | 19,38 | ||||
| 2026-02-17 | 13F | Royal Bank Of Canada | 9.314.727 | 18,81 | 400.067 | 7,70 | ||||
| 2026-02-09 | 13F | Key FInancial Inc | 3.043 | 0,00 | 131 | -7,80 | ||||
| 2026-01-29 | 13F | Pictet Asset Management Holding SA | 8.511.198 | 2,22 | 365.595 | -7,32 | ||||
| 2026-01-15 | 13F | J. Safra Sarasin Holding AG | 148.491 | -5,82 | 6.378 | -14,63 | ||||
| 2026-02-05 | 13F | IMG Wealth Management, Inc. | 160 | 0,00 | 7 | -14,29 | ||||
| 2026-02-12 | 13F | Hrt Financial Lp | 0 | -100,00 | 0 | |||||
| 2026-02-02 | 13F | Danske Bank A/s | 1.744 | 0,00 | 75 | -7,41 | ||||
| 2026-02-11 | 13F | Jpmorgan Chase & Co | 987.474 | -26,56 | 42.412 | -33,42 | ||||
| 2026-02-17 | 13F | Tudor Investment Corp Et Al | 93.737 | 4.026 | ||||||
| 2026-02-12 | 13F | Renaissance Technologies Llc | 131.161 | 5.633 | ||||||
| 2026-02-10 | 13F | Envestnet Asset Management Inc | 124.224 | -6,83 | 5.335 | -15,55 | ||||
| 2026-02-12 | 13F | Lansforsakringar Fondforvaltning AB (publ) | 54.441 | 36,57 | 2.342 | 23,93 | ||||
| 2025-11-13 | 13F | Kayne Anderson Rudnick Investment Management Llc | 0 | -100,00 | 0 | -100,00 | ||||
| 2026-02-13 | 13F | Sei Investments Co | 440.196 | -4,82 | 18.907 | -13,72 | ||||
| 2026-02-11 | 13F | Primecap Management Co/ca/ | 667.800 | 0,00 | 28.682 | -9,35 | ||||
| 2026-02-13 | 13F | Wells Fargo & Company/mn | 32.488 | -49,50 | 1.396 | -54,18 | ||||
| 2026-02-17 | 13F | Freestone Grove Partners LP | 446.741 | 31,05 | 19.188 | 18,80 | ||||
| 2026-02-10 | 13F | Forsta Ap-fonden | 41.200 | -7,21 | 1.772 | -15,78 | ||||
| 2026-02-17 | 13F | Trexquant Investment LP | 154.698 | 624,68 | 6.644 | 557,17 | ||||
| 2026-02-17 | 13F | BC Partners PE LP | 29.912.724 | -15,35 | 1.153.591 | -19,04 | ||||
| 2026-02-03 | 13F | Grimes & Company, Inc. | 5.032 | 0,22 | 216 | -8,86 | ||||
| 2026-02-17 | 13F | Worldquant Millennium Advisors Llc | 6.346 | -59,14 | 273 | -63,04 | ||||
| 2026-02-11 | 13F | Vestcor Inc | 391.815 | 25,66 | 17 | 14,29 | ||||
| 2025-11-12 | 13F | CIBC Bancorp USA Inc. | 250.283 | 11.858 | ||||||
| 2026-01-30 | 13F | Us Bancorp \de\ | 3.424 | -4,04 | 147 | -13,02 | ||||
| 2026-02-06 | 13F | TimesSquare Capital Management, LLC | 1.125.123 | 3,42 | 48.324 | -6,25 | ||||
| 2026-02-17 | 13F | Aqr Capital Management Llc | 1.181.049 | 11.121,37 | 50.735 | 10.087,55 | ||||
| 2026-02-13 | 13F | Toroso Investments, LLC | 18.722 | -19,67 | 804 | -27,17 | ||||
| 2026-02-05 | 13F | Cambridge Investment Research Advisors, Inc. | 7.147 | -25,33 | 0 | |||||
| 2026-02-17 | 13F | Fred Alger Management, Llc | 5.023.016 | -10,76 | 215.739 | -19,11 | ||||
| 2026-02-09 | 13F | Jefferies Financial Group Inc. | 1.031.408 | 44.299 | ||||||
| 2026-02-17 | 13F | Point72 Asset Management, L.P. | 1.554.611 | 19,92 | 66.772 | 8,70 | ||||
| 2026-02-13 | 13F | Maverick Capital Ltd | 5.023.417 | 216,54 | 215.761 | 186,95 | ||||
| 2026-03-20 | 13F | Purpose Unlimited Inc. | 179 | 8 | ||||||
| 2026-02-17 | 13F | Graham Capital Management, L.P. | 5.282 | 227 | ||||||
| 2025-11-14 | 13F | Mount Yale Investment Advisors, LLC | 0 | -100,00 | 0 | -100,00 | ||||
| 2026-02-17 | 13F | Burkehill Global Management, LP | 0 | -100,00 | 0 | |||||
| 2026-02-12 | 13F | Jane Street Group, Llc | 3.407.588 | 1.049,79 | 146.356 | 942,34 | ||||
| 2026-02-13 | 13F | OMERS ADMINISTRATION Corp | 0 | -100,00 | 0 | |||||
| 2026-02-12 | 13F | Jane Street Group, Llc | Call | 6.500 | -62,43 | 279 | -65,93 | |||
| 2026-02-17 | 13F | Citadel Advisors Llc | Put | 0 | -100,00 | 0 | ||||
| 2026-02-17 | 13F | Northern Trust Corp | 536.914 | -8,47 | 23.060 | -17,02 | ||||
| 2026-02-13 | 13F | Neuberger Berman Group LLC | 539.552 | -8,86 | 23.175 | -17,38 | ||||
| 2026-02-12 | 13F | Quadrant Capital Group Llc | 458 | -18,51 | 20 | -26,92 | ||||
| 2026-02-17 | 13F | Clear Street Markets Llc | 1.683 | 72 | ||||||
| 2026-02-12 | 13F | Boussard & Gavaudan Investment Management LLP | 32.839 | 12,32 | 1.435 | 4,21 | ||||
| 2026-02-11 | 13F | Fiera Capital Corp | 31.753 | 1.364 | ||||||
| 2025-11-14 | 13F | Axa S.a. | 0 | -100,00 | 0 | |||||
| 2025-10-28 | 13F | BCS Private Wealth Management, Inc. | 0 | -100,00 | 0 | |||||
| 2026-02-10 | 13F | Connor, Clark & Lunn Investment Management Ltd. | 0 | -100,00 | 0 | |||||
| 2026-04-02 | 13F | Ares Financial Consulting, LLC | 19 | 0,00 | 1 | |||||
| 2026-02-13 | 13F | Partners Capital Investment Group, Llp | 10.507 | 0,00 | 451 | -9,26 | ||||
| 2026-02-11 | 13F | Parallel Advisors, LLC | 432 | 17,71 | 19 | 5,88 | ||||
| 2026-04-07 | 13F | Central Pacific Bank - Trust Division | 0 | -100,00 | 0 | |||||
| 2026-04-16 | 13F | SG Americas Securities, LLC | 10.796 | 0 | ||||||
| 2026-02-17 | 13F | Two Sigma Investments, Lp | 354.605 | -40,02 | 15.230 | -45,63 | ||||
| 2026-02-17 | 13F | Man Group plc | 7.722 | 332 | ||||||
| 2026-02-13 | 13F | Fairbanks Capital Management, Inc. | 0 | -100,00 | 0 | |||||
| 2026-02-12 | 13F | Ensign Peak Advisors, Inc | 12.700 | 0,00 | 546 | -9,30 | ||||
| 2026-02-17 | 13F | Citadel Advisors Llc | Call | 5.700 | -70,47 | 245 | -73,30 | |||
| 2026-01-21 | 13F | Palumbo Wealth Management LLC | 6.765 | 0,00 | 291 | -9,37 | ||||
| 2026-02-06 | 13F | Berbice Capital Management LLC | 0 | -100,00 | 0 | |||||
| 2026-02-17 | 13F | Citadel Advisors Llc | 1.375.115 | 880,12 | 59.061 | 788,54 | ||||
| 2026-02-13 | 13F | Manufacturers Life Insurance Company, The | 0 | -100,00 | 0 | |||||
| 2026-02-17 | 13F | Signature Equity Partners, LLC | 24 | 1 | ||||||
| 2026-02-14 | 13F | Rockefeller Capital Management L.P. | 40.688 | 1,96 | 1.748 | -7,57 | ||||
| 2025-11-24 | 13F/A | Fulcrum Asset Management LLP | Put | 0 | -100,00 | 0 | -100,00 | |||
| 2026-02-17 | 13F | Woodline Partners LP | 745.127 | 844,27 | 32.003 | 756,15 | ||||
| 2026-02-17 | 13F | Price T Rowe Associates Inc /md/ | 136.487 | 8,35 | 6 | 0,00 | ||||
| 2026-02-17 | 13F | Creative Planning | 34.499 | 11,47 | 1.482 | 1,02 | ||||
| 2026-02-17 | 13F | Investment Management Corp of Ontario | 32.761 | 225,62 | 1.407 | 195,59 | ||||
| 2026-02-04 | 13F | LRI Investments, LLC | 373 | 12,69 | 16 | 6,67 | ||||
| 2026-04-14 | 13F | Banque Pictet & Cie Sa | 96.263 | 4.003 | ||||||
| 2026-02-13 | 13F | Natixis | 2.082 | -2,16 | 89 | -11,00 | ||||
| 2026-02-17 | 13F | Utah Retirement Systems | 30.102 | 0,00 | 1.295 | -9,32 | ||||
| 2026-02-18 | 13F | SkyView Investment Advisors, LLC | 23.509 | 0,49 | 1 | 0,00 | ||||
| 2025-11-03 | 13F | Pittenger & Anderson Inc | 0 | -100,00 | 0 | -100,00 | ||||
| 2025-11-14 | 13F | AXA Investment Managers S.A. | 288.084 | 13.649 | ||||||
| 2026-02-13 | 13F | Van Eck Associates Corp | 107.561 | 9,99 | 5 | 0,00 | ||||
| 2026-02-17 | 13F | Caisse De Depot Et Placement Du Quebec | 1.383.100 | 23,65 | 59.491 | 12,19 | ||||
| 2026-02-10 | 13F | Intech Investment Management Llc | 15.054 | 0,00 | 648 | -9,26 | ||||
| 2026-02-13 | 13F | Ubs Asset Management Americas Inc | 29 | -99,99 | 1 | -99,99 | ||||
| 2026-02-03 | 13F | Robeco Schweiz AG | 678.861 | 10,57 | 29.157 | 0,24 | ||||
| 2026-02-11 | 13F | Metis Global Partners, LLC | 0 | -100,00 | 0 | |||||
| 2025-11-14 | 13F | Yaupon Capital Management LP | 0 | -100,00 | 0 | |||||
| 2026-04-13 | 13F | True Wealth Design, LLC | 58 | -15,94 | 2 | 0,00 | ||||
| 2026-02-05 | 13F | Bessemer Group Inc | 91 | 0 | ||||||
| 2025-10-27 | 13F | Harbor Investment Advisory, Llc | 0 | -100,00 | 0 | |||||
| 2026-02-12 | 13F | Swiss National Bank | 647.300 | -8,91 | 27.863 | -17,31 | ||||
| 2026-02-13 | 13F | Stifel Financial Corp | 25.848 | -22,23 | 1.110 | -29,48 | ||||
| 2026-02-11 | 13F | Group One Trading, L.p. | Call | 13.600 | -27,66 | 584 | -34,38 | |||
| 2026-02-09 | 13F | Huntington National Bank | 186.050 | 0,00 | 7.991 | -9,36 | ||||
| 2026-02-20 | 13F | Sunbelt Securities, Inc. | 687 | 0,00 | 30 | -9,37 | ||||
| 2026-04-13 | 13F | IFP Advisors, Inc | 847 | 0,00 | 35 | -2,78 | ||||
| 2026-02-12 | 13F | Cruiser Capital Advisors, Llc | 117.767 | 0,00 | 5.058 | -9,37 | ||||
| 2026-02-02 | 13F | Millstone Evans Group, LLC | 246 | 0,00 | 11 | -9,09 | ||||
| 2026-01-08 | 13F | Nordea Investment Management Ab | 6.673.954 | 40,76 | 290.083 | 30,81 | ||||
| 2026-02-13 | 13F | Alberta Investment Management Corp | 770.000 | 33.077 | ||||||
| 2026-02-10 | 13F/A | Northwestern Mutual Wealth Management Co | 90 | 291,30 | 4 | 200,00 | ||||
| 2026-02-12 | 13F | Ci Investments Inc. | 332.488 | 42,42 | 14.280 | 129.718,18 | ||||
| 2026-02-17 | 13F | ArrowMark Colorado Holdings LLC | 18.029 | -97,29 | 774 | -97,55 | ||||
| 2026-02-10 | 13F | Capital Innovations LLC | 106.981 | 4.595 | ||||||
| 2026-02-12 | 13F | Campbell & CO Investment Adviser LLC | 11.385 | 489 | ||||||
| 2025-11-14 | 13F/A | Weiss Asset Management LP | 0 | -100,00 | 0 | -100,00 | ||||
| 2026-02-12 | 13F | Groupe la Francaise | 43.867 | 8,01 | 1.884 | -2,13 | ||||
| 2026-02-12 | 13F | Wealthspire Advisors, LLC | 0 | -100,00 | 0 | |||||
| 2026-02-13 | 13F | Public Sector Pension Investment Board | 15.524 | 667 | ||||||
| 2026-02-12 | 13F | APG Asset Management N.V. | 177.056 | -10,49 | 6.475 | -18,82 | ||||
| 2026-02-17 | 13F | Silvercrest Asset Management Group Llc | 14.430 | 2,00 | 620 | -7,61 | ||||
| 2026-02-17 | 13F | Canada Pension Plan Investment Board | 385.755 | -60,03 | 16.571 | -63,77 | ||||
| 2026-02-17 | 13F | Capital Insight Partners, Llc | 39.034 | -4,31 | 1.674 | -13,41 | ||||
| 2026-02-17 | 13F | FIL Ltd | 96.554 | 0,00 | 4.148 | -9,37 | ||||
| 2026-02-02 | 13F | Truist Financial Corp | 18.616 | 11,61 | 800 | 1,14 | ||||
| 2026-02-11 | 13F | Franklin Resources Inc | 124.520 | 2,66 | 5.349 | -6,94 | ||||
| 2026-02-13 | 13F | Y-Intercept (Hong Kong) Ltd | 5.378 | 231 | ||||||
| 2026-02-11 | 13F | CenterBook Partners LP | 37.809 | 1.624 | ||||||
| 2026-02-13 | 13F | Mml Investors Services, Llc | 5.298 | -10,46 | 228 | -18,93 | ||||
| 2026-02-13 | 13F | Healthcare Of Ontario Pension Plan Trust Fund | 192.997 | 8.289 | ||||||
| 2026-02-17 | 13F | ExodusPoint Capital Management, LP | 0 | -100,00 | 0 | -100,00 | ||||
| 2026-02-04 | 13F | Colonial River Wealth Management, LLC | 11.253 | -41,51 | 483 | -46,98 | ||||
| 2026-04-08 | 13F | Wealth Enhancement Advisory Services, Llc | 5.580 | -35,26 | 249 | -32,61 | ||||
| 2026-02-09 | 13F | Harbour Investments, Inc. | 150 | 0,00 | 6 | -14,29 | ||||
| 2026-02-06 | 13F | Envestnet Portfolio Solutions, Inc. | 0 | -100,00 | 0 | |||||
| 2026-04-06 | 13F | CX Institutional | 0 | -100,00 | 0 | |||||
| 2026-02-03 | 13F | Generali Asset Management SPA SGR | 30.905 | 1.822 | ||||||
| 2026-02-05 | 13F | Atria Investments Llc | 7.550 | -2,86 | 324 | -11,96 | ||||
| 2026-02-17 | 13F | Jain Global LLC | 18.000 | 773 | ||||||
| 2026-02-12 | 13F | Bank Of Montreal /can/ | 1.833.982 | 19,45 | 78.783 | 8,29 | ||||
| 2026-02-17 | 13F | Lighthouse Investment Partners, LLC | 0 | -100,00 | 0 | |||||
| 2026-02-13 | 13F | BRITISH COLUMBIA INVESTMENT MANAGEMENT Corp | 142.226 | -9,93 | 6.110 | -18,35 | ||||
| 2026-04-08 | 13F | Grove Bank & Trust | 204 | 7,37 | 9 | 0,00 | ||||
| 2025-11-14 | 13F | Point72 (DIFC) Ltd | 3.300 | 57,14 | 156 | 48,57 | ||||
| 2026-02-18 | 13F | Mackenzie Financial Corp | 563.108 | 82,03 | 24.545 | 67,44 | ||||
| 2026-02-09 | 13F | MSH Capital Advisors LLC | 5.000 | 0,00 | 215 | -9,32 | ||||
| 2026-02-12 | 13F | Scotia Capital Inc. | 30.616 | 6,46 | 1.312 | -2,53 | ||||
| 2026-01-27 | 13F | Zurcher Kantonalbank (Zurich Cantonalbank) | 110.886 | 42,97 | 4.770 | 29,73 | ||||
| 2026-02-06 | 13F | Pnc Financial Services Group, Inc. | 4.387 | -40,89 | 188 | -46,44 | ||||
| 2026-02-23 | 13F | Mv Capital Management, Inc. | 3 | 0 | ||||||
| 2026-02-13 | 13F | Walleye Trading LLC | Call | 0 | -100,00 | 0 | ||||
| 2026-02-17 | 13F | Russell Investments Group, Ltd. | 177.106 | -1,43 | 7.610 | -10,63 | ||||
| 2026-02-17 | 13F | ADW Capital Management, LLC | 1.010.000 | 0,00 | 43.380 | -9,35 | ||||
| 2026-01-22 | 13F | Financial Consulate, Inc | 38 | 2 | ||||||
| 2026-02-06 | 13F | EverSource Wealth Advisors, LLC | 975 | 27,62 | 42 | 13,89 | ||||
| 2026-02-13 | 13F | Walleye Trading LLC | 0 | -100,00 | 0 | |||||
| 2026-02-17 | 13F | Cape Investment Advisory, Inc. | 1.475 | 63 | ||||||
| 2026-02-13 | 13F | Pinnacle Wealth Planning Services, Inc. | 1.197 | 51 | ||||||
| 2026-02-13 | 13F | Dynamic Technology Lab Private Ltd | 20.341 | 874 | ||||||
| 2026-02-11 | 13F | Capital Analysts, Inc. | 57 | 0,00 | 0 | |||||
| 2026-02-17 | 13F | Aquatic Capital Management LLC | 9.866 | 424 | ||||||
| 2026-01-14 | 13F | Net Worth Advisory Group | 10.144 | -11,46 | 436 | -19,74 | ||||
| 2025-11-14 | 13F | Williamson Legacy Group, LLC | 0 | -100,00 | 0 | |||||
| 2026-01-14 | 13F | Jfs Wealth Advisors, Llc | 41 | 0,00 | 2 | 0,00 | ||||
| 2026-02-17 | 13F | Boothbay Fund Management, Llc | 173.445 | 48,55 | 7.450 | 34,68 | ||||
| 2026-02-03 | 13F | SBI Securities Co., Ltd. | 32 | 0,00 | 1 | 0,00 | ||||
| 2026-02-05 | 13F | Elyxium Wealth, LLC | 37 | 2 | ||||||
| 2026-02-11 | 13F | Allianz Asset Management GmbH | 62.102 | -2,28 | 2.671 | -11,26 | ||||
| 2026-02-12 | 13F | Steward Partners Investment Advisory, Llc | 311 | 0,00 | 13 | -7,14 | ||||
| 2026-02-17 | 13F | Hood River Capital Management LLC | 585.346 | 0,25 | 25.141 | -9,12 | ||||
| 2026-01-15 | 13F | Mn Services Vermogensbeheer B.V. | 79.682 | 1,25 | 3 | 0,00 | ||||
| 2026-02-14 | 13F | Norwood Investment Partners, LP | 297.920 | 12,51 | 12.796 | 1,98 | ||||
| 2025-11-06 | 13F | Whipplewood Advisors, LLC | 0 | -100,00 | 0 | |||||
| 2026-04-13 | 13F | Creative Financial Designs Inc /adv | 0 | -100,00 | 0 | |||||
| 2026-04-17 | 13F | Verde Servicos Internacionais S.A. | 211.142 | -33,31 | 9 | -38,46 | ||||
| 2026-02-06 | 13F | Larson Financial Group LLC | 21 | 250,00 | 1 | |||||
| 2026-02-13 | 13F | National Bank Of Canada /fi/ | 282.505 | 29,59 | 12.130 | 18,06 | ||||
| 2026-02-12 | 13F | Paralel Advisors LLC | 1.000.000 | 0,00 | 42.950 | -9,35 | ||||
| 2026-02-17 | 13F | Advisor Group Holdings, Inc. | 2.295 | -7,65 | 99 | -19,67 | ||||
| 2026-02-13 | 13F | Woodbridge CO LTD | 463.635 | 0,00 | 19.913 | -9,35 | ||||
| 2026-02-18 | 13F | Skyview Financial Group LLC | 11.402 | 490 | ||||||
| 2026-02-04 | 13F | Rinkey Investments | 5.185 | 223 | ||||||
| 2026-02-11 | 13F | Janney Capital Management LLC | 9.134 | 1,73 | 0 | |||||
| 2025-11-14 | 13F | Shay Capital LLC | 0 | -100,00 | 0 | -100,00 | ||||
| 2026-03-02 | 13F | Bank Of Hawaii | 15.563 | -37,83 | 668 | -43,68 | ||||
| 2025-11-03 | 13F | Abn Amro Investment Solutions | 0 | -100,00 | 0 | |||||
| 2026-02-17 | 13F | Qube Research & Technologies Ltd | 164.505 | -62,69 | 7.066 | -66,18 | ||||
| 2026-02-13 | 13F | BNP Paribas Asset Management Holding S.A. | 239.126 | 10 | ||||||
| 2026-02-02 | 13F | Wolverine Asset Management Llc | Put | 0 | -100,00 | 0 | ||||
| 2026-02-17 | 13F | Capital Fund Management S.a. | 43.974 | 1.889 | ||||||
| 2025-11-13 | 13F | Barometer Capital Management Inc. | 0 | -100,00 | 0 | -100,00 | ||||
| 2026-01-20 | 13F | Harbor Capital Advisors, Inc. | 11.724 | -4,47 | 1 | |||||
| 2026-02-04 | 13F | Summit Wealth Group Llc / Co | 0 | -100,00 | 0 | -100,00 | ||||
| 2026-01-26 | 13F | Cwm, Llc | 73 | -82,70 | 0 | |||||
| 2026-02-17 | 13F | Aster Capital Management (DIFC) Ltd | 580 | 25 | ||||||
| 2026-03-02 | 13F | Tobam | 3.079 | 10,52 | 0 | |||||
| 2026-02-17 | 13F | Aventail Capital Group, LP | 0 | -100,00 | 0 | |||||
| 2026-02-13 | 13F | Cornerstone Financial Management LLC | 40 | 2 | ||||||
| 2026-02-17 | 13F | Polar Asset Management Partners Inc. | 58.000 | -10,77 | 2.492 | -19,06 | ||||
| 2026-02-11 | 13F | LPL Financial LLC | 127.264 | 29,53 | 5.466 | 17,43 | ||||
| 2026-01-30 | 13F | R Squared Ltd | 7.875 | 338 | ||||||
| 2026-02-17 | 13F | Fmr Llc | 26.532.066 | -2,14 | 1.139.708 | -11,30 | ||||
| 2026-01-29 | 13F | UBS Group AG | 248.458 | -87,24 | 10.671 | -88,43 | ||||
| 2026-02-10 | 13F | ESL Trust Services, LLC | 0 | -100,00 | 0 | |||||
| 2026-02-10 | 13F | Goldman Sachs Group Inc | 335.610 | -73,42 | 14.414 | -75,91 | ||||
| 2026-02-12 | 13F | Verbena Value LP | 837.100 | 35.953 | ||||||
| 2026-04-07 | 13F | CoreCap Advisors, LLC | 68 | 0,00 | 3 | 0,00 | ||||
| 2026-01-27 | 13F | TD Waterhouse Canada Inc. | 44.006 | -5,08 | 1.885 | -12,28 | ||||
| 2026-02-10 | 13F | Td Asset Management Inc | 1.014.170 | -5,93 | 43.622 | -14,65 | ||||
| 2026-02-17 | 13F | Artisan Partners Limited Partnership | 7.340 | 315 | ||||||
| 2026-02-13 | 13F | Ontario Teachers Pension Plan Board | 22.450.784 | -7,60 | 964.428 | -16,18 | ||||
| 2026-02-12 | 13F | Principal Securities, Inc. | 0 | -100,00 | 0 | -100,00 | ||||
| 2026-01-21 | 13F | Greenleaf Trust | 12.708 | 0,79 | 546 | -8,71 | ||||
| 2026-02-11 | 13F | 111 Capital | 5.052 | 217 | ||||||
| 2026-02-17 | 13F | Gotham Asset Management, LLC | 406.434 | 264,60 | 17.456 | 230,54 | ||||
| 2026-02-17 | 13F | Susquehanna Advisors Group, Inc. | 47.933 | 2.059 | ||||||
| 2026-02-13 | 13F | Strategic Global Advisors, LLC | 0 | -100,00 | 0 | |||||
| 2026-02-02 | 13F | Cornerstone Planning Group LLC | 69 | -15,85 | 3 | 0,00 | ||||
| 2026-02-10 | 13F | Nomura Asset Management Co Ltd | 0 | 0 | ||||||
| 2026-01-22 | 13F | Massachusetts Financial Services Co /ma/ | 11.201.976 | 9,56 | 481.125 | -0,69 | ||||
| 2026-02-03 | 13F | Winch Advisory Services, LLC | 185 | 0,00 | 8 | -12,50 | ||||
| 2026-02-13 | 13F | Victory Capital Management Inc | 34.400 | 2.028 | ||||||
| 2026-02-17 | 13F | Blackstone Group Inc | 0 | -100,00 | 0 | |||||
| 2026-02-17 | 13F | Alliancebernstein L.p. | 123.151 | -44,89 | 5.289 | -50,05 | ||||
| 2026-02-27 | 13F | Compass Financial Services Inc | 820 | 0,00 | 35 | -7,89 | ||||
| 2026-02-10 | 13F | Seven Grand Managers, Llc | 150.000 | 6.442 | ||||||
| 2026-02-05 | 13F | Td Private Client Wealth Llc | 89 | 11,25 | 4 | 0,00 | ||||
| 2025-11-07 | 13F | NEOS Investment Management LLC | 0 | -100,00 | 0 | |||||
| 2025-11-14 | 13F | Ghisallo Capital Management LLC | 0 | -100,00 | 0 | |||||
| 2026-02-17 | 13F | Two Sigma Advisers, Lp | 95.600 | 18,91 | 4.106 | 7,80 | ||||
| 2026-02-17 | 13F | Covalis Capital Llp | 350.000 | 15.032 | ||||||
| 2026-02-13 | 13F | GM Advisory Group, Inc. | 18.438 | 0,00 | 792 | -9,50 | ||||
| 2026-01-21 | 13F | Rocky Mountain Advisers, Llc | 4.500 | 0,00 | 193 | -9,39 | ||||
| 2026-02-13 | 13F | 1832 Asset Management L.P. | 616.200 | 0,00 | 26.466 | -9,35 | ||||
| 2026-02-18 | 13F | GWM Advisors LLC | 213 | 0,00 | 9 | -10,00 | ||||
| 2026-02-12 | 13F | CIBC Private Wealth Group, LLC | 250.283 | 0,00 | 10.750 | -9,35 | ||||
| 2026-02-17 | 13F | Millennium Management Llc | 2.539.067 | 5,25 | 109.053 | -4,59 | ||||
| 2026-02-17 | 13F | Quantinno Capital Management LP | 36.164 | 6,85 | 1.553 | -3,12 | ||||
| 2026-02-05 | 13F | Allworth Financial LP | 368 | 0,55 | 16 | -11,76 | ||||
| 2026-02-13 | 13F | Centiva Capital, LP | 10.507 | 451 | ||||||
| 2025-11-13 | 13F | Macquarie Group Ltd | 0 | -100,00 | 0 | -100,00 | ||||
| 2025-11-14 | 13F | Skopos Labs, Inc. | 0 | -100,00 | 0 | |||||
| 2026-01-28 | 13F | DekaBank Deutsche Girozentrale | 21.066 | 0,00 | 1 | |||||
| 2026-02-17 | 13F | Janus Henderson Group Plc | 17.762 | 0,00 | 771 | -8,33 | ||||
| 2026-01-28 | 13F | WPG Advisers, LLC | 1.210 | 9,21 | 52 | -1,92 | ||||
| 2026-02-12 | 13F | BRYN MAWR TRUST Co | 0 | -100,00 | 0 | -100,00 | ||||
| 2026-02-11 | 13F | Erste Asset Management GmbH | 0 | 0 | ||||||
| 2026-02-12 | 13F | Federation des caisses Desjardins du Quebec | 46.048 | -69,22 | 1.974 | -72,05 | ||||
| 2025-10-22 | 13F | Geneos Wealth Management Inc. | 0 | -100,00 | 0 | -100,00 | ||||
| 2026-02-12 | 13F | Dimensional Fund Advisors Lp | 517.110 | 7,21 | 22.213 | -2,79 | ||||
| 2026-02-06 | 13F | Pinnbrook Capital Management Lp | 0 | -100,00 | 0 | |||||
| 2026-02-13 | 13F | Royal London Asset Management Ltd | 6.247 | 0,00 | 268 | -9,15 | ||||
| 2026-02-17 | 13F | Public Employees Retirement System Of Ohio | 14.451 | 1,33 | 622 | -8,00 | ||||
| 2026-02-13 | 13F | Korea Investment CORP | 195.482 | -25,55 | 8.408 | -32,45 | ||||
| 2025-11-14 | 13F | Cubist Systematic Strategies, LLC | 255.414 | -5,23 | 12.102 | -11,02 | ||||
| 2025-10-21 | 13F | Goldstein Advisors, LLC | 0 | -100,00 | 0 | |||||
| 2026-02-17 | 13F | Voloridge Investment Management, Llc | 138.264 | 5.938 | ||||||
| 2026-02-23 | 13F | Beaird Harris Wealth Management, LLC | 10 | 0,00 | 0 | |||||
| 2026-02-13 | 13F | Walleye Capital LLC | 322.023 | 292,80 | 13.831 | 256,08 | ||||
| 2026-02-12 | 13F | Nuveen, LLC | 909.822 | 135,32 | 39.120 | 113,50 | ||||
| 2026-01-29 | 13F | Sanctuary Advisors, LLC | 5.268 | -18,45 | 226 | -26,14 | ||||
| 2026-02-11 | 13F | O'shaughnessy Asset Management, Llc | 13.010 | -66,90 | 559 | -70,03 | ||||
| 2026-02-13 | 13F | Smartleaf Asset Management LLC | 121 | -31,25 | 5 | -37,50 | ||||
| 2025-11-14 | 13F | Sofos Investments, Inc. | 0 | -100,00 | 0 | |||||
| 2025-11-13 | 13F | Baird Financial Group, Inc. | 0 | -100,00 | 0 | |||||
| 2026-02-13 | 13F | Walleye Capital LLC | Call | 500 | -88,64 | 21 | -89,90 | |||
| 2026-02-13 | 13F | MAI Capital Management | 300 | -7,41 | 13 | -20,00 | ||||
| 2026-02-13 | 13F | Verition Fund Management LLC | 0 | -100,00 | 0 | |||||
| 2026-02-13 | 13F | Charles Schwab Investment Management Inc | 622.549 | 0,81 | 26.778 | -8,53 | ||||
| 2026-02-17 | 13F | Munro Partners | 658.407 | 90,90 | 28.279 | 73,06 | ||||
| 2026-01-29 | 13F | Quest 10 Wealth Builders, Inc. | 0 | -100,00 | 0 | |||||
| 2026-02-13 | 13F | Caitong International Asset Management Co., Ltd | 0 | -100,00 | 0 | |||||
| 2026-02-17 | 13F | Schonfeld Strategic Advisors LLC | 60.858 | 1.223,58 | 2.614 | 1.104,15 | ||||
| 2026-02-17 | 13F | XTX Topco Ltd | 10.392 | -62,52 | 446 | -66,03 | ||||
| 2026-02-13 | 13F | Bornite Capital Management LP | 1.342.400 | 80,82 | 57.656 | 63,92 | ||||
| 2026-03-06 | 13F | Hsbc Holdings Plc | 0 | -100,00 | 0 | |||||
| 2026-04-07 | 13F | Signaturefd, Llc | 2.635 | -5,45 | 110 | -8,40 | ||||
| 2026-04-15 | 13F | Atwood & Palmer Inc | 500 | 0,00 | 21 | -4,76 | ||||
| 2026-04-15 | 13F | Avanza Fonder AB | 23.875 | 0,00 | 1.385 | -1,56 | ||||
| 2026-02-13 | 13F | Kestra Advisory Services, LLC | 3.634 | 156 | ||||||
| 2026-02-17 | 13F | Wellington Management Group Llp | 2.668.607 | 32,66 | 114.619 | 20,26 | ||||
| 2025-11-14 | 13F | Point72 Asia (Singapore) Pte. Ltd. | 0 | -100,00 | 0 | -100,00 | ||||
| 2026-02-13 | 13F | Rhumbline Advisers | 4 | 0,00 | 0 | |||||
| 2026-02-13 | 13F | SRS Capital Advisors, Inc. | 532 | 706,06 | 23 | 633,33 | ||||
| 2026-02-17 | 13F | Balyasny Asset Management Llc | 1.124.140 | 288,08 | 48.282 | 251,78 | ||||
| 2026-02-02 | 13F | Montag A & Associates Inc | 325 | 0,00 | 14 | -13,33 | ||||
| 2025-11-14 | 13F | Wolverine Trading, Llc | Put | 22.500 | 20,97 | 1.055 | 14,18 | |||
| 2026-04-20 | 13F | Barton Investment Management | 419.475 | -0,16 | 17.500 | -3,02 | ||||
| 2025-11-12 | 13F | Forge First Asset Management Inc. | 416.100 | 42,89 | 19.713 | 34,31 | ||||
| 2026-02-09 | 13F | Legal & General Group Plc | 1.225.212 | 12,01 | 52.700 | 1,63 | ||||
| 2026-02-17 | 13F | Panoramic Capital, LLC | 0 | -100,00 | 0 | |||||
| 2026-02-17 | 13F | Ameriprise Financial Inc | 6.504 | 40,81 | 369 | 23,00 | ||||
| 2026-02-17 | 13F | Susquehanna International Group, Llp | Call | 12.700 | -66,31 | 545 | -69,48 | |||
| 2026-02-10 | 13F | Hallstatt Advisors L.p. | 193.551 | 8.313 | ||||||
| 2025-11-14 | 13F | Wolverine Trading, Llc | Call | 5.800 | 41,46 | 272 | 33,50 | |||
| 2026-02-11 | 13F | Deutsche Bank Ag\ | 3.873.804 | -4,13 | 166.380 | -13,09 | ||||
| 2026-02-17 | 13F | Susquehanna International Group, Llp | 4.862 | -40,45 | 209 | -46,11 | ||||
| 2026-02-17 | 13F | Susquehanna International Group, Llp | Put | 11.600 | -75,05 | 498 | -77,39 | |||
| 2026-02-06 | 13F | Axxcess Wealth Management, Llc | 11.351 | -41,00 | 488 | -46,54 |